


Abstract
Transthyretin amyloidosis (ATTR amyloidosis) is a heterogeneous disorder with cardiac, neurologic, and mixed phenotypes. We describe the phenotypic and genotypic profiles of this disease in continental Western Europe as it appears from the Transthyretin Amyloidosis Survey (THAOS).
THAOS is an ongoing, worldwide, longitudinal, observational survey established to study differences in presentation, diagnosis, and natural history in ATTR amyloidosis subjects. At data cut-off, 1411 symptomatic subjects from nine continental Western European countries were enrolled in THAOS [1286 hereditary (ATTRm) amyloidosis; 125 wild-type ATTR (ATTRwt) amyloidosis]. Genotypes and phenotypes varied notably by country. Four mutations (Val122Ile, Leu111Met, Thr60Ala, and Ile68Leu), and ATTRwt, were associated with a mainly cardiac phenotype showing symmetric left ventricular (LV) hypertrophy, normal diastolic LV dimensions and volume, and mildly depressed LV ejection fraction (LVEF). Morphologic and functional abnormalities on echocardiogram were significantly more severe in subjects with cardiac (n‘= 210), compared with a mixed (n = 298), phenotype: higher median (Q1–Q3) interventricular septal thickness [18 (16–21) vs. 16 (13–20) mm; P = 0.0006]; and more frequent incidence of LVEF <50% (38.1 vs. 17.5%; P = 0.0008). Subjects with cardiac mutations or ATTRwt (or cardiac or mixed phenotype) had a lower survival rate than subjects in other genotype (or the neurologic phenotype) categories (P < 0.0001, for both).
ATTR amyloidosis genotypes and phenotypes are highly heterogeneous in continental Western Europe. A geographic map of the different disease profiles and awareness that a subset of subjects have a dominant cardiac phenotype, mimicking hypertrophic cardiomyopathy, at presentation can facilitate the clinical recognition of this underdiagnosed disease.
ClinicalTrials.gov: NCT00628745.
See the editorial comment for this article ‘Transthyretin amyloidosis in Western Europe: a snapshot from the THAOS registry and a call for further perspectives’, by Enrico Ammirati and Omar F. AbouEzzeddine, https://doi.org/10.1093/eurheartj/ehz205.
Introduction
Transthyretin amyloidosis (ATTR amyloidosis) is a group of severe diseases with a broad spectrum of genotypes and heterogeneous phenotypes caused by transthyretin (TTR) gene mutations. ATTR amyloidosis is characterized by the deposition of amyloid fibrils in the heart, peripheral nerves, and other organs.1 , 2 At the level of the heart, insoluble misfolded TTR proteins infiltrate the extracellular matrix, increasing ventricular wall thickness and stiffness of the myocardium, causing an increase in intraventricular pressure with minimal increases in volume.2 Patients display a phenotype of hypertrophic cardiomyopathy, associated with heart failure and a poor prognosis.2 , 3 This pattern and symptoms are non-specific and frequently observed in other cardiac diseases, such as hypertensive heart disease or heart failure with preserved ejection fraction.
ATTR amyloidosis has two distinct forms: wild-type ATTR (ATTRwt) amyloidosis (also known as senile systemic amyloidosis) and hereditary ATTR (ATTRm) amyloidosis.4 There are more than 100 known pathogenic mutations in the TTR gene5 , 6 including Val30Met, the first described pathogenic mutation,7 which is endemic in Portugal, Sweden, Cyprus, and Majorca.8
While TTR mutations may be associated with a specific phenotype,1 , 2 , 9 , 10 phenotypes may also be influenced by other factors, for example, patient’s country of origin. In Portuguese patients with Val30Met, symptoms emerge in the third decade (defined as early-onset: age <50 years), while in Val30Met patients from other European countries symptoms emerge in the seventh decade (late-onset: age >50 years), and often with a mixed phenotype.11–13 Other factors such as age, sex, fibril type, and maternal inheritance may also influence phenotype.2 , 11 , 14
A patient’s prognosis varies depending on their mutation, age at disease onset, phenotype (cardiac and/or neurologic), and any delay in diagnosis.8 Misdiagnosis may, of course, lead to inappropriate cardiac management of the condition.2 Recent European Society of Cardiology (ESC) guidelines recommend the consideration of a diagnosis of ATTR-CM in patients with hypertrophic cardiomyopathy.16 Therefore, heterogeneity in the frequency of different mutations and phenotypes, age of onset, and prognosis between European countries8 , 10 emphasizes the need to provide more clinical and prognostic data to European cardiologists to increase their awareness and diagnostic skills. With disease modifying treatments being developed,15 , 17–19 it is even more important to improve our understanding of the distribution of patients and of areas of potential underdiagnosis.
Our aims were to investigate genotype distribution, cardiac profile, and the different phenotypes of ATTR amyloidosis observed in Europe using the Transthyretin Amyloidosis Outcomes Survey (THAOS)20 and to produce clinical and biological cardiac disease profiles of patients with ATTR amyloidosis.
Methods
Source data
THAOS was established in 2007 and is the largest ongoing, worldwide, longitudinal, observational survey created to study differences in disease presentation, diagnosis, and natural history in a large, geographically dispersed, heterogeneous patient population, and to generate descriptive safety summaries in treated subjects (ClinicalTrials.gov: NCT00628745).20 All study sites received ethical or institutional review board approval prior to subject enrolment, and each subject provided written informed consent. The study followed the International Conference on Harmonisation Good Clinical Practice guidelines and the principles of the Declaration of Helsinki. Data were collected during routine clinical practice at the discretion of the investigator and include cardiac and neurologic findings, renal function assessments, quality of life assessments, hospitalizations, medications, and transplant history.20 THAOS is sponsored by Pfizer, which provides financial support for the development and maintenance of the database and compensation to the survey sites for data collection.20
Study population and assessments
All symptomatic subjects with confirmed ATTRwt or ATTRm enrolled in the THAOS registry in European countries were included in the analysis. Baseline electrocardiograph data and interventricular septal thickness measurements were collected for the THAOS registry and these data were assessed with respect to subject’s geographical location, genotype, and baseline characteristics (all at time of enrolment in THAOS). Subjects were grouped by both genotype and phenotype. Genotype categories were: ATTRwt; mutations associated with cardiac disease (Val122Ile,21 Leu111Met,22 Thr60Ala,23 or Ile68Leu24); Val30Met mutation with early-onset disease (onset age <50 years); Val30Met mutation with late-onset disease (age ≥50 years); and all other mutations. Phenotype categories, based on clinical presentation at the time of inclusion in THAOS were: mainly neurologic [i.e. TTR-familial amyloid polyneuropathy (TTR-FAP)]; mainly cardiac (i.e. a cardiac phenotype); and mixed (cardiac + neurologic) (see Supplementary material online for further details).
Simple binary and continuous variables are shown using descriptive statistics. Differences in mean outcomes between genotype and phenotype groups were assessed for statistical significance by: analysis of variance, to calculate P-values by comparing means between groups for continuous variables; the Pearson χ2 test to calculate P-values for variables with cell counts >5; the Kruskal–Wallis test to calculate P-values by comparing medians between groups for continuous variables; and the Fisher’s exact test to calculate P-values for non-ordinal variables with cell counts ≤5. Follow-up data were obtained from the periodical, scheduled visits (with 6-month intervals). In cases in which no follow-up visits had been made at 1 year from the previous visit, the investigators from the centre enrolling the patient were invited to contact the patient (or relatives) by telephone to retrieve data on vital status. Survival (time to death) and heart transplant-free survival (time to death or heart transplant) were assessed by multivariable prognosis model and shown by the Kaplan–Meier survival curves with Cox proportional hazards model adjusted by age and sex.
Results
Subject demographics and genotype
As of January 2016, 1417 symptomatic subjects in nine European countries were enrolled in THAOS, all of these in continental Western Europe. Of these, there were 1411 symptomatic subjects across the nine countries with subject data (Table 1 and Figure 1 show the distribution across countries). Of the symptomatic subjects, 125 had ATTRwt [115 males (92.0%) and 10 females (8.0%)], and 1286 had ATTRm [677 males (52.6%) and 609 females (47.4%)]. There were 54 different TTR mutations represented in the population; 16 of these were shared by ≥5 subjects (Table 1).
Phenotype and genotype by countrya
| Germany (N = 125) | Denmark (N = 23) | Spain (N = 76) | France (N = 94) | Italy (N = 161) | Portugal (N = 786) | Sweden (N = 142) | Totala (N = 1411) | |
|---|---|---|---|---|---|---|---|---|
| Phenotype, n (%) | ||||||||
| Cardiac | 64 (51.2) | 18 (78.3) | 13 (17.1) | 13 (13.8) | 58 (36.0) | 25 (3.2) | 19 (13.4) | 210 (14.9) |
| Cardiac + neurologic | 22 (17.6) | 2 (8.7) | 20 (26.3) | 39 (41.5) | 45 (28.0) | 135 (17.2) | 32 (22.5) | 298 (21.1) |
| Neurologic | 39 (31.2) | 3 (13.0) | 43 (56.6) | 42 (44.7) | 58 (36.0) | 626 (79.6) | 91 (64.1) | 903 (64.0) |
| Genotype, n | ||||||||
| Val30Met | 24 | 0 | 56 | 42 | 7 | 779 | 128 | 1038 |
| Wild type | 52 | 11 | 3 | 3 | 55 | 0 | 1 | 125 |
| Ile68Leu | 1 | 0 | 0 | 1 | 26 | 0 | 0 | 28 |
| Glu89Gln | 0 | 0 | 1 | 0 | 24 | 0 | 0 | 25 |
| Phe64Leu | 0 | 0 | 0 | 0 | 19 | 0 | 0 | 19 |
| Val122Ile | 0 | 0 | 3 | 12 | 2 | 0 | 1 | 18 |
| Ser77Tyr | 0 | 0 | 2 | 15 | 0 | 0 | 0 | 17 |
| Gly47Ala | 11 | 0 | 0 | 0 | 4 | 0 | 0 | 15 |
| Val20Ile | 12 | 0 | 0 | 0 | 0 | 0 | 0 | 12 |
| Ile107Val | 6 | 0 | 0 | 5 | 0 | 0 | 0 | 11 |
| Leu111Met | 0 | 11 | 0 | 0 | 0 | 0 | 0 | 11 |
| Thr49Ala | 0 | 0 | 0 | 0 | 9 | 0 | 0 | 9 |
| Val28Met | 0 | 0 | 0 | 2 | 0 | 6 | 0 | 8 |
| Glu89Lys | 0 | 0 | 5 | 1 | 1 | 0 | 0 | 7 |
| His88Arg | 0 | 0 | 0 | 0 | 1 | 0 | 6 | 7 |
| DelVal122 | 1 | 0 | 4 | 0 | 0 | 0 | 0 | 5 |
| Thr59Lys | 2 | 0 | 0 | 0 | 3 | 0 | 0 | 5 |
| Thr60Ala | 0 | 0 | 0 | 0 | 0 | 0 | 1 | 1 |
| All other genotypesb | 16 | 1 | 2 | 13 | 10 | 1 | 5 | 50 |
| Genotype category, n (%) | ||||||||
| Wild type | 52 (41.6) | 11 (47.8) | 3 (3.9) | 3 (3.2) | 55 (34.2) | 0 | 1 (0.7) | 125 (8.9) |
| Cardiac mutationsc | 1 (0.80) | 11 (47.8) | 3 (3.9) | 13 (13.8) | 28 (17.4) | 0 | 2 (1.4) | 58 (4.1) |
| Val30Met early-onset | 13 (10.4) | 0 | 31 (40.8) | 27 (28.7) | 3 (1.9) | 646 (82.2) | 39 (27.5) | 761 (53.9) |
| Val30Met late-onset | 11 (8.8) | 0 | 25 (32.9) | 15 (16.0) | 4 (2.5) | 133 (16.9) | 89 (62.7) | 277 (19.6) |
| Other non-cardiac | 48 (38.4) | 1 (4.4) | 14 (18.4) | 36 (38.3) | 71 (44.1) | 7 (0.9) | 11 (7.8) | 190 (13.5) |
Not shown separately in table, but included in ‘Total’ column are: Belgium, three subjects with cardiac + neurologic phenotype including one subject each with Val30Met (early-onset), Glu54Leu, and Glu74Leu; Cyprus, one subject with neurologic phenotype, and Val30Met (early-onset). Thr60Ala is shown separately as it is a designated ‘cardiac mutation’.
All other genotypes with ≤3 subjects in total. These are genotypes Arg34Thr and Ser77Phe (three subjects each); Ala45Ser, Cys10Arg, Glu54Lys, Ile84Thr, Ser50Arg, Thr49Ile, Tyr116Ser, and Val71Ala (two subjects each); and Ala19Asp, Ala36Pro, Ala45Asp, Ala81Thr, Ala91Ser, Ala97Ser, Arg21Gln, Asp18Glu, Glu42Gly, Glu54Gln, Glu54Gly, Glu54Leu, Glu62Lys, Glu92Lys, Gly47Arg, Gly47Glu, Gly53Ala, Gly6Ser/Thr49Ile, Ile107Met, Phe84Leu, Ser23Asn, Ser52Pro, Thr40Asn, Thr75Ile, Val30Leu, and Val93Leu (one subject each).
Cardiac mutations are Val122Ile, Leu111Met, Thr60Ala, and Ile68Leu.
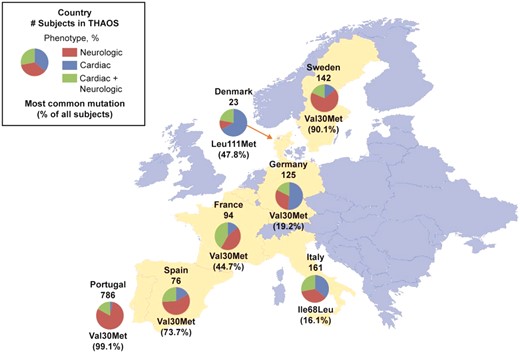
Subject phenotypes and most common genotype in subjects enrolled in THAOS in continental Western Europe. Data are from all European countries included in THAOS. Shown are: the total number of subjects from each country in THAOS, the proportions of each phenotype, and the most common mutation in each country (with its percentage of all subjects in that country). Not shown are: Belgium, three subjects with cardiac + neurologic phenotype (genotypes: Val30Met, Glu54Leu, and Glu74Leu); and Cyprus, one subject with neurologic phenotype (genotype: Val30Met). Note that the most common form of ATTR amyloidosis in Germany and Italy was ATTRwt (41.6% and 34.2% of all subjects, respectively).
In subjects with ATTRm in European countries in the THAOS registry, Val30Met was the most frequent mutation (1038 subjects, 73.6%), with most of these subjects being from Portugal, followed by Ile68Leu (28 subjects, 2.0%), with most subjects from Italy (Table 1). Types of mutations present differed highly between: Portugal and Sweden, in which there were endemic aggregations of Val30Met [779 (99.1%) and 128 (90.1%) subjects, respectively]; and the other European countries, which had a greater distribution of genotypes (Table 1). However, the majority of Val30Met subjects in Portugal were early-onset Val30Met, while the majority in Sweden were late-onset Val30Met (Supplementary material online, Figure S1). ATTRwt was observed in all countries except Portugal, Belgium, and Cyprus. There were also differences among countries in diagnostic pathways and treatment practices, and in subjects’ cardiac morphology, with Sweden having a higher proportion of subjects with a ratio of interventricular septal thickness to posterior wall thickness >1.3 (Supplementary material online, Tables S1 and S2).
Subject phenotypes by genotype category
Subject age, age at symptom onset, and sex varied significantly by genotype category (Supplementary material online, Table S3). Clinical phenotype at presentation in the overall registry was ‘cardiac’ in 210 subjects (14.9%), ‘cardiac + neurologic’ (mixed) in 298 subjects (21.1%), and ‘neurologic’ in 903 subjects (64.0%) (Table 2). The proportion of the neurologic phenotype in the overall cohort was driven by Portugal, Sweden, and Spain, where it was present in 79.6, 64.1, and 56.6% of subjects, respectively, mostly due to Val30Met. In other countries, such as Germany, Denmark, France, and Italy, most subjects had a cardiac or cardiac + neurologic phenotype (Table 1).
Selected electrocardiogram and echocardiogram characteristics by genotype category
| Genotype | Total (N = 1411) | ATTRwt (N = 125) | Four main cardiac mutations (N = 58) | Val30Met early-onset (N = 761) | Val30Met late-onset (N = 277) | Other mutations (N = 190) | P-value |
|---|---|---|---|---|---|---|---|
| Phenotype, n (%) | |||||||
| Cardiac | 210 (14.9) | 99 (79.2) | 28 (48.3) | 25 (3.3) | 25 (9.0) | 33 (17.4) | <0.0001 |
| Cardiac + neurologic | 298 (21.1) | 23 (18.4) | 17 (29.3) | 126 (16.6) | 74 (26.7) | 58 (30.5) | <0.0001 |
| Neurologic | 903 (64.0) | 3 (2.4) | 13 (22.4) | 610 (80.2) | 178 (64.3) | 99 (52.1) | <0.0001 |
| ECG abnormal, n (%) | 514 (53.8) | 104 (96.3) | 39 (81.3) | 188 (36.2) | 102 (62.6) | 81 (69.2) | <0.0001 |
| Pathologic Q-waves observed, n (%) | 113 (26.8) | 48 (50.0) | 17 (47.2) | 2 (1.4) | 18 (25.4) | 28 (35.9) | <0.0001 |
| Low voltage, n (%) | 98 (12.8) | 23 (24.0) | 15 (40.5) | 32 (7.5) | 4 (3.7) | 24 (24.5) | <0.0001 |
| Interval PR, median (Q1–Q3) | 168.0 (146.0–194.0) | 185.0 (130.0–208.0) | 186.0 (126.0–226.0) | 168.0 (148.0–191.5) | 172.0 (149.0–200.0) | 160.0 (140.0–183.0) | 0.2434 |
| Interval QRS, median (Q1–Q3) | 98.0 (89.0–112.0) | 122.0 (104.0–153.0) | 112.0 (90.0–124.0) | 94.0 (88.0–102.0) | 104.0 (94.0–118.0) | 98.0 (86.0–117.0) | <0.0001 |
| LBBB, n (%) | 53 (17.6) | 24 (31.2) | 10 (37.0) | 5 (5.2) | 8 (17.0) | 6 (11.1) | <0.0001 |
| RBBB, n (%) | 45 (14.7) | 17 (21.8) | 5 (17.9) | 3 (3.1) | 7 (14.6) | 13 (23.6) | 0.0019 |
| Diastolic interventricular septum thickness, median (Q1–Q3) | 15 (11–19) | 18 (16–21) | 17 (13–20) | 10 (9–12) | 15.5 (12–18) | 16 (12–20) | <0.0001 |
| LV diastolic diameter, median (Q1–Q3) | 45 (42–50) | 46 (42–50) | 46 (43–49) | 45 (42–49) | 47 (44–51) | 45 (40–49) | 0.0521 |
| LV ejection fraction (%), median (Q1–Q3) | 65.1 (54.3–71.1) | 55.5 (46.0–66.3) | 59.2 (51.1–69.0) | 69.5 (63.3–74.0) | 70.2 (61.8–74.9) | 62.5 (50.2–68.7) | <0.0001 |
| E-wave deceleration time (ms), median (Q1–Q3) | 183.0 (141.0–221.0) | 180.0 (144.0–205.0) | 160.0 (140.0–215.0) | 178.0 (129.0–204.0) | 228.0 (180.0–261.0) | 182.0 (141.0–218.0) | 0.0008 |
| Stroke volume (mL), median (Q1–Q3) | 68.0 (54.0–83.0) | 54.0 (39.0–68.0) | 50.0 (45.0–56.0) | 70.0 (56.5–82.0) | 82.0 (69.0–94.0) | 52.5 (42.0–64.5) | <0.0001 |
| RV free wall thickness, median (Q1–Q3) | 7.0 (5.0–8.0) | 9.0 (7.0–11.0) | 7.0 (7.0–9.0) | 6.0 (5.0–7.0) | 7.0 (5.0–9.0) | 6.0 (5.0–8.0) | 0.0008 |
| Aortic thickening, n (%) | 50 (24.3) | 16 (26.7) | 5 (20.8) | 10 (21.3) | 6 (27.3) | 13 (24.5) | 0.9537 |
| Mitral thickening, n (%) | 58 (27.9) | 23 (37.7) | 6 (24.0) | 5 (10.6) | 2 (9.1) | 22 (41.5) | 0.0009 |
| Tricuspid thickening, n (%) | 19 (9.5) | 12 (20.0) | 2 (8.7) | 0 (0.0) | 1 (4.5) | 4 (8.2) | 0.0100 |
| Sparkling, n (%) | 192 (50.7) | 63 (74.1) | 11 (39.3) | 42 (42.9) | 33 (44.6) | 43 (45.7) | <0.0001 |
Percentages shown are the proportion of subjects with each measure out of the total number of subjects for which data on that measure was available. Analysis of variance was performed to calculate P-values by comparing means between groups for continuous variables. The Pearson χ2 test was performed to calculate P-values for variables with cell counts >5. The Kruskal–Wallis test was performed to calculate P-values by comparing medians between groups for continuous variables. The Fisher’s exact test was performed to calculate P-values for non-ordinal variables with cell counts ≤5.
ATTRwt, wild-type ATTR amyloidosis; LBBB, left bundle branch block; LV, left ventricular; Q1, lower quartile; Q3, upper quartile; RBBB, right bundle branch block.
Clinical assessments by genotype category
ATTRwt subjects, and subjects with cardiac mutations, were more likely to: be male; have a greater age at symptom onset; have a history of palpitations or heart failure; be receiving treatment for heart disease; have higher levels of brain natriuretic peptide (BNP) and N-terminal pro-BNP (NTproBNP), troponin I + troponin T, and creatinine; and have a lower estimated glomerular filtration rate (Supplementary material online, Table S3). These subjects were also more likely to have abnormal electrocardiogram (ECG) results and showed normal diastolic left ventricular (LV) volume, symmetric LV hypertrophy, and mildly depressed LV ejection fraction (LVEF; Table 2). All genotype categories had increased diastolic interventricular septum thickness (median ≥15 mm), with the exception of early-onset Val30Met, which had a median of 10 mm (Table 2).
In the cardiac mutations category, subject demographics were similar between subjects with Val122Ile, Thr60Ala, and Ile68Leu mutations, while subjects with Leu111Met were significantly younger, and less likely to be male. Subjects with the Leu111Met mutation were 63.6% male and had a mean [standard deviation (SD)] age at enrolment and mean (SD) age at symptom onset of 47.6 (7.4) and 38.9 (8.9) years, compared with 86.9% male and 72.2 (9.8) and 65.1 (12.1) years in all subjects with cardiac mutations or ATTRwt.
Clinical assessments by phenotype category
Morphologic and functional abnormalities on echocardiogram were significantly more severe among subjects with the cardiac phenotype compared with the cardiac + neurologic phenotype (Table 3). The cardiac phenotype had: higher median (Q1–Q3) diastolic interventricular septum thickness [18 (16–21) vs. 16 (13–20) mm; P = 0.0006]; more frequent incidence of LVEF <50% (38.1 vs. 17.5%; P = 0.0008); and more frequent incidence of higher echo-Doppler restrictive filling pattern (>2 in 48.0 vs. 18.5%; P = 0.0240), compared with the cardiac + neurologic phenotype.
Comparisons of clinical and electrocardiogram and echocardiogram characteristics in symptomatic subjects with cardiac or cardiac + neurologic phenotype
| N (total) | Total (N = 508) | Cardiac (N = 210) | Cardiac + neurologic (N = 298) | P-value | |
|---|---|---|---|---|---|
| Age at onset (years), mean (SD) | 508 | 53.1 (16.9) | 60.8 (14.5) | 47.6 (16.3) | <0.0001 |
| Age at inclusion (years), mean (SD) | 508 | 61.3 (15.5) | 67.3 (13.5) | 57.0 (15.5) | <0.0001 |
| Sex, n (%) | 508 | <0.0001 | |||
| Male | 335 (65.9) | 164 (78.1) | 171 (57.4) | ||
| Female | 173 (34.1) | 46 (21.9) | 127 (42.6) | ||
| NYHA | 501 | <0.0001 | |||
| No HF/I | 265 (52.9) | 68 (32.5) | 197 (67.5) | ||
| II–IV | 236 (47.1) | 141 (67.5) | 95 (32.5) | ||
| Diastolic interventricular septum thickness (mm), median (Q1–Q3) | 270 | 17.0 (14.0–20.0) | 18.0 (16.0–21.0) | 16.0 (13.0–20.0) | 0.0006 |
| Diastolic LV posterior wall thickness (mm), median (Q1–Q3) | 248 | 15.0 (12.0–18.0) | 16.0 (13.0–18.0) | 13.0 (10.0–17.0) | 0.0001 |
| Left atrial diameter (mm), median (Q1–Q3) | 221 | 43.0 (39.0–48.0) | 46.0 (42.0–50.0) | 41.0 (36.0–46.0) | <0.0001 |
| LV ejection fraction (%), median (Q1–Q3) | 216 | 60.9 (48.6–69.8) | 55.5 (46.4–68.0) | 65.3 (57.4–70.8) | 0.0002 |
| LV ejection fraction <40%, n (%) | 216 | 20 (9.3) | 14 (12.4) | 6 (5.8) | 0.0964 |
| LV ejection fraction <50%, n (%) | 216 | 61 (28.2) | 43 (38.1) | 18 (17.5) | 0.0008 |
| LV end-diastolic diameter (mm), median (Q1–Q3) | 237 | 45.0 (42.0–49.0) | 45.0 (42.0–50.0) | 45.0 (41.0–48.0) | 0.5533 |
| E-wave deceleration time (ms), median (Q1–Q3) | 118 | 179.0 (144.0–221.0) | 175.5 (142.0–200.0) | 183.5 (144.0–226.0) | 0.3134 |
| Stroke volume (mL), median (Q1–Q3) | 71 | 60 (49–75) | 55 (48–69) | 62 (50–76) | 0.2637 |
| Restrictive filling pattern, n (%) | 79 | 0.0240 | |||
| <1 | 20 (25.3) | 5 (20.0) | 15 (27.8) | ||
| 1–2 | 37 (46.8) | 8 (32.0) | 29 (53.7) | ||
| >2 | 22 (27.8) | 12 (48.0) | 10 (18.5) | ||
| LV mass among men (g/m2), median (Q1–Q3) | 172 | 336.4 (267.0–412.5) | 350.7 (295.0–427.0) | 298.4 (212.0–389.9) | 0.0069 |
| Mitral thickening, n (%) | 140 | 44 (31.4) | 26 (32.9) | 18 (29.5) | 0.6671 |
| Tricuspid thickening, n (%) | 136 | 18 (13.2) | 11 (14.1) | 7 (12.1) | 0.7293 |
Percentages shown are the proportion of subjects with each measure out of the total number of subjects for which data on that measure was available. The Kruskal–Wallis test was performed to calculate P-values by comparing medians between groups for continuous variables. The Pearson χ2 test was performed to calculate P-values for variables with cell counts >5.
HF, heart failure; LV, left ventricular; NYHA, New York Heart Association (classification); Q1, lower quartile; Q3, upper quartile; SD, standard deviation.
Survival by genotype and phenotype category
Survival (time to death) and heart transplant-free survival (time to death or heart transplant) was assessed for all 1375 subjects with follow-up data. Subjects with cardiac mutations or ATTRwt genotype had a lower survival rate than subjects in the other genotype categories (χ2 log rank: P < 0.0001) (Figure 2 and Supplementary material online, Figure S2). Subjects with cardiac or cardiac + neurologic phenotype had a lower survival rate than subjects with neurologic phenotype (χ2 log rank: P < 0.0001) (Figure 3 and Supplementary material online, Figure S3).
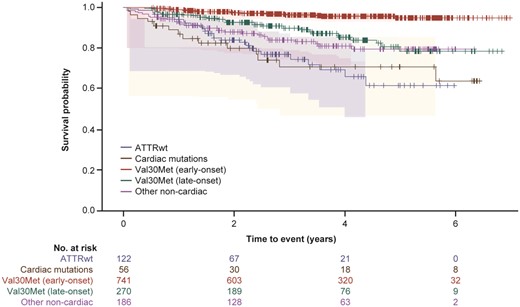
A Kaplan–Meier survival curve by genotype for subject death. The 95% Hall–Wellner bands and Cox proportional hazards model are adjusted by age and sex (χ2 log rank: P < 0.0001). Survival curves are from enrolment in THAOS.
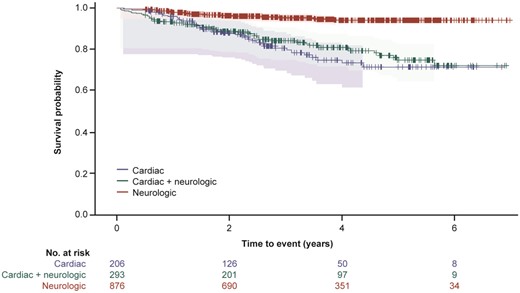
A Kaplan–Meier survival curve by phenotype for subject death. The 95% Hall–Wellner bands and Cox proportional hazards model are adjusted by age and sex (χ2 log rank: P < 0.0001). Survival curves are from enrolment in THAOS.
Discussion
This study provides, for the first time, a detailed map of the genotypic and phenotypic distribution of ATTR amyloidosis in Europe. The THAOS registry offers a unique opportunity to assess the phenotype, genotype, and prognosis spectrum, and represents a model for the study of rare disease. This analysis of THAOS registry subjects in Europe demonstrates that both genotype and phenotype are highly heterogeneous among patients with ATTR amyloidosis and that cardiac symptoms, or phenotype, are common in these patients; suggesting that European cardiologists might often be the first in line to diagnose patients with ATTR amyloidosis hidden in the large community of patients with cardiac symptoms/disease and, importantly, that the prognosis of ATTR amyloidosis is driven by the degree of cardiac involvement.
Heterogeneity of ATTR amyloidosis genotype in continental Western Europe
The THAOS registry has confirmed the heterogeneity of distribution of the mutations across continental Western European countries, with some mutations specific to certain countries. For instance, cardiac mutations Leu111Met, Ile68Leu, and Val122Ile were predominantly observed in Denmark, Italy, and France, respectively. Leu111Met has been traced to three unrelated Danish families.22 Val122Ile is observed in patients from West Africa, or of West African descent, with 3.4% of African Americans aged <65 years carrying at least one copy of the mutation.21 , 25 Thr60Ala was observed in only one subject in THAOS in continental Western Europe (in Sweden, with no known ancestry from Ireland or the UK, where it is the most common mutation23 , 26). The UK does not participate in THAOS, but in one observational study, Thr60Ala was the single most common mutation (17 of 37 patients with ATTRm), followed by Val30Met (five patients).9 Val30Met is endemic in Portugal (predominantly early-onset) and Sweden (predominantly late-onset), and also observed in Spain and France. This analysis of THAOS shows that distribution of TTR mutations across continental Western Europe varies significantly among different countries, or in some ethnic groups, due to the founder effect. Therefore, the main mutations come from endemic areas (e.g. early-onset Val30Met from Portugal and Val122Ile from West Africa) from which subjects have migrated across Europe over time. In contrast to cardiac mutations, ATTRwt was observed in all continental Western European countries. This suggests that ATTRwt is linked to the ageing process, rather than to other genetic factors, and that it can occur in any elderly European.27
Time of onset and sex of subjects with cardiac mutations in continental Western Europe
Patients with cardiac phenotype had a range of ages at disease onset. Val122Ile and Ile68Leu subjects had a late-onset cardiomyopathy (occurring after 55 years of age) and were more common in men. In contrast, Leu111Met subjects were significantly younger, and less likely to be male, in accordance with previous studies.22 , 28
This is important as, in most European countries, the diagnosis of ATTR-CM should be suspected in patients older than 55 years with hypertrophic cardiomyopathy phenotype. A recent prospective study including French patients with hypertrophic cardiomyopathy phenotype [median age (interquartile range): 62 (24) years] showed that 5% of patients, all aged >63 and some >80 years, had ATTR-CM, with Val122Ile the most common mutation (∼50% of patients).29 Similar studies have shown the high prevalence of ATTRwt in older European patients presenting with heart failure or hypertrophic cardiomyopathy.30 , 31 The THAOS registry, and these studies, highlight the need to perform TTR genetic studies in all patients with ATTR amyloidosis, whatever their age, to discriminate ATTRm and ATTRwt. Discovery of a TTR mutation, even in elderly patients, will have consequences for their families, so it is advised to perform a genetic test. It is difficult to otherwise rule out ATTR amyloidosis in patients younger than 55 years of age, particularly if they are from Denmark.
Cardiac phenotype of ATTR amyloidosis in continental Western Europe
One-third of the subjects included in the THAOS registry in Europe have cardiac symptoms with a cardiac phenotype either with or without neurologic signs or symptoms. The cardiac phenotype in THAOS in Europe is mainly due to either ATTRwt or cardiac mutations (Leu111Met, Ile68Leu, and Val122Ile) but may also arise from other mutations (e.g. His88Arg32 or Val20Ile33), with 17.4% of subjects in the ‘other mutations’ category having a cardiac phenotype.
The large majority of ATTRwt and cardiac mutations subjects in this analysis were male. This finding is consistent with previous studies showing ATTRwt is largely confined to elderly men,34 and that within ATTRm patients with cardiomyopathy there were fewer women and that those women tended to display considerably less severe morphological and functional echocardiographic impairment.35 , 36 This raises the possibility that some unexplained characteristic associated with the female sex protects against myocardial involvement in ATTR amyloidosis. Notably, ATTRwt may occur at an older age in women37 , 38 and, as a consequence, may be underdiagnosed in elderly women.
Subjects with a cardiac phenotype already showed heart failure symptoms and meaningful increase in LV wall thicknesses (showing the importance of cardiac infiltration of amyloid deposits) at the time of inclusion in THAOS, demonstrating that the diagnosis was made at a relatively late stage of disease. This emphasizes the need for earlier diagnosis, and for identifying early signs that can be shared with physicians (both general practitioners and cardiologists). As red flag, carpal tunnel syndrome is often the earliest presenting symptom and may precede cardiac symptoms by several years in subjects with ATTRwt and other cardiac mutations.27–29 The typical cardiac phenotype showed symmetric increase in LV and right ventricular wall thickness, especially in men aged ≥55 years with normal systolic blood pressure, valve thickening, and sparkling.39 It should be noted that, in this analysis, subjects with cardiac mutations were not exclusively associated with the cardiac phenotype, with 22.4% also having neurologic signs. This highlights that neuropathy needs to be diagnosed even in subjects with a cardiac genotype and is in accordance with a previous study in which ∼50% of patients diagnosed with a TTR cardiac mutation had a neuropathy.29 All these red flags should alert physicians to the possibility of ATTR amyloidosis, where the absence of restrictive filling pattern and low voltage should not rule out the suspicion.
Prognosis of ATTR amyloidosis in continental Western Europe
In this analysis, there was a significantly poorer prognosis for subjects with cardiac mutations or ATTRwt. This observation is consistent with the differences in clinical measures and medical history between the genotype and phenotype categories and previous surveys of these patients. For example, subjects with ATTRwt and cardiac mutations had notably higher median levels of BNP, cardiac troponin T, and NTproBNP. A prior survey of cardiac biomarkers in subjects enrolled in THAOS identified higher plasma levels of BNP/NTproBNP as an independent predictor of survival.40 Together, these data should guide cardiologists in Europe, where the presence of symmetric LV hypertrophy and mildly depressed LVEF, especially in elderly men, should prompt the suspicion of ATTR amyloidosis if LV hypertrophy is unexplained.
There appeared to be some differences in treatment patterns between countries. For example, larger proportions of subjects on tafamidis (post-enrolment) were observed in Portugal (28.6%) and France (26.6%), which were predominately early-onset Val30Met; whereas, larger proportions of liver transplants were reported in Spain (43.4%). Notably, only 18.6 and 31.3% of all patients received a liver transplant or had ever received the disease modifying treatment tafamidis, respectively.
Limitations
While this analysis demonstrated lower survival rates in subjects with cardiac disease, it was not designed to assess the relative contribution of specific factors other than phenotype and genotype group (controlled by age and sex). Other variables may also impact survival but are less likely to be as relevant for all the groups in this analysis. For example, cardiac measures may be relevant in patients with cardiac disease but not for patients with neurologic disease, while liver transplant status has been shown to have prognostic value for patients with the Val30Met mutation but less so for other mutations.41 , 42 As THAOS is a large, international registry, there are inevitable variations in the clinical investigations and how complete the data, including data follow-up, are for each subject. While there are specific guidelines for the collection and reporting of data,20 the registry relies on assessments conducted in participating centres and there are no core data collection laboratories, so there may be variations in data availability and integrity. There are probably also non-random variations in missing data as, for example, cardiac symptoms in subjects with the neurologic phenotype may not be observed, or assessed, by the neurologist (and vice versa). Assignment of subjects to phenotype may also be imprecise as characterization of the cardiac phenotype was based on ECG and clinical data, which may not have been systematically obtained for subjects being treated by a neurologist. In this regard, selection of subjects included in the THAOS registry itself may be biased, as when it was established the majority of investigators were neurologists. While investigators of other specialties have since joined the registry, there remains an uneven distribution of specialties in some counties (Supplementary material online, Table S1) which may have influenced the distribution of subjects; most clearly in Denmark and Portugal, which had a strong correlation between the type of specialist and the phenotype of subjects. However, this was not evident in other countries and the large number of ‘other’ specialists, and subjects with a cardiac + neurologic phenotype, demonstrate that, overall, this correlation was not as strong as may have been expected. THAOS is a real-world registry so the proportion of neurologic, cardiologic, and ‘other specialty’ investigators will reflect the real distribution of where patients suspected to have ATTR amyloidosis are referred. With increased awareness among European cardiologists, it is likely that more ATTR-CM will be diagnosed.
Conclusion
ATTR amyloidosis genotypes and phenotypes as observed in THAOS are highly heterogeneous in Europe. A geographic map of the different disease profiles and awareness that a subset of subjects have a dominant cardiac phenotype at presentation, mimicking hypertrophic cardiomyopathy, can facilitate the clinical recognition of this underdiagnosed disease.
Acknowledgements
The authors thank all THAOS patients and investigators for their important contributions to this study. Medical writing support was provided by Joshua Fink, PhD, of Engage Scientific Solutions, and funded by Pfizer.
Funding
This study was sponsored by Pfizer.
Conflicts of interest: T.D. is a THAOS investigator and member of the THAOS Scientific Board; and has served as a medical advisor for Pfizer and received honoraria. His institution has received grant support from Pfizer; has served on the scientific advisory board of, and received funding from, Pfizer, Alnylam, Akcea, Prothena and GSK for scientific meeting expenses (travel, accommodation, and registration). A.V.K. is a THAOS investigator and member of the THAOS Scientific Board; and has served as a medical advisor for Pfizer and received honoraria for presentations. O.B.S. is a THAOS investigator and member of the THAOS Scientific Board; has received honoraria for presentation and funding from Pfizer for scientific meeting expenses (travel, accommodation, and registration); has served as member of advisory board for Alnylam and Prothena Pharmaceutical companies; and as a clinical investigator for Alnylam Pharmaceuticals. M.S.M. is a THAOS investigator and member of the THAOS Scientific Board; has received support from FoldRx Pharmaceuticals as a clinical investigator and for scientific meeting expenses; his institution has received grant support from Pfizer; has served on the scientific advisory board of and received funding from Pfizer for scientific meeting expenses (travel, accommodation, and registration). V.P.-B. is a THAOS investigator and member of the THAOS Scientific Board and has served as a medical advisor for Pfizer, Alnylam Pharmaceuticals, Eidos Therapeutics, and Ionis Inc. C.-R.Y. and M.-L.O. are employees of Pfizer and hold stock options with Pfizer. T.C. is a THAOS investigator and member of the THAOS Scientific Board; and has served as a medical advisor for Pfizer and received honoraria for presentations; and received funding from Pfizer for scientific meeting expenses (travel, accommodation, and registration). C.R. is a THAOS investigator and member of the THAOS Scientific Board; and has served as a medical advisor for Pfizer and received honoraria. His institution has received grant support from Pfizer; has served on the scientific advisory board of, and received funding from, Pfizer for scientific meeting expenses (travel, accommodation, and registration).
References
Author notes
A full list of THAOS Investigators in Europe is provided in the Supplementary material online, Appendix.

