


Abstract
Trends in characteristics, management, and survival in out-of-hospital cardiac arrest (OHCA) and in-hospital cardiac arrest (IHCA) were studied in the Swedish Cardiopulmonary Resuscitation Registry (SCRR).
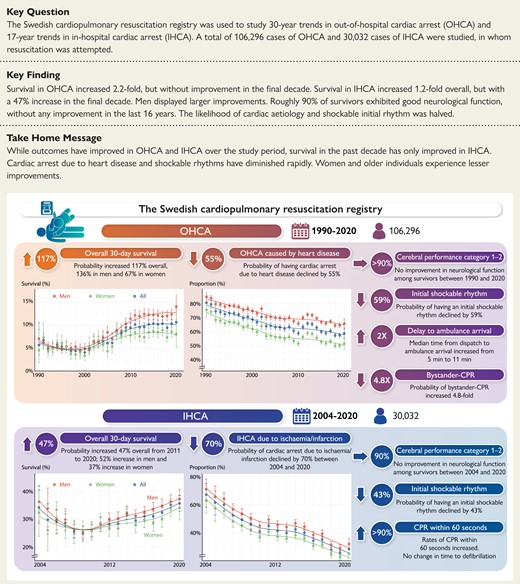
The SCRR was used to study 106 296 cases of OHCA (1990–2020) and 30 032 cases of IHCA (2004–20) in whom resuscitation was attempted. In OHCA, survival increased from 5.7% in 1990 to 10.1% in 2011 and remained unchanged thereafter. Odds ratios [ORs, 95% confidence interval (CI)] for survival in 2017–20 vs. 1990–93 were 2.17 (1.93–2.43) overall, 2.36 (2.07–2.71) for men, and 1.67 (1.34–2.10) for women. Survival increased for all aetiologies, except trauma, suffocation, and drowning. OR for cardiac aetiology in 2017–20 vs. 1990–93 was 0.45 (0.42–0.48). Bystander cardiopulmonary resuscitation increased from 30.9% to 82.2%. Shockable rhythm decreased from 39.5% in 1990 to 17.4% in 2020. Use of targeted temperature management decreased from 42.1% (2010) to 18.2% (2020). In IHCA, OR for survival in 2017–20 vs. 2004–07 was 1.18 (1.06–1.31), showing a non-linear trend with probability of survival increasing by 46.6% during 2011–20. Myocardial ischaemia or infarction as aetiology decreased during 2004–20 from 67.4% to 28.3% [OR 0.30 (0.27–0.34)]. Shockable rhythm decreased from 37.4% to 23.0% [OR 0.57 (0.51–0.64)]. Approximately 90% of survivors (IHCA and OHCA) had no or mild neurological sequelae.
Survival increased 2.2-fold in OHCA during 1990–2020 but without any improvement in the final decade, and 1.2-fold in IHCA during 2004–20, with rapid improvement the last decade. Cardiac aetiology and shockable rhythms were halved. Neurological outcome has not improved.
The Swedish Cardiopulmonary Resuscitation Registry was used to study 30-year trends in out-of-hospital cardiac arrest (OHCA) and 17-year trends in in-hospital cardiac arrest (IHCA). A total of 106 296 cases of OHCA (1990–2020) and 30 032 cases of IHCA (2004–20), in whom resuscitation was attempted, were studied. Trends in 30-day survival, cerebral performance category among survivors, causes of cardiac arrest, initial rhythm, critical time intervals, and bystander cardiopulmonary resuscitation (CPR) were studied.
See the editorial comment for this article ‘The flatlining of cardiac arrest survival: can we revive the upward trend?’, by Elizabeth D. Paratz and André La Gerche, https://doi.org/10.1093/eurheartj/ehac522.
Introduction
In-hospital cardiac arrest (IHCA) and out-of-hospital cardiac arrest (OHCA) are global health problems. Fatal OHCA annually affects 380 000 individuals in the USA and 270 000 individuals in Europe.1,2 The median incidence rate of IHCA is 2–4 cardiac arrests per 1000 hospital admissions in the UK and the USA, resulting in 200 000 cases of IHCA annually in the USA.2–9 Clinical guidelines on the management of cardiac arrest are very similar across continents.10–12
While some studies have reported improvements in survival, findings have been conflicting.5,13–17 To which extent survival increases will depend on many factors such as the availability, response time, and skills of the emergency medical services (EMS), the presence of bystanders trained to perform cardiopulmonary resuscitation (CPR), or, for IHCA, skills and resources to handle cardiac arrests. Given the rapidly falling coronary heart disease rates, the proportion of OHCAs and IHCAs with potentially shockable arrhythmias is decreasing.18–20 While OHCA and IHCA have often been categorized as two separate groups, recent data show that these two entities display considerable overlap with regard to patient characteristics.21
Studies on survival trends after OHCA and IHCA5,13–17 have not covered longer periods of time, or been able to study both IHCA and OHCA. The Swedish Cardiopulmonary Resuscitation Registry (SCRR) has included OHCA in Sweden since 1990, making it the longest standing registry in the world for studying cardiac arrest. Since 2004, the registry has also included IHCA. The purpose of this study was to analyze 30-year trends in survival, management and patient characteristics.
Methods
The Swedish cardiopulmonary resuscitation registry
The SCRR has been described previously.4,18,19,22 The registry was launched in 1990 and has since monitored OHCA on a nationwide scale. Since 2008, all Swedish ambulance organizations have participated in the registry. Since 2004, the registry also includes cases of IHCA across the nation. Considering IHCA, the level of ascertainment has been high throughout, and from year 2019 all 74 qualifying hospitals in Sweden report their IHCA cases to the registry. Hospitals qualify if they have a cardiac arrest response team and intensive care unit (ICU) capable of providing post-resuscitation care. The SCRR has been designed to comply with the Utstein style of reporting OHCA and IHCA.23
We included all cases of OHCA aged 0 years and older, where resuscitation was attempted, during the time period 1 January 1990 to 22 August 2020, and all reported cases of IHCA aged 17 years and older, during the period 1 January 2004 to 22 August 2020. IHCA cases younger than 17 years of age were not reported to the registry before year 2018.
Definitions and variables
A patient is defined as having an OHCA if the arrest occurs outside of the hospital walls. OHCA cases are reported initially by ambulance personnel and later reviewed by a local coordinator. A hospitalized patient is defined as having an IHCA if found unresponsive with apnoea or abnormal breathing, requiring initiation of CPR and/or defibrillation. Additional details are provided in the Supplementary material online, Appendix.
The initial (first recorded) rhythm is defined as either shockable (ventricular fibrillation, pulseless ventricular tachycardia) or non-shockable (pulseless electrical activity or asystole). Data are obtained from recorded electrocardiograms (ECG) and, secondarily, from the evaluation provided by the analyses of external defibrillators.
In OHCA, time delays from collapse to emergency call, CPR, defibrillation, ambulance dispatch, and ambulance arrival are recorded. In IHCA, time delays to alerting the rescue team, initiating CPR, and defibrillation are recorded.
Regarding IHCA, acute myocardial infarction is defined as myocardial infarction occurring within 72 h (using the infarction criteria applicable during the time period), and ischaemia is defined as any myocardial ischaemia (not resulting in infarction).
Since its launch, the registry has employed multiple data quality controls, ranging from automatic controls during data entry (range and logical checks) to manual controls several times annually to identify erroneous or illogical data entries.
Outcome measures
The primary outcome measure was survival at 30 days. Secondary outcomes were neurological function measured using cerebral performance category (CPC) score, critical time delays, rates of bystander CPR, and use of interventions. The CPC score was assessed among survivors at discharge and ranged from 1 to 5 (1, no sequelae; 2, mild sequelae; 3, severe sequelae; 4, vegetative state). CPC scores of 1–2 were defined as good neurological outcome.
Statistical analyses
Baseline characteristics are described using means, standard deviations, medians, and interquartile ranges. We used logistic regression, adjusted for age and sex, to calculate probabilities and odds ratios (ORs) for 30-day survival, presenting with shockable rhythm, having cardiac aetiology (i.e. presumed cardiac aetiology in OHCA and acute myocardial infarction or ischaemia in IHCA). To calculate the ORs, for OHCA and IHCA, we compared the first four calendar years (reference period) with the final four calendar years. Due to the fact that some variables [e.g. return of spontaneous circulation (ROSC)] were introduced later in the registry, and the initial years for IHCA included relatively few cases, some trend comparisons are made using other time periods. We did not adjust critical time intervals and rates of bystander CPR, in order to provide the actual figures. We evaluated the trends by assessing the adjusted probabilities and rates, as well as computing trend tests using calendar year as a linear predictor. A total of 60 hypotheses tests were performed, resulting in an alpha level of 0.0008 (i.e. 0.05/60 = 0.0008).
We calculated trends in the relative importance of known key predictors of survival (OHCA and IHCA) using gradient boosting. Gradient boosting entails an algorithm for calculating the individual importance of each predictor in the model. Importance is computed by permuting each variable and assessing the change in model accuracy.24,25 Each model consisted of 750 trees and were built with shrinkage set to 0.01 and interaction depth 3.
Missing rates for key variables were low (vital status <0.5%, age 4.3%, cause of OHCA 6.8%, shockable rhythm 7.6%, bystander CPR 9.3%; see Supplementary material online, Tables S1 and S2). We used complete case analyses. Analyses were performed in R version 4.0.3. Ethical approval was obtained by the Swedish Ethical Review Authority (2019-01094). The funders had no role in the study.
Results
A total of 106 296 cases of OHCA and 30 032 cases of IHCA were reported during the study period. Mean age was 68.0 years in OHCA and 71.8 years in IHCA. There were 32% women in OHCA and 38% in IHCA. Baseline characteristics are provided in Tables 1 and 2.
Characteristics of 106 296 cases of out-of-hospital cardiac arrest during 1990–2020
| All | 1990–93 | 1994–97 | 1998–2000 | 2001–04 | 2005–08 | 2009–12 | 2013–16 | 2017–20 | |
|---|---|---|---|---|---|---|---|---|---|
| N | 106 296 | 7229 | 12 549 | 7847 | 9564 | 10 923 | 17 979 | 21 592 | 18 613 |
| Age, years—mean (SD) | 68.0 (17.4) | 67.2 (16.3) | 67.8 (16.1) | 68.2 (16.1) | 67.8 (17.0) | 67.2 (17.7) | 67.8 (17.8) | 68.1 (18.0) | 68.7 (18.2) |
| Female sex—n (%) | 33 392 (32.0) | 1947 (28.2) | 3473 (28.8) | 2275 (30.3) | 2839 (31.1) | 3350 (31.3) | 5821 (32.4) | 7212 (33.4) | 6475 (35.0) |
| Location of cardiac arrest—n (%) | |||||||||
| Home | 70 194 (71.3) | 4429 (72.3) | 7758 (72.9) | 4899 (72.6) | 5956 (73.6) | 6959 (75.8) | 12 089 (68.3) | 14 888 (69.1) | 13 216 (71.8) |
| Public place | 16 274 (16.5) | 1073 (17.5) | 1723 (16.2) | 1054 (15.6) | 1154 (14.3) | 1091 (11.9) | 3156 (17.8) | 3903 (18.1) | 3120 (17.0) |
| Other place | 11 962 (12.2) | 627 (10.2) | 1157 (10.9) | 793 (11.8) | 978 (12.1) | 1127 (12.3) | 2442 (13.8) | 2769 (12.8) | 2069 (11.2) |
| Cause of cardiac arrest—n (%) | |||||||||
| Heart disease | 64 505 (65.1) | 4908 (74.6) | 8333 (72.3) | 5120 (70.1) | 5925 (66.2) | 6522 (62.7) | 10 413 (62.8) | 13 135 (62.8) | 10 149 (60.3) |
| Overdose | 2338 (2.4) | 115 (1.7) | 193 (1.7) | 128 (1.8) | 165 (1.8) | 165 (1.6) | 371 (2.2) | 683 (3.3) | 518 (3.1) |
| Trauma | 2286 (2.3) | 135 (2.1) | 214 (1.9) | 148 (2.0) | 189 (2.1) | 187 (1.8) | 428 (2.6) | 513 (2.5) | 472 (2.8) |
| Pulmonary disease | 4562 (4.6) | 198 (3.0) | 384 (3.3) | 250 (3.4) | 409 (4.6) | 420 (4.0) | 734 (4.4) | 1113 (5.3) | 1054 (6.3) |
| Suffocation | 2079 (2.1) | 64 (1.0) | 161 (1.4) | 93 (1.3) | 127 (1.4) | 226 (2.2) | 382 (2.3) | 564 (2.7) | 462 (2.7) |
| Suicide | 1774 (1.8) | 75 (1.1) | 110 (1.0) | 88 (1.2) | 77 (0.9) | 168 (1.6) | 350 (2.1) | 431 (2.1) | 475 (2.8) |
| Drowning | 972 (1.0) | 53 (0.8) | 102 (0.9) | 48 (0.7) | 74 (0.8) | 104 (1.0) | 144 (0.9) | 271 (1.3) | 176 (1.0) |
| SIDS | 420 (0.4) | 69 (1.0) | 62 (0.5) | 27 (0.4) | 37 (0.4) | 35 (0.3) | 74 (0.4) | 65 (0.3) | 51 (0.3) |
| Other | 20 160 (20.3) | 966 (14.7) | 1972 (17.1) | 1407 (19.3) | 1951 (21.8) | 2577 (24.8) | 3679 (22.2) | 4125 (19.7) | 3483 (20.7) |
| Initial rhythm—n (%)* | |||||||||
| Asystole | 51 744 (57.6) | 2839 (53.1) | 5267 (52.1) | 3649 (56.7) | 4395 (56.5) | 5163 (57.7) | 9146 (58.0) | 11 661 (60.3) | 9624 (60.0) |
| Pulseless electrical activity | 12 543 (14.0) | 369 (6.9) | 868 (8.6) | 619 (9.6) | 938 (12.1) | 1172 (13.1) | 2278 (14.4) | 3264 (16.9) | 3035 (18.9) |
| Ventricular fibrillation/pulseless ventricular tachycardia | 25 505 (28.4) | 2141 (40.0) | 3970 (39.3) | 2164 (33.6) | 2448 (31.5) | 2610 (29.2) | 4353 (27.6) | 4428 (22.9) | 3391 (21.1) |
| Shockable rhythm—n (%)a | 25 505 (26.0) | 2141 (36.5) | 3970 (35.4) | 2164 (30.6) | 2448 (28.7) | 2610 (26.8) | 4353 (25.7) | 4428 (21.3) | 3391 (18.8) |
| Critical time delays, min—median (IQR) | |||||||||
| Time to emergency call | 2.0 (1.0–6.0) | 3.0 (1.0–6.0) | 2.0 (1.0–6.0) | 2.0 (1.0–6.0) | 2.0 (1.0–5.0) | ||||
| Time to CPR | 7.0 (1.0–14.0) | 12.0 (7.0–19.0) | 12.0 (7.0–19.0) | 12.0 (7.0–20.0) | 11.0 (6.0–19.0) | 9.0 (2.0–16.0) | 4.0 (0.0–11.0) | 3.0 (0.0–10.0) | 2.0 (0.0–10.0) |
| Time to defibrillation | 15.0 (10.0––23.0) | 15.0 (10.0–21.0) | 15.0 (10.0–22.0) | 16.0 (11.0–25.0) | 15.0 (10.0–24.0) | 16.0 (10.0–25.0) | 15.0 (9.0–24.0) | 15.0 (8.0–25.0) | 14.0 (8.0–23.0) |
| Time to ambulance dispatch | 1.0 (0.0–2.0) | 1.0 (0.0–2.0) | 1.0 (0.0–1.0) | 1.0 (0.0–2.0) | 1.0 (0.0–2.0) | ||||
| Time to ambulance arrival | 9.0 (5.0–14.0) | 6.0 (4.0–10.0) | 6.0 (4.0–10.0) | 7.0 (4.0–11.0) | 7.0 (4.0–11.0) | 8.0 (5.0–13.0) | 9.0 (6.0–15.0) | 10.0 (7.0–15.0) | 11.0 (7.0–19.0) |
| Bystander circumstances—n (%) | |||||||||
| Witnessed cardiac arrest | 67 194 (66.7) | 4216 (65.2) | 7891 (68.4) | 5013 (69.0) | 6182 (69.8) | 7191 (70.1) | 11 806 (68.4) | 13 791 (64.8) | 11 104 (62.3) |
| Witnessed by professional | 3530 (6.3) | 1463 (12.1) | 2067 (19.1) | ||||||
| Bystander CPR performedb | 51 149 (53.1) | 1945 (31.3) | 3777 (35.5) | 2524 (38.2) | 3292 (41.5) | 4939 (52.9) | 10 066 (57.6) | 12 990 (62.1) | 11 616 (67.3) |
| Telephone CPR provided | 9452 (60.6) | 2928 (51.9) | 6520 (65.6) | ||||||
| Type of bystander CPR—n (%)b | |||||||||
| CPR by laymen | 37 350 (41.2) | 1336 (21.2) | 2610 (24.5) | 1850 (27.9) | 2146 (28.5) | 2864 (35.6) | 8095 (47.7) | 10 069 (51.6) | 8380 (55.7) |
| CPR by professional | 8126 (9.0) | 693 (11.0) | 1183 (11.1) | 691 (10.4) | 747 (9.9) | 786 (9.8) | 1480 (8.7) | 1518 (7.8) | 1028 (6.8) |
| No bystander-CPR | 45 223 (49.9) | 4270 (67.8) | 6872 (64.4) | 4082 (61.6) | 4633 (61.6) | 4401 (54.7) | 7399 (43.6) | 7921 (40.6) | 5645 (37.5) |
| Public AED connected—n (%) | 1832 (6.8) | 675 (6.5) | 1151 (7.0) | ||||||
| Defibrillated before ambulance arrival—n (%) | 3024 (5.9) | 682 (4.6) | 1245 (6.5) | 1065 (6.5) | |||||
| Ambulance assessment and management—n (%) | |||||||||
| Consciousness on ambulance arrival | 6307 (6.4) | 65 (1.0) | 13 (0.1) | 8 (0.1) | 114 (1.4) | 299 (3.2) | 1760 (10.0) | 2497 (12.0) | 1551 (8.6) |
| Pulse on ambulance arrival | 8545 (8.8) | 128 (2.0) | 125 (1.1) | 73 (1.1) | 194 (2.4) | 475 (5.1) | 2405 (13.8) | 2973 (14.3) | 2172 (13.0) |
| Defibrillated, any | 19 161 (34.2) | 617 (42.1) | 6115 (37.8) | 7048 (35.1) | 5381 (29.3) | ||||
| Adrenaline given | 45 265 (78.7) | 1123 (77.3) | 12 646 (77.5) | 17 103 (80.2) | 14 393 (78.1) | ||||
| Amiodarone given | 6724 (11.8) | 208 (14.9) | 1950 (12.2) | 2444 (11.5) | 2122 (11.6) | ||||
| Intubated | 42 518 (40.3) | 3140 (43.4) | 6584 (52.5) | 4234 (54.0) | 5480 (57.3) | 5659 (52.0) | 7344 (41.4) | 6282 (29.5) | 3795 (20.6) |
| Use of mechanical CPR | 21 705 (39.0) | 486 (34.3) | 4208 (25.9) | 8130 (41.4) | 8881 (48.5) | ||||
| Transported to hospital | 34 580 (60.2) | 1050 (71.6) | 10 351 (62.7) | 12 897 (60.4) | 10 282 (56.6) | ||||
| ROSC, at hospital arrivalc | 23 557 (43.1) | 1030 (28.5) | 2005 (36.1) | 1282 (41.7) | 1909 (46.2) | 2513 (47.1) | 4352 (40.7) | 5733 (45.3) | 4733 (49.1) |
| ROSC, anyc | 19 072 (34.3) | 507 (34.6) | 5128 (31.2) | 7124 (34.6) | 6313 (36.9) | ||||
| In-hospital interventions—n (%) | |||||||||
| Percutaneous coronary intervention | 3349 (29.4) | 76 (25.4) | 906 (28.7) | 1388 (30.6) | 979 (28.9) | ||||
| Coronary artery bypass grafting | 191 (1.7) | 5 (1.7) | 65 (2.1) | 79 (1.7) | 42 (1.2) | ||||
| Implantation of implantable cardioverter defibrillator | 1198 (10.7) | 19 (6.5) | 341 (11.0) | 492 (11.0) | 346 (10.4) | ||||
| Temperature management (hypothermia) | 3537 (32.1) | 111 (36.5) | 1239 (39.5) | 1331 (30.4) | 856 (26.8) | ||||
AED, automatic external defibrillator; CPR, cardiopulmonary resuscitation; IQR, interquartile range; ROSC, return of spontaneous circulation; SIDS, sudden infant death syndrome.
The variable Shockable rhythm takes AED data and ECG recording into account, whereas the variable Initial rhythm only takes the initial ECG recording into account, and therefore may differ slightly.
The variables Bystander CPR and Type of bystander CPR are derived from different variables and therefore may differ slightly. Empty cells indicate absence of data.
Overall missingness was 47.7% for ROSC at any time, and 48.5% for ROSC at hospital arrival.
Characteristics of 30 032 cases of in-hospital cardiac arrest
| All | 2004–07 | 2008–11 | 2012–16 | 2017–20 | |
|---|---|---|---|---|---|
| N | 30 032 | 2173 | 6768 | 12 264 | 8827 |
| Age, years—mean (SD) | 71.8 (14.7) | 71.7 (14.2) | 72.5 (14.2) | 72.1 (14.3) | 70.9 (15.7) |
| Female sex—n (%) | 11 522 (38.4) | 833 (38.3) | 2670 (39.5) | 4653 (37.9) | 3366 (38.2) |
| Location of cardiac arrest—n (%) | |||||
| Emergency room | 3174 (10.6) | 175 (8.1) | 625 (9.2) | 1260 (10.3) | 1114 (12.6) |
| Catheterization lab | 2297 (7.6) | 165 (7.6) | 416 (6.1) | 898 (7.3) | 818 (9.3) |
| Coronary care unit | 4886 (16.3) | 419 (19.3) | 1221 (18.0) | 2009 (16.4) | 1237 (14.0) |
| Intermediary ward | 199 (0.7) | 197 (2.2) | |||
| Intensive care unit | 2772 (9.2) | 216 (9.9) | 622 (9.2) | 1102 (9.0) | 832 (9.4) |
| Paraclinical department | 1194 (4.0) | 70 (3.2) | 243 (3.6) | 500 (4.1) | 381 (4.3) |
| Operation room | 576 (1.9) | 31 (1.4) | 105 (1.6) | 251 (2.0) | 189 (2.1) |
| Regular ward | 14 235 (47.4) | 1024 (47.1) | 3363 (49.7) | 5981 (48.8) | 3867 (43.8) |
| Other ward | 699 (2.3) | 73 (3.4) | 173 (2.6) | 261 (2.1) | 192 (2.2) |
| Cause of cardiac arrest—n (%) | |||||
| Myocardial ischaemia/infarction | 7410 (39.8) | 738 (58.6) | 1861 (46.4) | 2975 (40.9) | 1836 (30.1) |
| Cardiovascular, other | 193 (1.0) | 193 (3.2) | |||
| Cardiomyopathy | 57 (0.3) | 57 (0.9) | |||
| Primary arrhythmia | 390 (2.1) | 389 (6.4) | |||
| Cerebrovascular insult | 63 (0.3) | 63 (1.0) | |||
| Respiratory insufficiency | 2890 (15.5) | 168 (13.3) | 603 (15.0) | 1195 (16.4) | 924 (15.2) |
| Aspiration | 76 (0.4) | 76 (1.2) | |||
| Thromboembolism | 175 (0.9) | 175 (2.9) | |||
| Hemorrhage | 179 (1.0) | 179 (2.9) | |||
| Infection | 342 (1.8) | 341 (5.6) | |||
| Cancer | 70 (0.4) | 70 (1.1) | |||
| Other | 6793 (36.4) | 353 (28.0) | 1549 (38.6) | 3103 (42.7) | 1788 (29.4) |
| Rescue team alerted within 60 s—n (%) | 19 502 (80.1) | 1357 (79.5) | 4410 (79.3) | 8041 (80.2) | 5694 (80.7) |
| CPR provided within 60 s—n (%) | 23 608 (89.5) | 1505 (86.1) | 5193 (87.6) | 9703 (89.9) | 7207 (91.1) |
| Coexisting and coinciding conditions—n (%) | |||||
| Ongoing acute myocardial infarction | 7195 (27.2) | 710 (37.8) | 1836 (30.6) | 2883 (25.6) | 1766 (24.2) |
| History of acute myocardial infarction | 6776 (24.6) | 599 (30.7) | 1642 (26.2) | 2844 (24.3) | 1691 (22.0) |
| Ongoing stroke | 877 (3.2) | 73 (3.8) | 200 (3.2) | 390 (3.3) | 214 (2.8) |
| History of stroke | 3331 (11.8) | 251 (12.7) | 818 (12.8) | 1449 (12.1) | 813 (10.3) |
| History of diabetes | 7576 (26.7) | 483 (24.2) | 1689 (26.2) | 3233 (26.9) | 2171 (27.5) |
| History of heart failure | 9463 (35.2) | 712 (37.8) | 2368 (38.6) | 3976 (34.8) | 2407 (32.2) |
| History of cancer, any | 5320 (19.1) | 315 (16.3) | 1137 (17.9) | 2277 (19.2) | 1591 (20.6) |
| Witnessed cardiac arrest—n (%) | 23 983 (81.1) | 1758 (82.3) | 5385 (80.6) | 9691 (80.7) | 7149 (81.8) |
| ECG monitoring—n (%) | 15 790 (53.3) | 1189 (55.9) | 3323 (49.6) | 6364 (52.6) | 4914 (56.7) |
| CPR provided before rescue team arrival—n (%) | 24 776 (91.9) | 1780 (88.2) | 5687 (90.7) | 10 312 (92.8) | 6997 (92.5) |
| Defibrillated before rescue team arrival—n (%) | 4515 (17.9) | 404 (23.5) | 1097 (18.7) | 1824 (17.6) | 1190 (16.4) |
| Shockable initial rhythm—n (%) | 7386 (26.8) | 682 (36.1) | 1736 (28.4) | 2940 (25.9) | 2028 (24.8) |
| Defibrillated, any—n (%) | 9742 (33.2) | 867 (42.6) | 2313 (34.5) | 3895 (32.4) | 2667 (31.1) |
| Intubated—n (%) | 14 413 (50.1) | 934 (49.8) | 3327 (50.2) | 5881 (49.6) | 4271 (50.9) |
| Adrenaline given—n (%) | 19 040 (65.7) | 1264 (66.1) | 4401 (66.2) | 7833 (65.5) | 5542 (65.6) |
| Amiodarone given—n (%) | 4355 (15.7) | 353 (20.1) | 1036 (16.3) | 1734 (15.2) | 1232 (15.1) |
| Use of mechanical CPR—n (%) | 2964 (10.5) | 170 (9.3) | 737 (11.4) | 1122 (9.7) | 935 (11.3) |
| Interventions—n (%) | |||||
| Coronary angiography | 1060 (21.0) | 55 (20.4) | 1005 (21.0) | ||
| Percutaneous coronary intervention | 884 (17.5) | 47 (17.5) | 837 (17.5) | ||
CPR, cardiopulmonary resuscitation; ECG, electrocardiogram.
Trends in characteristics and outcomes in out-of hospital cardiac arrest
Survival and neurological outcome
During the period 1990–2000, survival rates were around 5% for men and women (Figure 1A). Survival increased continuously from year 2000 to 2011. Survival rates were unchanged during the period 2011–20 (P-value for trend 0.590), but a marked difference had evolved between men and women. In the final 4 years, survival in women was around 8%, whereas survival in men was around 12%. OR for 30-day survival during 2017–20, compared with 1990–93, were 2.17 (95% CI 1.93–2.43) overall, 2.36 (95% CI 2.07–2.71) for men and 1.67 (95% CI 1.34–2.10) for women. ROSC at any time point increased from 31.2% in 2009–12 to 36.9% in 2017–20 (Table 1). Annual changes in the probability of survival, including in the subgroups presented below, are provided in Supplementary material online, Table S3.
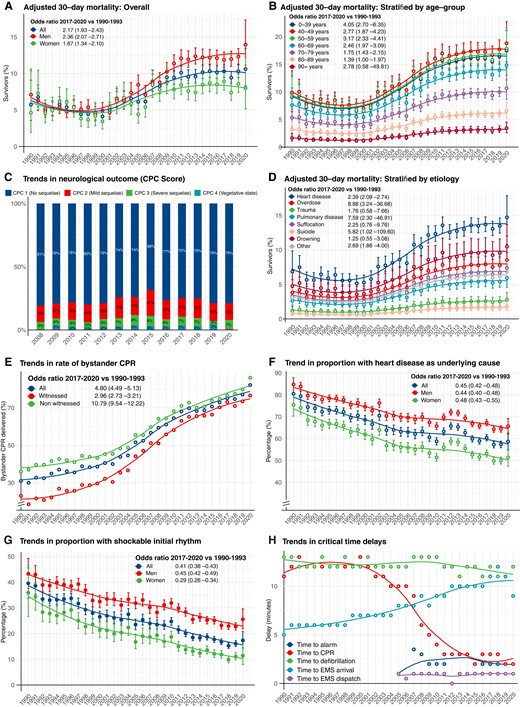
Survival and characteristics in out-of-hospital cardiac arrest during 1990–2020. (A–H) Shows trends in characteristics, management and survival in out-of-hospital cardiac arrest in Sweden during 1990–2020. All results are adjusted, using logistic regression, for age and sex, except from critical time intervals and rates of bystander cardiopulmonary resuscitation (provided as crude numbers). Smooth lines depict a polynomial regression line to visualize the trend. Note some y axes in some panels are truncated. Odds ratios and P-values for calendar year modelled as a linear predictor are provided in Supplementary material online, Table S3. OR = odds ratio.
Younger patients experienced a greater increase in survival (Figure 1B). Survival in patients aged 0–39 years increased from 9.1% in 1990 to 17.5% in 2020 (OR for survival in 2017–20 vs. 1990–93 was 4.05 [95% CI 2.70–6.35]). The highest rate of survival was noted for cases aged 40–49 years, in whom survival increased from 9.8% in 1990 to 18.9% in 2020 [OR for survival in 2017–20 vs. 1990–93 was 2.77 (95% CI 1.87–4.23)]. Among patients aged 50–59 years, survival increased from 9.3% in 1990 to 17.9% in 2020 [corresponding OR 3.17 (95% CI 2.33–4.41)]. Patients aged 80–89 years displayed an OR of 1.39 (95% CI 1.00–1.97), with an increase in survival from 3.2% in 1990 to 6.6% in 2020. Patients aged 90 years or older had a numerically higher survival (1.6% in 1990 vs. 3.4% in 2020), albeit with a non-significant increase as judged by the OR (P = 0.299; Figure 1B).
In the subgroup of patients presenting with shockable rhythm, survival increased from 14.4% in 1990 to 35.8% in 2020 overall, 15.4% in 1990 to 38.2% in 2020 for men, 13.4% in 1990 to 33.5% in 2020 for women. OR for 30-day survival in 2017–20 vs. 1990–93 was 3.26 (95% CI 2.81–3.79) overall, 3.46 (95% CI 2.92–4.11) for men, and 2.65 (95% CI 1.95–3.63) for women (see Supplementary material online, Figure S1). These relative improvements were similar to those with non-shockable rhythms (see Supplementary material online, Figure S2).
Among patients who were discharged alive after OHCA, the percentage with CPC score 1 decreased from 81.2% in 2008 to 68.3% in 2015 and then increased to 79.5% in 2020 (P = 0.10885 for 2017–20 vs. 2008–11; Figure 1C).
Survival increased from 6.9% in 1990 to 14.7% in 2020 for patients with cardiac aetiology [OR 2.39 (95% CI 2.09–2.74) for 2017–20 vs. 1990–93]. Survival also increased for cardiac arrest due to drug overdose, pulmonary disease, and other causes. Survival increased numerically for arrests caused by trauma, suffocation, suicide, and drowning, although without statistical significance (Figure 1D and see Supplementary material online, Table S3).
Place of cardiac arrest
Roughly three in four cardiac arrests occurred in the victim’s home, with minor fluctuations since 1990 (see Supplementary material online, Figure S3).
Bystander cardiopulmonary resuscitation
Rates of bystander CPR increased from 30.9% to 82.2% during 1990–2020, corresponding to an OR of 4.80 (95% CI 4.49–5.13) overall, 2.96 (95% CI 2.73–3.21) for witnessed arrests, and 10.79 (95% CI 9.54–12.22) for non-witnessed arrests. The gap between witnessed and non-witnessed cases was reduced over time (Figure 1E).
Cause of cardiac arrest
The proportion of cardiac arrests due to presumed cardiac aetiology decreased from 80.5% to 58.7%, corresponding to an OR of 0.45 (95% CI 0.42–0.48). The trend was similar for men and women (Figure 1F). In 2020, 65.7% of cardiac arrests in men were due to presumed cardiac aetiology, as compared with 51.4% in women. Details are provided in Supplementary material online, Figure S4.
Initial rhythm in out-of-hospital cardiac arrest
During the study period the proportion of cardiac arrests presenting with shockable rhythms decreased from 39.5% in 1990 to 17.4% in 2020 [OR 0.41 (95% CI 0.38–0.43)]. Men displayed higher rates of shockable rhythm throughout the study period. In 2020, 11.4% of women with OHCA presented with a shockable rhythm, as compared with 35.9% in 1990, corresponding to an OR of 0.29 (95% CI 0.26–0.34; Figure 1G).
Critical time delays
The median time from collapse to emergency call and time from collapse to ambulance dispatch remained relatively unchanged during 2005–20. Median time from collapse to CPR dropped from ∼12 to 2 min during 1990–2020. Median time from collapse to defibrillation was ∼12–13 min during the 1990s and 11–12 min in the final decade. Median time from dispatch to ambulance arrival increased from 5 min in 1990 to 11 min in 2020 (Figure 1H).
In-hospital interventions
Use of targeted temperature management increased from 36.6% in 2008 to 42.1% in 2010 and then decreased to 18.2% in 2020. Further details are provided in Supplementary material online, Figures S5 and S6.
Trends in characteristics and outcomes in in-hospital cardiac arrest
Survival and neurological outcome
Trends during 2004–08 were difficult to judge due to wide CIs. After 2008 and until 2020 survival increased from 25.5% to 35.6%. OR for 2017–20 vs. 2004–07 was 1.18 (95% CI 1.06–1.31) overall, 1.22 (95% CI 1.07–1.39) for men and 1.12 (95% CI 0.95–1.33) for women (Figure 2A). In the final decade (2011–20), probability of survival increased by 3.9% (95% CI 2.8%–5.0%) annually (P < 0.00001), resulting in a 46.6% increase during 2011–20 (see Supplementary material online, Table S3). Approximately one in two patients younger than 60 years of age survived during the last decade (Figure 2B).
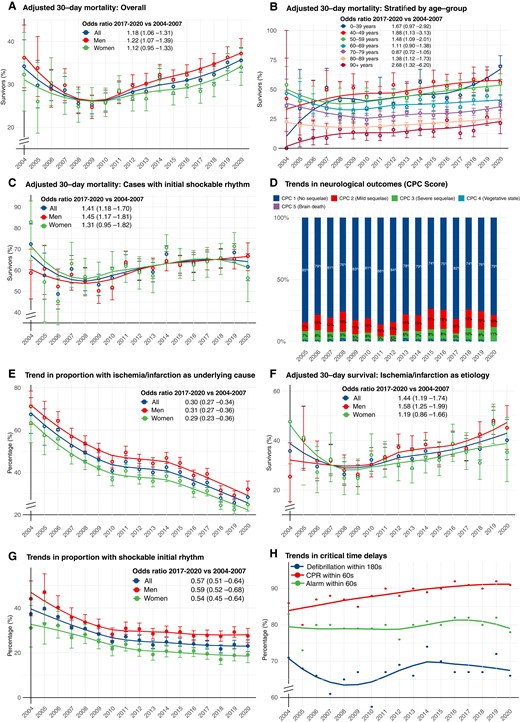
Survival and characteristics in in-of-hospital cardiac arrest during 2004–20. (A–H) shows trends in characteristics, management and survival in in-hospital cardiac arrest in Sweden during 2004–20. All results are adjusted, using logistic regression, for age and sex, except from critical time intervals (provided as crude numbers). Smooth lines depict a polynomial regression line to visualize the trend. Note some y axes in some panels are truncated. Odds ratios and P-values for calendar year modelled as a linear predictor are provided in Supplementary material online, Table S3. OR = odds ratio.
With regard to presenting rhythm, OR for 30-day survival in 2017–20 vs. 2004–07 was 1.41 (95% CI 1.18–1.70) for shockable rhythm. This corresponded to an increase from 55.8% in 2008 to 61.6% in 2020 (Figure 2C). Among patients with non-shockable rhythm, survival increased from 14.2% to 24.6% during 2008–20 [OR 1.41 (95% CI 1.20–1.66); see Supplementary material online, Figure S7].
The proportion of patients who survived to discharge with CPC score 1 or 2 was around 90% during the study period. Despite some fluctuations, no obvious trend was noted (P = 0.342969 for 2005–08 vs. 2017–20). CPC 4 and 5 were uncommon (Figure 2D).
Cause of cardiac arrest
The proportion of cardiac arrests due to myocardial ischaemia or infarction decreased during 2004–20 from 67.4% to 28.3%, corresponding to an OR of 0.30 (95% CI 0.27–0.34). The trend was similar for men and women (Figure 2E). Cases judged to be caused by myocardial ischaemia or infarction increased their survival from 26.3% in 2008 to 40.1% in 2020; OR for 2017–20 vs. 2004–07 was 1.44 (95% CI 1.19–1.74; Figure 2F). The largest increase in any specific cause was noted for primary arrhythmia, which caused 15.1% all IHCAs in 2020 (see Supplementary material online, Figure S8).
Place of cardiac arrest
The proportion of arrests occurring in the emergency room increased from 9.3% to 13.4% and catheterization laboratory from 6.2% to 9.1%, while events in the coronary care unit decreased from 18.0% to 14.2% (see Supplementary material online, Figure S9).
Initial rhythm
During the study period the proportion of cardiac arrests presenting with shockable rhythms decreased from 37.4% in 2004 to 23.0% in 2020, corresponding to an OR (2017–20 vs. 2004–07) of 0.57 (95% CI 0.51–0.64) overall, 0.59 (95% CI 0.52–0.68) for men and 0.54 (95% CI 0.45–0.64) for women (Figure 2G).
Critical time intervals
The proportion of patients receiving CPR within 60 s increased from 86% to 91% during the study period. The number of patients defibrillated within 180 s has remained unchanged, as has the time to alarming the rescue team (Figure 2H).
In-hospital interventions
Use of coronary angiography increased from 19.1% to 22.9% during 2018–20. Rates of percutaneous coronary intervention increased from 16.4% to 19.1%. Use of extracorporeal membrane oxygenation and need for coronary artery bypass grafting were low (see Supplementary material online, Figure S10).
Trends in relative importance of predictors of 30-day survival
Throughout the study period, sex was the least important predictor of survival in OHCA. Age has become the strongest predictor of survival in recent years, stronger than time to CPR and cause of arrest (see Supplementary material online, Figure S11A). In IHCA, location and age dwarfed the importance of all other predictors (see Supplementary material online, Figure S11B).
Discussion
In this nationwide registry-based study we show that over a period of 30 years, survival in OHCA has increased 2.2-fold, with the greatest improvements in men and younger patients. Over a period of 17 years, survival in IHCA has increased 1.2-fold, also with men and younger patients displaying the greatest improvements. However, survival has not changed in OHCA in the final decade, whereas survival in IHCA increased by 47% in the final decade. Approximately 90% of cases of OHCA and IHCA who are discharged alive exhibit good neurological function (CPC 1 or 2), but without any improvement in the last 13 and 16 years, respectively. Importantly, the probability of suffering a cardiac arrest due to heart disease and, in parallel, the probability of presenting with an initial shockable rhythm have halved (Structured Graphical Abstract).
With regard to OHCA, this study indicates that the greatest improvement in survival took place during 1999–2011. The period before 1999 and after 2011 shows relatively steady survival rates. This trend coincides with the introduction of dispatcher assisted (telephone) CPR (introduced in 1998), changes in basic life support training, implementation of systematic and large-scale resuscitation education for laymen and professionals, an increase in rates of bystander CPR, a reduction in time delay to CPR and legislative changes facilitating the dissemination of automated external defibrillators (AEDs) in society. These factors are all plausible explanations for the improvements observed.
The survival trend is balanced by the increase in ambulance response time, which has doubled over the study period. This is the most likely explanation for the fact that time delay to defibrillation show little, if any, improvement. There are multiple explanations for this trend. Over the years, the ambulance has acquired an increasing number of tasks and conditions to handle, and traffic in the urban communities (where the majority of cases occur) has become increasingly entangled. The increase in ambulance response time may contribute to the dramatic reduction in cardiac arrests presenting with a shockable initial rhythm since increased response time results in increased delay to first ECG recording, and thus increased probability of ventricular fibrillation degenerating into asystole or pulseless electrical activity. Additionally, probability of having heart disease as the underlying cause of OHCA dropped by 55% over the study period, which is in line with the downward trend in coronary heart disease (the dominating form of heart disease) in the Swedish population,26 and this also contributes to the 59% drop in the probability of presenting with a shockable rhythm.
We report a 4.8-fold increase in rates of bystander CPR. The majority of all cases of OHCA now receive bystander CPR. The greatest increase in bystander CPR was noted for non-witnessed arrests. This improvement is most likely due to a 40-year campaign in educating the Swedish population in CPR.
It is possible that the proportion of patients presenting with a shockable rhythm will continue to decrease, making it increasingly difficult to resuscitate. It is also possible that non-cardiac will become the dominating aetiologies of cardiac arrest, which will have implications for the management provided by the EMS, ambulance and in-hospital emergency team.
While there were no sex differences in survival during the 1990s, we observed a rapidly evolving difference since year 2000 (Figure 1A). While men improved their survival 2.4-fold, women experienced a 1.7-fold increase in 30-day survival, resulting in a 4% difference in absolute survival in 2020. This stark difference requires the attention of researchers and policy makers. Previous research from the SCRR,27 and elsewhere,28 as well as the current study (see Supplementary material online, Figure S11) shows that these differences are explained by the Utstein predictors (bystander CPR, initial rhythm, location), and sex exerts only a small effect in prediction models including these predictors. This is further corroborated here in Supplementary material online, Figures S1 and S2, which show that when stratifying on initial rhythm, sex differences are dramatically reduced. Men have throughout the study period displayed higher rates of shockable rhythm and the decline (in shockable rhythm) has been more pronounced in women (71% reduction in probability of shockable rhythm for women, compared with 59% reduction for men), and this is likely to contribute to the diverging survival rates in recent years. These results simply suggest that the effect of sex may be mediated by these variables (as downstream mediators), which should therefore be targeted to reduce sex differences in survival. Future studies must investigate these sex differences in greater detail, so that targeted interventions can be tested.
The improvements observed in outcome after OHCA may also be related to advances in post-resuscitation care.29 With regard to targeted temperature management, we observed a gradual decline in its use in the past decade, which coincided with the plateauing of survival. However, a recent study demonstrated that this intervention did not lower mortality30 and is therefore not a likely explanation for the absence of improvements in recent years.
Further improvements in survival in OHCA require measures that enable rapid recognition of cardiac arrest, call for emergency assistance, initiation of resuscitation and use of AEDs.31 Reducing ambulance response time, increasing the dispatch of fire fighters, police, and layperson will improve survival. Innovative approaches should be considered, particularly as several novel and promising systems are gaining evidence base. Mobile phone dispatch of laypersons performing CPR32 and delivery of AEDs using drones33 are such examples. With regards to the prevention of sudden cardiac arrest the decades old approach has been to employ a long-term preventive strategy by identifying individuals at high risk. This strategy has been severely limited by the fact that only a minority of all events occur in high-risk groups; the majority of events occur in the general population not known to be at risk. Furthermore, among high-risk individuals, current strategies—e.g. risk stratification based on left ventricular ejection fraction—does not offer satisfactory individual level precision. Consequently, a large proportion of those who receive an implantable cardioverter-defibrillator (ICD) will never benefit from it, while a substantial number of those who require an ICD will never obtain one using current strategies. It was recently suggested that a more efficient strategy would be to develop a near-term preventive strategy, which entails prompt recognition of symptoms heralding the event, adopting emerging technologies, including artificial intelligence and real-time monitoring of physiological parameters available in devices. We believe this is an appealing strategy and interested readers are referred to Marijon et al.34
With regards to IHCA, we note a J-shaped trend in survival, with a 47% increase in probability of survival in the final decade, and no signs of reaching a plateau. The improvements were found despite the marked reduction in ventricular fibrillation and they were similar irrespective of whether the initial rhythm was shockable or not. The reduction in cases caused by acute myocardial ischaemia or infarction—the likelihood of which dropped by 70% over a period of 17 years—suggests a shift in the epidemiology of IHCA as well. This may to some extent be explained by an improved treatment of hospitalized patients with acute and chronic coronary syndromes, particularly with early revascularization. The marked reduction in ventricular fibrillation is most likely explained by the reduction in ischaemic heart disease as the underlying aetiology. Early revascularization is likely a key factor for improving outcomes in cardiac arrests caused by acute coronary events. Patients with acute coronary events at high risk of arrhythmias and circulatory collapse are more likely to undergo early angiography, making this high risk group less susceptible to cardiac arrest.
While acute and chronic coronary syndromes have historically caused the vast majority of all cases of OHCA and IHCA, our study shows rapid reductions in the proportion of cases caused by these conditions. This must be viewed in the light of the use of sensitive troponin assays in the final years, which enabled the detection of infarctions several orders of magnitude smaller than what was possible in the early years.
There are international variations in the management of OHCA and IHCA, and Swedish guidelines and strategies to optimize the chain of survival are directly adopted from European guidelines, which are also in line with North American guidelines. Additionally, trends in cardiovascular disease in Sweden are comparable with those observed in Europe and North America,26,35,36 while developing countries display a different epidemiological stage that may affect the prevalence of different aetiologies of OHCA and IHCA.37
Our results are similar and relevant to other health care systems around the world. As a comparison, the median survival (to discharge) in the EuReCa registry was 8%, which is slightly lower than the 30-days survival in the current study. Similarly, the proportion discharged with good neurological function in Sweden equals that in other European countries (around 90%). Rates of witnessed cardiac arrests, the proportion of arrests occurring at home, and the proportion with an initial shockable rhythm are also very similar across the countries participating in the EuReCa (European Registry of Cardiac Arrest) registry.38
Researchers and policy makers elsewhere should take notice that women, older individuals, and cases with non-cardiac aetiology are experiencing slower improvements relative to their counterparts, and that 20% of all OHCAs still do not receive bystander CPR and EMS response times are increasing. These are worrying trends that require the immediate attention of all stakeholders.
Limitations
The fact that only patients with cardiac arrest in whom resuscitation is attempted are included in the registry implies that our results only are representative of the patient population that is eligible for, and receives, resuscitation attempts. Changes in this regard may affect characteristics and prognosis of the included population. While such temporal bias is possible, we are unaware of any evidence of it. Additional discussion on this matter is available in the Supplementary material online, Appendix. The machine learning model does not allow for causal inference and only demonstrates each variables predictive performance, ignoring collinearity and mediation. Missing rates were unsatisfactorily high for ROSC variables.
Refer to the Supplementary material online, Appendix for further discussions.
To conclude, we report a 2.2-fold increase in 30-day survival in OHCA over 3 decades and a 1.2-fold increase in survival in IHCA over a period of 17 years, with men and younger patients displaying the most pronounced improvements. The increase in survival in OHCA has reached a plateau the last decade, whereas the improvements in IHCA seem to continue. The vast majority of all cases of OHCA receive bystander CPR. Myocardial ischaemia and infarction evolved from being the dominating causes of OHCA and IHCA, to a diminishing minority.
Author contributions
M.J. and P.S. wrote the first draft of the manuscript and assisted in all analyses. M.J., P.S., A.R. assumes responsibility for analyses, and responsibility for data interpretation. All authors reviewed, commented and revised all versions of the manuscript. A.R. and J.H. conceived the study. All authors decided to submit the manuscript.
Supplementary material
Supplementary material is available at European Heart Journal online.
Funding
Swedish Research Council (2019–02019), Swedish Heart and Lung Foundation (20200261), Swedish state under the agreement between the Swedish government, and the county councils (ALFGBG-971482).
Data availability
Data sharing is available upon request and approval by the Swedish Ethical Review Board.
References
Author notes
Matilda Jerkeman and Pedram Sultanian contributed equally to the study.
Conflict of interest: none declared.

