


Abstract
The lectin-like oxidized low-density lipoprotein receptor-1 (LOX-1) and its shedding product [soluble LOX-1 (sLOX-1)] are implicated in atherosclerotic cardiovascular disease (ASCVD) pathogenesis. Herein, we examined the relationship of sLOX-1 with both fatal events and plaque progression in patients with acute coronary syndromes (ACS).
Plasma sLOX-1 was assessed at baseline in ACS and chronic coronary syndrome (CCS) patients prospectively recruited in the multicentre SPUM-ACS study, with sex- and age-matched healthy subjects serving as additional controls (n = 2924). Compared with both CCS and controls, ACS patients showed markedly elevated sLOX-1 levels (median, 2.00 and 2.00 vs. 35.08 pg/mL; P < 0.0001) which were independently associated with increased mortality risk over 30-day [tertile (T)3: adjusted hazard ratio (HR), 3.11; 95% confidence interval (CI), 1.44–10.61; P = 0.0055] and 1-year intervals (T3: adjusted HR, 2.04; 95% CI, 1.19–3.92; P = 0.0098). Results remained consistent after adjustment for GRACE 2.0 (T3: adjusted HR, 1.86; 95% CI, 1.04–3.74; P = 0.0391) and were primarily driven by the pronounced relationship of sLOX-1 with cardiovascular mortality at 30 days (T3: adjusted HR, 3.81; 95% CI, 1.62–19.62; P = 0.0036) and at 1 year (T3: adjusted HR, 2.29; 95% CI, 1.19–5.34; P = 0.0148). In ACS patients undergoing serial intracoronary imaging and statin therapy, sLOX-1 dropped significantly in those with coronary plaque regression at 1 year (ΔsLOX-1: −4.64 ± 1.80; P = 0.0057), and showed a good discrimination for predicting plaque progression (area under the curve = 0.74; 95% CI, 0.59–0.86; P = 0.0031).
Plasma sLOX-1 levels are increased during ACS and predict fatal events beyond traditional and emerging risk factors. Persistently high sLOX-1 associates with coronary plaque progression in patients with established ASCVD.
NCT01000701.
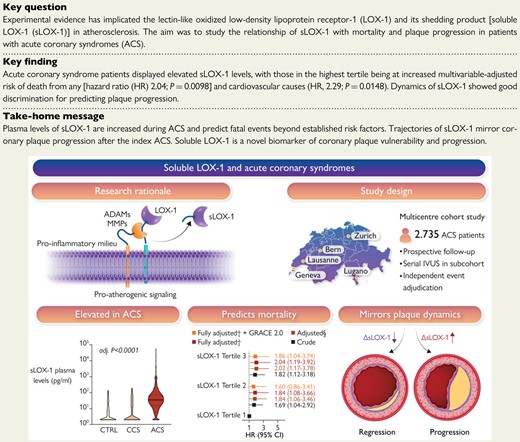
Atherosclerotic plaques express high levels of lectin-like oxidized low-density lipoprotein receptor-1 (LOX-1), with plaque regions particularly prone for instability showing accentuated LOX-1 abundance. The pro-inflammatory milieu within atherosclerotic plaques enhances LOX-1 synthesis, promotes LOX-1 shedding and thus soluble LOX-1 (sLOX-1) release. The turnover of membrane-bound LOX-1 determines plaque composition and thus stability, with systemically circulating sLOX-1 emerging as a novel biomarker reflecting plaque burden and vulnerability. In this multicentre prospective cohort study, we found that plasma levels of sLOX-1 are markedly elevated in patients presenting with acute coronary syndromes (ACS) when compared with both chronic coronary syndrome (CCS) and healthy subjects (CTRL). High sLOX-1 levels were independently associated with a higher multivariable-adjusted 1-year mortality risk following ACS, a finding that remained consistent after controlling for GRACE 2.0. In patients subjected to serial intravascular ultrasound following the index ACS, sLOX-1 dropped markedly in those with coronary plaque regression, while persistently high sLOX-1 levels were associated with plaque progression. §Adjusted for sex, age, ACS type, hs-CRP, history of hypercholesterolaemia, eGFR, LDL-C, and diagnosis of diabetes; †adjusted for sex, age, ACS type, hs-CRP, history of hypercholesterolaemia, eGFR, LDL-C, diagnosis of diabetes, NT-proBNP, and hs-TnT. ADAM, a disintegrin and metalloproteinase; GRACE, Global Registry of Acute Coronary Events; IVUS, intravascular ultrasound; MMP, matrix metalloproteinase; LOX-1, lectin-like oxidized low-density lipoprotein receptor-1; sLOX-1, soluble LOX-1.
See the editorial comment for this article ‘Soluble LOX-1 levels during acute coronary syndrome: a potent and multifaceted warning sign for cardiovascular risk’, by Andrei C. Sposito, https://doi.org/10.1093/eurheartj/ehac173.
Introduction
Acute coronary syndromes (ACS) occur due to an imbalance between plaque stability and healing,1 leading to devastating sequelae such as ventricular arrhythmias, heart failure, and ultimately premature death. Acute coronary syndromes are the major thrombotic complication of atherosclerotic cardiovascular disease (ASCVD), affecting up to 20 million individuals in North America and Europe per annum.2 The dynamic of plaque evolution and stability is shaped by an interplay of factors that promote or mitigate atherogenesis,3,4 with pre-clinical evidence implicating lectin-like oxidized low-density lipoprotein receptor-1 (LOX-1) in key steps of the disease process.5,6 Indeed, initially described as the main scavenger receptor for endothelial-oxidized low-density lipoprotein uptake,7 LOX-1 is increasingly acknowledged as a key factor determining plaque progression and stability.6,8
Atherosclerotic plaques highly express LOX-1,9 and plaque regions particularly prone for instability show accentuated LOX-1 abundance.10–12 The pro-inflammatory milieu within atherosclerotic plaques enhances LOX-1 synthesis,10,13 with certain cytokines, such as tumour necrosis factor alpha (TNF-α) and interleukin (IL)-18, accelerating proteolytic LOX-1 cleavage and, in turn, soluble LOX-1 (sLOX-1) release.10,14,15 The turnover of membrane-bound LOX-1 determines plaque composition and thus stability,8 with systemically circulating sLOX-1 emerging as a novel biomarker reflecting plaque burden and vulnerability.16,17 In fact, observational data consistently linked sLOX-1 to inflammatory activity of atherosclerotic plaques,8,10,18 with elevated sLOX-1 plasma levels relating to poor outcomes in stable patients during long-term follow-up.10,19
Fatal events within 1 year after ACS mainly occur due to complications emerging from the underlying ASCVD.20–23 Presently, such dreadful complications are hardly predictable, as established risk scoring algorithms allow only for a broad-risk stratification without convincing precision,24 in part because sensitive biomarkers reflecting susceptibility for ASCVD progression are lacking. After decades of decreasing ACS mortality rates, clinical outcomes have plateaued in recent years, leaving up to 14.1% of ST-segment elevation myocardial infarction (STEMI) patients with a fatal event after 1 year of follow-up.25 With promising but costly secondary prevention strategies on the horizon,26 precise risk prediction after the acute event will be key to eventually achieve improved outcomes, particularly in those patients at high risk for ASCVD progression despite intensive risk-factor modification.
Given the established role of LOX-1, and in turn sLOX-1, in ASCVD pathogenesis, we sought to investigate systemic levels of sLOX-1, and their relationship with both mortality and plaque progression in ACS patients prospectively recruited in the multicentre SPUM-ACS study (ClinicalTrials.gov Identifier: NCT01000701).
Methods
Study design, inclusion, and exclusion criteria
The SPUM-ACS study is an investigator-driven, multicentre prospective cohort study,27–30 in which a total of 2804 ACS and chronic coronary syndrome (CCS) patients aged ≥18 years were enrolled from January 2010 until January 2019 (see Supplementary material online, Figure S1). Patients with a main diagnosis of ACS and hospital admission within 5 days (preferentially within 72 h) were eligible for inclusion, as reported previously.27,28 Chronic coronary syndrome patients scheduled for coronary artery bypass grafting (CABG) were concurrently enrolled and, in conjunction with sex- and age-matched healthy control subjects (Blood Donation Center Zurich, Zurich, Switzerland), served as a comparison group for plasma sLOX-1 levels at baseline (Table 1). Chronic coronary syndrome patients were eligible for inclusion, if (i) left-main or proximal left-anterior descending coronary artery stenosis >50%, (ii) two- or three-vessel disease with stenosis >50% and impaired left ventricular function [left ventricular ejection fraction (LVEF) ≤35%], (iii) a large area of left ventricular ischaemia detected by functional testing/invasive fractional flow reserve, or (iv) a single remaining patent coronary artery with stenosis >50% was present. Patients with severe physical disability, dementia, or with a non-cardiac life expectancy <1 year were not eligible for inclusion. Diagnoses of both ACS and CCS were verified independently by personnel at the local study site. In all participants, ethylenediaminetetraacetic acid (EDTA) blood was collected at the time of presentation prior to any intervention (Table 1) and centrifuged before plasma samples were immediately stored at −80°C, and eventually transferred to the central biobank (University Hospital Zurich). Treating physicians were advised to apply guideline-based therapy regimens, including statin therapy, angiotensin-converting enzyme inhibitors/angiotensin II receptor blockers, beta-blockers, and antiplatelet therapy with aspirin and P2Y12 inhibitors, as appropriate. All study participants gave written informed consent prior to their enrolment. This study was conducted according to the Declaration of Helsinki, and was approved by the cantonal Ethics Committee Zurich (reference number: EK-1688/2019-01809).
Baseline characteristics of SPUM-ACS Biomarker Study participants
| CTRL | CCS patients | ACS patients | P-value | sLOX-1 Tertile 1 | sLOX-1 Tertile 2 | sLOX-1 Tertile 3 | P-value | |
|---|---|---|---|---|---|---|---|---|
| ≤21.33 pg/mL | >21.33–56.94 pg/mL | >56.94 pg/mL | ||||||
| (n = 120) | (n = 69) | (n = 2639) | Groups | (n = 880) | (n = 879) | (n = 880) | Tertiles | |
| Age (years) | 63.7 ± 0.72 | 65.7 ± 1.2 | 63.7 ± 0.2 | 0.195 | 64.1 ± 0.4 | 64.2 ± 0.4 | 62.8 ± 0.4 | 0.032 |
| Female sex | 24 (20.0) | 7 (10.1) | 525 (19.9) | 0.132 | 171 (19.4) | 186 (21.2) | 168 (19.1) | 0.507 |
| ACS type | ||||||||
| STEMI | — | — | 1385 (53.7) | — | 407 (47.9) | 486 (56.1) | 492 (57.0) | <0.001 |
| NSTE-ACS | — | — | 1194 (46.3) | — | 442 (52.1) | 381 (43.9) | 371 (43.0) | |
| Pre-hospital delay (min) | — | — | 165 (91–343) | — | 165 (95 - 344) | 165 (95 - 330) | 155 (90 - 360) | 0.816 |
| Hx of hyperlipidaemia | — | 54 (78.3) | 1686 (63.9) | 0.014 | 566 (64.3) | 573 (65.2) | 547 (62.2) | 0.396 |
| Hx of diabetes | — | 28 (40.6) | 453 (17.2) | <0.001 | 161 (18.3) | 158 (18.0) | 134 (15.2) | 0.172 |
| Hx of hypertension | — | 56 (84.8) | 1438 (54.5) | <0.001 | 498 (56.7) | 478 (54.4) | 462 (52.5) | 0.216 |
| Hx of systemic inflammatory disease | — | 0 (0.0) | 72 (2.7) | 0.263 | 28 (3.2) | 28 (3.2) | 16 (1.8) | 0.127 |
| Current smoker | — | 22 (31.9) | 956 (36.7) | 0.414 | 318 (36.4) | 318 (36.6) | 320 (37.0) | 0.960 |
| Systolic blood pressure (mmHg) | — | 139.4 ± 3.0 | 128.3 ± 0.5 | <0.001 | 128.7 ± 0.8 | 128.6 ± 0.8 | 127.6 ± 0.8 | 0.589 |
| LVEF (%) | — | 53 (43–62) | 50 (45–60) | 0.507 | 55 (45–60) | 52 (45–60) | 50 (45–60) | 0.016 |
| hs-CRP (mg/L)a | — | 2.4 (1.1–6.7) | 2.6 (1.1–6.7) | 0.725 | 2.5 (1.1–6.0) | 2.5 (1.1–6.5) | 2.7 (1.1–8.1) | 0.370 |
| sLOX-1 (pg/mL) | 2.0 (2.0–6.9) | 2.0 (2.0–13.0) | 35.1 (15.8–73.4) | <0.001 | 10.2 (5.2–10.8) | 35.1 (27.8–44.0) | 106.4 (73.4–102.5) | <0.001 |
| LDL-C (mmol/L) | — | 2.5 (2.0–3.3) | 3.1 (2.4–3.8) | 0.040 | 2.9 (2.3–3.6) | 3.2 (2.5–3.9) | 3.1 (2.4–3.9) | <0.001 |
| hs-TnT (ng/L)b | — | 34 (14–117) | 182 (55–572) | <0.001 | 144 (43–470) | 172 (62–551) | 243 (64–745) | <0.001 |
| NT-proBNP (ng/L)c | — | 623 (129–1378) | 290 (89–1067) | 0.230 | 274 (87–997) | 295 (95–1050) | 303 (85–1195) | 0.553 |
| eGFR (mL/min/1.73 m2) | — | 82 (57–92) | 88 (72–99) | 0.001 | 88 (73–99) | 87 (71–99) | 88 (71–99) | 0.771 |
| Baseline medication | ||||||||
| Aspirin | — | 57 (86.4) | 687 (41.5) | <0.001 | 270 (45.3) | 214 (38.6) | 203 (40.0) | 0.053 |
| P2Y12 inhibitor | — | 7 (10.6) | 161 (9.7) | 0.811 | 61 (10.2) | 50 (9.0) | 50 (9.9) | 0.780 |
| Beta-blocker | — | 35 (53.0) | 543 (33.0) | 0.001 | 205 (34.6) | 179 (32.6) | 159 (31.5) | 0.554 |
| ACE inhibitor/ARB | — | 46 (70.8) | 885 (53.8) | 0.007 | 337 (56.8) | 290 (52.8) | 258 (51.4) | 0.168 |
| Vitamin K antagonist/DOAC | — | 11 (16.7) | 115 (6.9) | 0.003 | 43 (7.2) | 38 (6.9) | 34 (6.7) | 0.943 |
| Statin | — | 60 (90.9) | 645 (39.0) | <0.001 | 257 (43.2) | 207 (37.5) | 181 (35.8) | 0.028 |
| Index intervention | ||||||||
| PCI | — | — | 2327 (93.0) | — | 749 (91.8) | 789 (93.2) | 789 (94.0) | 0.195 |
| CABG | — | 69 (100) | 20 (0.8) | <0.001 | 8 (1.0) | 7 (0.8) | 5 (0.6) | 0.676 |
Categorical data are shown as numbers and percentages (%). Continuous data are presented as median and inter-quartile range or as mean ± standard error of means. Groups were compared by the Mann–Whitney test, Student's t-test for independent samples, one-way analysis of variance, χ2 test, Fisher's exact test, or Kruskal–Wallis test, as appropriate.
ACE, angiotensin-converting enzyme; ACS, acute coronary syndrome; ARB, angiotensin II receptor blocker; CABG, coronary artery bypass grafting; CCS, chronic coronary syndrome; CTRL, healthy controls; DOAC, direct oral anticoagulant; eGFR, estimated glomerular filtration rate; hs-CRP, high-sensitivity C-reactive protein; hs-TnT, high-sensitivity cardiac troponin T; Hx, history; LDL-C, low-density lipoprotein cholesterol; LVEF, left ventricular ejection fraction; NSTE-ACS, non-ST-segment elevation ACS; NT-proBNP, N-terminal prohormone of brain natriuretic peptide; PCI, percutaneous coronary intervention; STEMI, ST-segment elevation myocardial infarction; sLOX-1, soluble lectin-like oxidized low-density lipoprotein receptor-1.
Available in 2606 (98.7%) ACS patients.
Available in 2604 (98.7%) ACS patients.
Available in 2601 (98.6%) ACS patients.
Intravascular ultrasound
A subcohort of ACS patients simultaneously enrolled in the Integrated Biomarkers and Imaging Study-4 and, thus on rigorous statin therapy (rosuvastatin 40 mg/day), was subjected to both longitudinal sLOX-1 measurements and serial intracoronary intravascular ultrasound (IVUS) at baseline and 1-year follow-up according to a pre-specified study protocol.4 Briefly, the proximal segment (50 mm) of the two non-infarct-related epicardial coronary arteries (non-IRAs) was imaged following successful primary percutaneous coronary intervention (PCI; TIMI [thrombolysis in myocardial infarction] flow ≥2) using a 20 MHz ultrasound catheter (Eagle Eye; Volcano Cooperation, Rancho Cordova, CA, USA). Between two anatomical landmarks (proximal: left-main bifurcation/ostium of the right coronary artery; distal: side-branch) the region of interest (ROI) was selected (most diseased 10 mm). Only images (30 frames/s) meeting pre-specified quality criteria were further processed, as assessed by an external core laboratory (Cardialysis B.V., Rotterdam, The Netherlands). At 1-year follow-up (i.e. between Months 10 and 13 following the index event), the imaging protocol was repeated on the same segments. Within each matched ROI, both the external elastic membrane and lumen were measured in each frame (corresponding to ∼0.4 mm) by an independent investigator blinded to the temporal sequence of serial images using an established analysis pipeline (QIVUS, Medis, Leiden, The Netherlands). For each patient, plaque atheroma volume (PAV) for at least two non-IRAs per time-point was assessed, and absolute changes (mean) within matched regions during follow-up were calculated.
Follow-up, event adjudication, and study oversight
Acute coronary syndrome patients recruited in the SPUM-ACS Biomarker Study31 were followed at 30 days (phone call) and 1 year (clinical visit). At each study site, baseline and event data were documented by a trained study nurse using a web-based centralized data entry system (CARDIOBASE, Clinical Trial Unit and Department of Cardiology, University Hospital Bern, Bern, Switzerland and Webspirit Systems GmbH, Ulm, Germany). Fatal events were adjudicated by an independent clinical endpoint committee comprising three certified external expert cardiologists blinded to patient's baseline characteristics using pre-specified adjudication forms and stratified to the cause of death (i.e. all-cause, cardiac, or cardiovascular). As noted above (see section ‘Intravascular ultrasound’), in study participants subjected to serial IVUS, the intracoronary imaging protocol was repeated on the same non-IRA segments at 1-year follow-up, and plasma sLOX-1 was again assessed. Patient recruitment and data collection were overseen by a study committee involving expert cardiologists from each participating study centre.
Biomarker measurements
Frozen EDTA plasma aliquots were thawed on ice and immediately processed thereafter. N-terminal prohormone of brain natriuretic peptide (NT-proBNP), high-sensitivity C-reactive protein (hs-CRP), and high-sensitivity troponin T (hs-TnT) were measured centrally in the core laboratory (University Hospital Zurich, Zurich, Switzerland) using high-sensitivity assays. To that end, electrochemiluminescence (NT-proBNP and hs-TnT) or particle-enhanced turbidimetric immunoassays (hs-CRP) were employed (all obtained from Roche Diagnostics, Boehringer Mannheim, Indianapolis, IN, USA). Soluble LOX-1 plasma levels were assessed by commercially available human LOX-1 enzyme-linked immunosorbent assays (Thermo Scientific™ Pierce™, Waltham, MA, USA) with a lower limit of detection of 2.00 pg/mL. Absorbance was measured on a plate reader (Infinite® 200 PRO, TECAN, Männedorf, ZH, Switzerland) set at 450 and 550 nm, respectively. Quantitative analysis of each sample was performed using a four-parameter logistic (4PL) curve fit. The intra-assay and inter-assay coefficients of variation (%) were 3.36 and 5.14, respectively. The personnel performing the biochemical analyses was blinded to each sample's allocation, and all samples were measured in parallel.
Study endpoints and objectives
The primary objective of the study was to evaluate the association between sLOX-1 and mortality from any cause at 30 days and at 1 year in patients with ACS. Secondary objectives were to investigate (i) the association of sLOX-1 with mortality from cardiovascular causes, (ii) its interplay with hs-CRP on the risk of death from any or cardiovascular causes, and (iii) the association of temporal changes with absolute changes in PAV in non-IRA in patients on statin therapy subjected to both serial intracoronary imaging and longitudinal sLOX-1 measurements, following a study protocol as reported in detail previously.4
Statistical analyses
Continuous variables are presented as mean ± standard error of the mean or as median and inter-quartile range (IQR) if skewed. Categorical data are shown as counts and valid percentages. Continuous variables were compared by Student's t-test, Mann–Whitney U-test, one-way analysis of variance (ANOVA), one-way analysis of covariance (ANCOVA), or mixed two-way ANOVA, and categorical variables by the χ2 test, Fisher's exact test, or rank-based Kruskal–Wallis H test, as appropriate. Between-subject effects (ACS vs. CCS) were corrected for potential phenotypic differences, including age, hs-TnT, hs-CRP, NT-proBNP, LVEF, and a diagnosis of diabetes as well as hypertension. Smoothed HR plots for each outcome vs. continuous sLOX-1 (dose–response curves) were controlled for pre-specified covariates included in the corresponding core model. Given the non-linear associations of sLOX-1 with the main outcomes of interest (see Supplementary material online, Figure S2A and B), patients were divided into tertiles, with the lowest tertile (≤21.33 pg/mL) serving as the reference. Nelson–Aalen analyses and Cox proportional hazard regression models were employed to compare time-to-event data between groups at both 30 days and 1 year (365 days). The proportional hazard assumption was met for all covariates included in the corresponding core model. Based on previous observations and biological plausibility,32–39 pre-specified covariates, including sex, age, ACS type, hs-CRP, a history of hypercholesterolaemia, estimated glomerular filtration rate (eGFR; assessed by the Chronic Kidney Disease Epidemiology Collaboration formula),40,41 low-density lipoprotein cholesterol (LDL-C), a diagnosis of diabetes, NT-proBNP, hs-TnT (core model), and GRACE 2.0 risk at baseline (using thresholds for 1-year mortality risk: <3% low, ≥3 and ≤8% intermediate, and >8% high risk, as defined previously)42 were included in the corresponding Cox regression model in a step-wise fashion, as specified in detail in the respective figure legend (Figures 2 and 3; Supplementary material online, Tables S2–S4). To assess the joint association of sLOX-1 and hs-CRP with adverse outcomes, combinations of sLOX-1 and hs-CRP levels (below and above the third tertile, respectively) were coded as categorical variables, as reported previously.43 To assess the predictive utility of sLOX-1 on a continuous scale, proportional-hazards regression models with three-knot restricted cubic splines (RCS) of continuous sLOX-1 were employed to model the association between this biomarker and the main outcomes without assuming linearity. Selection of optimal number of knots was based on likelihood-ratio tests. Knots for RCS were fixed at the 10th, 50th, and 90th percentiles of sLOX-1, with reported HRs corresponding to the comparison of the 80th vs. 20th percentile of sLOX-1, as indicated (see Supplementary material online, Table S3). Resampling techniques (i.e. bootstrapping with replacement and 10 000 replicates) were used for internal validation of the independent association of sLOX-1 tertiles with all-cause death or death from cardiovascular causes in our regression models by constructing 95% bias-corrected bootstrapped confidence intervals for mean estimates of regression coefficients, as reported previously.44 To determine the discriminatory performance of ΔsLOX-1, the true-positive rate against the false-positive rate at various thresholds was plotted and the area under the curve (AUC) assessed using DeLong's test. Results were deemed statistically significant if multiplicity adjusted P < 0.05 (two-sided). Data reporting follows the principles outlined by the STROBE initiative. Statistical analyses were performed using SPSS version 26.0 (IBM, Armonk, NY, USA) and STATA package, version 16.1 (StataCorp, College Station, TX, USA).
Results
Soluble LOX-1 is elevated during acute coronary syndromes
A total of 2747 ACS and CCS patients were included in the SPUM-ACS Biomarker Study, with sex- and age-matched healthy subjects (CTRL) serving as additional controls (see Supplementary material online, Figure S1). Baseline characteristics of the study population, overall and ACS patients stratified by sLOX-1 tertiles, are summarized in Table 1. Compared with both, CCS patients (n = 69) and CTRL (n = 120), ACS patients (n = 2639) displayed markedly elevated sLOX-1 levels [CCS and CTRL vs. ACS, 2.00 (2.00–13.01) and 2.00 (2.00–6.93) vs. 35.08 (15.75–73.44) pg/mL, respectively, P < 0.0001; Figure 1A], which remained significant after controlling for potential phenotypic differences between ACS and CCS patients, respectively (ACS vs. CCS, adjusted mean: 37.80, 95% confidence interval (CI) 35.32–40.45 vs. 6.02, 95% CI 3.80–9.54 pg/mL; P < 0.0001). Notably, elevations in sLOX-1 were particularly evident in those with STEMI (STEMI vs. NSTE-ACS, 39.19 (18.44–76.24) vs. 30.87 (13.82–69.95) pg/mL; P < 0.0001; Figure 1B), even when correcting for hs-TnT (adjusted mean: 38.04, 95% CI 35.39–40.89 vs. 29.26–34.06 pg/mL; P = 0.0005). Since LOX-1 shedding has been proposed to be driven by systemic inflammation, myocardial stress, and dyslipidaemias,10,45,46 we next sought to investigate the associations of plasma sLOX-1 with established biomarkers mirroring these states. Intriguingly, weak to no correlation of plasma sLOX-1 with hs-CRP, NT-proBNP, LDL-C, and hs-TnT was observed (ρ for each <0.15; Figure 1C).
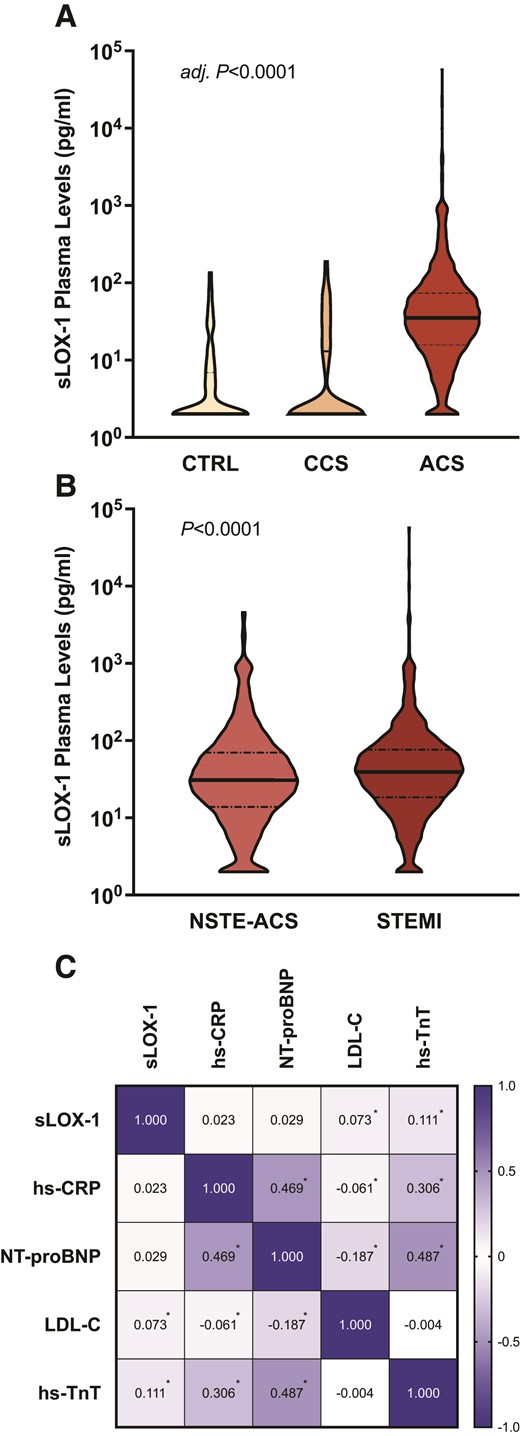
Soluble LOX-1 at baseline and its interplay with established biomarkers. (A) Violin plot showing the distribution of soluble LOX-1 plasma levels in acute coronary syndrome patients compared with sex- and age-matched control subjects (CTRL) and patients with chronic coronary syndrome. (B) Plasma soluble LOX-1 levels in patients with NSTE-ACS vs. STEMI are plotted. (C) The correlation matrix of plasma soluble LOX-1 with biomarkers reflecting systemic inflammation, myocardial stress, and dyslipidaemias. The respective P-values for between-group comparisons are shown, with the family-wise error rate being controlled by the Bonferroni method. Bold lines indicate the median, and dashed lines the inter-quartile range. Spearman's ρ is shown within each rectangle, with colour intensity indicating the strength of association. *P < 0.05. ACS, acute coronary syndrome; CCS, chronic coronary syndrome; CTRL, healthy controls; NSTE-ACS, non-ST-segment elevation ACS; sLOX-1, soluble lectin-like oxidized low-density lipoprotein receptor-1; STEMI, ST-segment elevation myocardial infarction.
High soluble LOX-1 portends poor survival beyond GRACE 2.0
At 1 year of follow-up, 107 deaths occurred, with the highest death rates present among patients with high plasma sLOX-1 levels. Indeed, Nelson–Aalen curves show a gradual increase in mortality across sLOX-1 tertiles, with smoothed HR plots indicating a dose–response relationship (Figure 2A and C). After multivariable adjustment, high sLOX-1 levels (third tertile) were associated with a roughly threefold increased risk of death from any cause at 30 days (T3: fully adjusted HR, 3.11, 95% CI, 1.44–10.61; P = 0.0055; Figure 2B, left). At longer follow-up, high plasma sLOX-1 was identified as a strong independent predictor of all-cause mortality over 1 year (T3: fully adjusted HR, 2.04, 95% CI, 1.19–3.92, P = 0.0098; Figure 2B, right), which remained consistent after adjusting the multivariable Cox model for the GRACE 2.0 score (T3: fully adjusted + GRACE 2.0 HR, 1.86, 95% CI, 1.04–3.74; P = 0.0391). While deaths from non-cardiovascular causes were evenly distributed among sLOX-1 tertiles, mortality from cardiovascular causes showed a successive increase across sLOX-1 tertiles (see Supplementary material online, Figure S2C), reflected by higher HRs on both categorical and continuous scales (see Supplementary material online, Tables S2 and S3).
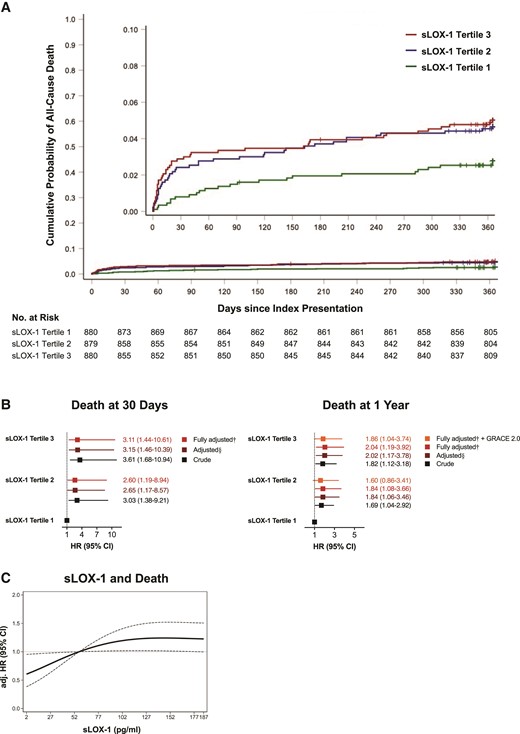
Associations of soluble LOX-1 with mortality from any cause. (A) Nelson–Aalen estimates and the risk for death from any cause stratified by soluble LOX-1 tertiles. Censored observations are indicated as tick marks. Log-rank P = 0.0456. (B) Crude, adjusted, and fully adjusted ratio of the hazard rates for all-cause mortality at 30 days (left) and 1 year (right) with models being controlled for established risk factors in a step-wise manner. §Adjusted for sex, age, acute coronary syndrome type, high-sensitivity C-reactive protein, history of hypercholesterolaemia, estimated glomerular filtration rate, LDL-C, and diagnosis of diabetes. †Adjusted for sex, age, acute coronary syndrome type, high-sensitivity C-reactive protein, history of hypercholesterolaemia, estimated glomerular filtration rate, LDL-C, diagnosis of diabetes, N-terminal prohormone of brain natriuretic peptide, and high-sensitivity cardiac troponin T. The fully adjusted model predicting 1-year death was additionally controlled for 1-year mortality risk estimated by GRACE 2.0, as indicated. Squares represent hazard ratios with line lengths corresponding to 95% confidence intervals (calculated under resampling). (C) Fully adjusted hazard ratio of all-cause death according to soluble LOX-1 levels with the reference set at the third tertile. Dotted lines indicate the corresponding 95% confidence interval. CI, confidence interval; eGFR, estimated glomerular filtration rate; hs-CRP, high-sensitivity C-reactive protein; HR, hazard ratio; hs-TnT, high-sensitivity cardiac troponin T; LDL-C, low-density lipoprotein cholesterol; NT-proBNP, N-terminal prohormone of brain natriuretic peptide; sLOX-1, soluble lectin-like oxidized low-density lipoprotein receptor-1.
Association with mortality is mainly driven by cardiovascular deaths
The association of high sLOX-1 with all-cause mortality at 1 year was mainly driven by the high proportion of fatal events due to cardiovascular causes (see Supplementary material online, Figure S2C), hence we next sought to investigate the predictive utility of sLOX-1 for cardiovascular mortality. Indeed, high sLOX-1 showed a pronounced association with cardiovascular mortality, with patients in the highest tertile displaying a 2.3-fold increased risk of cardiovascular mortality within 1 year of follow-up (T3: fully adjusted HR, 2.29, 95% CI, 1.19–5.34; P = 0.0148). Similarly, the risk of cardiovascular death at 30 days was increased by 281% in the highest tertile (T3: fully adjusted HR, 3.81, 95% CI, 1.62–19.62; P = 0.0036; Figure 3). Given the widely reported crosstalk of CRP and LOX-1,47 an explorative analysis of the joint association between sLOX-1, hs-CRP, and fatal events was performed. When stratified according to plasma hs-CRP and sLOX-1 levels (above or below T3), patients with high plasma sLOX-1 consistently showed a higher risk for death from any cause and death from cardiovascular causes, suggesting that elevated levels of this biomarker mirror a high risk for fatal events independent of the systemic inflammatory burden reflected by hs-CRP (see Supplementary material online, Figure S2D–F).
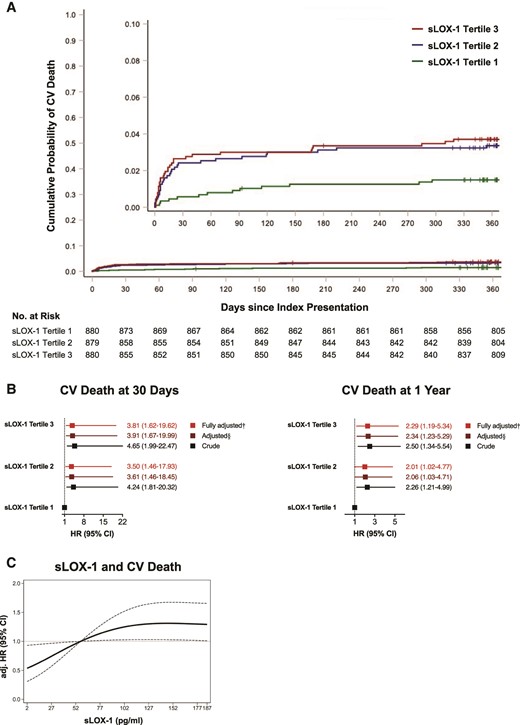
Relationship of soluble LOX-1 with cardiovascular mortality. (A) Nelson–Aalen curves and risk of cardiovascular deaths ranked by soluble LOX-1 tertiles. Note that tick marks indicate censored observations. Log-rank P = 0.0126. (B) Crude and adjusted hazard ratio for cardiovascular death at 30 days (left) and at 1 year (right). The Cox proportional hazard regression models were controlled for established risk factors in a step-wise fashion: §adjusted for sex, age, acute coronary syndrome type, high-sensitivity C-reactive protein, history of hypercholesterolaemia, estimated glomerular filtration rate, LDL-C, and diagnosis of diabetes; †adjusted for sex, age, acute coronary syndrome type, high-sensitivity C-reactive protein, history of hypercholesterolaemia, estimated glomerular filtration rate, LDL-C, diagnosis of diabetes, N-terminal prohormone of brain natriuretic peptide, and high-sensitivity cardiac troponin T. Line lengths equal corresponding 95% confidence interval with squares indicating the hazard ratio (calculated under resampling). (C) Dose–response curve showing fully adjusted hazard ratio for death from cardiovascular causes according to soluble LOX-1 levels, with dotted lines indicating the corresponding 95% confidence interval (reference set at the third tertile). CI, confidence interval; CV, cardiovascular; eGFR, estimated glomerular filtration rate; HR, hazard ratio; hs-CRP, high-sensitivity C-reactive protein; hs-TnT, high-sensitivity cardiac troponin T; LDL-C, low-density lipoprotein cholesterol; NT-proBNP, N-terminal prohormone of brain natriuretic peptide; sLOX-1, soluble lectin-like oxidized low-density lipoprotein receptor-1.
Persistently high soluble LOX-1 levels associate with coronary plaque progression
Given the pronounced association of sLOX-1 with cardiovascular mortality, coupled with its role in ASCVD progression in pre-clinical models,6,8 we next sought to investigate the relationship between plasma sLOX-1 and coronary plaque progression in non-IRAs in patients undergoing serial intracoronary imaging following the index ACS (see Supplementary material online, Figure S1 and Table S1; n = 57). Within 1 year of lipid-lowering therapy, the mean PAV decreased in two-thirds of patients (mean change in %, −2.74 ± 0.39%), while it increased in one-third (mean change in %, +1.90 ± 0.41%). When classified according to plaque evolution (decrease vs. increase in the mean PAV), patients with plaque regression showed a significant decrease in plasma sLOX-1 levels during 1 year of follow-up (mean ΔsLOX-1, −4.64 pg/mL; P = 0.0057) whereas in patients with plaque progression consistently high plasma sLOX-1 levels were observed (mean ΔsLOX-1, +21.2 pg/mL, P = 0.3162; Supplementary material online, Table S1; Figure 4A–C). Indeed, in a mixed effects analysis, a marked interaction between plasma sLOX-1 trajectories and plaque dynamics could be established (F = 6.48, P for interaction = 0.0147, partial η 2 = 0.1336). In addition, absolute changes in plasma sLOX-1 levels showed good discrimination for predicting plaque progression during the first year after ACS (AUC = 0.74; 95% CI, 0.59–0.86; P = 0.0031; Figure 4D).
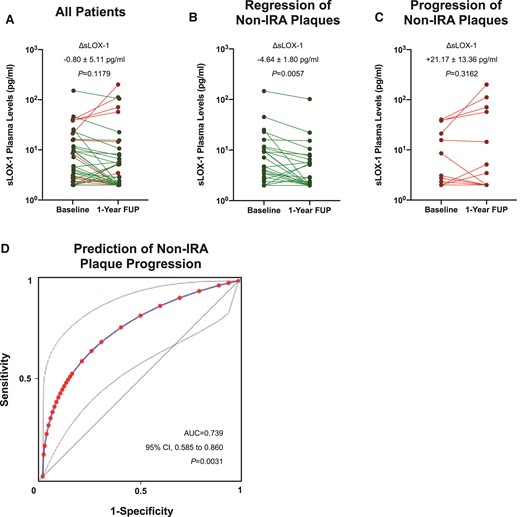
Trajectories of soluble LOX-1 and associated coronary plaque volume changes in patients on statin therapy. (A) Line plot showing paired soluble LOX-1 plasma levels at baseline and 1-year follow-up in all patients. (B) Mean change in soluble LOX-1 plasma levels over 1 year in patients with coronary plaque volume regression. (C) Plasma soluble LOX-1 levels at both baseline and 1-year follow-up in subjects with plaque volume progression in non-infarct-related arteries. (D) Receiver operating characteristic curve (fitted) and corresponding area under the curve for the correct classification of plaque progression/regression in non-infarct-related arteries according to absolute changes in sLOX-1 (ΔsLOX-1). Note that grey lines indicate the corresponding 95% confidence interval. AUC, area under the curve; CI, confidence interval; non-IRA, non-infarct-related arteries; ROC, receiver operating characteristic curve; sLOX-1, soluble lectin-like oxidized low-density lipoprotein receptor-1.
Discussion
Here, we show for the first time that (i) elevated plasma sLOX-1 levels, as observed during ACS, predict fatal events beyond both established cardiovascular risk factors and the updated GRACE score, and (ii) that sLOX-1 trajectories mirror coronary plaque progression following ACS (Structured Graphical Abstract).
To the best of our knowledge, this is the first, prospectively conducted, large-scale study showing that elevated plasma sLOX-1 levels, assessed at the time of presentation, are predictive for 1-year mortality after ACS. These associations were independent of traditional and emerging risk factors, such as hs-CRP (reflecting inflammatory pathways) and hs-TnT (mirroring myocardial injury), as well as baseline risk, as assessed by the updated GRACE score. Elevations in plasma sLOX-1 were particularly predictive for cardiovascular deaths, a devastating complication typically evolving due to ASCVD progression.20–23 Although LDL-C-lowering therapy after ACS improves cardiovascular survival in the majority of patients,48 the residual risk remains substantial,49 particularly in those with progressive ASCVD despite aggressive risk-factor management.50
At the cellular level, sLOX-1 is released from the cell membrane upon ectodomain shedding of membrane-bound LOX-1,14 a cell surface receptor pivotally implicated in key processes of atherogenesis.5,6 Although the major source of plasma sLOX-1 is a matter of ongoing investigations,51 it is thought-provoking that the pro-oxidative and pro-inflammatory milieu underpinning atherosclerotic plaque progression and vulnerability, particularly during acute coronary events, enhances both LOX-1 expression and cleavage,10,15,52–55 with LOX-1 expression being largely confined to cell-types contributing to the build-up of atherosclerotic plaques.5,6 Accordingly, patients with an acute manifestation of ASCVD show elevated sLOX-1 levels across independent studies,46,56,57 with maximum levels of sLOX-1 preceding ischaemic injury markers in a previously conducted pilot study.46 In line with these findings, markedly elevated sLOX-1 plasma levels were found in patients presenting with ACS in the present study, when compared with both CCS patients and healthy controls (CTRL). Intriguingly, plasma levels of sLOX-1 were similar between CCS patients and control subjects (adj. P > 0.9999), indicating that baseline levels of sLOX-1 are relatively low, even in patients with established ASCVD, whereas they are markedly elevated during ACS.
At baseline, there was weak to no correlation of sLOX-1 with hs-TnT and hs-CRP (ρ for both <0.15). The latter is of particular relevance because human macrophages studied in vitro augment the liberation of sLOX-1 upon exposure to CRP.45 Similarly, IL-18, another mediator acting further upstream of the IL-1, TNF-α, IL-6 signalling pathway,58 accelerates endothelial LOX-1 shedding, and in turn sLOX-1 release.15 Hence, LOX-1 shedding, as it occurs during ACS, is therefore most likely initiated by mediators other than those responsible for hepatic CRP synthesis. However, to address the interplay of inflammatory mediators and sLOX-1 in greater detail, longitudinally designed studies are warranted, as dissimilarities in biomarker kinetics may mask potential relationships between levels of sLOX-1 and proxies of systemic inflammation. Indeed, while serum levels of sLOX-1 have been shown to peak early after the event,46 systemic mediators of the IL-1, TNF-α, IL-6 signalling pathway show markedly delayed kinetics,59 and are strongly affected by the time elapsed between symptom onset and presentation. In contrast, pre-hospital delay was similar between sLOX-1 tertiles (P = 0.816; Table 1) and showed no interaction with sLOX-1 levels (P = 0.3276) in the current study, indicating that plasma levels of sLOX-1 rise acutely and remain unchanged within the first hours of the acute event. Hence, while locally operative pro-inflammatory mechanisms are likely involved in LOX-1 shedding, as suggested by a huge body of pre-clinical evidence,14,15,45 the current study provides hints that the increase in sLOX-1 occurs early during ACS, and might be driven by mediators other than those reflecting systemic inflammatory burden.
Although low levels of LOX-1 are also expressed in cardiomyocytes,6 it appears unlikely that the injured myocardium is the main source of plasma sLOX-1, considering the poor correlation of sLOX-1 with hs-TnT at baseline (Figure 1C). Indeed, it is thought-provoking that patients with STEMI showed more pronounced elevations in plasma sLOX-1 when compared with those with NSTE-ACS, a finding that remained consistent after correcting for hs-TnT (P = 0.0005). In this regard, it is noteworthy that STEMI patients are more likely to have coronary plaque rupture,60 a dreadful sequela of atherosclerosis that is accompanied by the activation of inflammatory pathways within the vessel wall that intriguingly overlap with those implicated in sLOX-1 release,15,53 and coincides with an accentuated increase in systemic sLOX-1 levels in these patients, which is in line with previous reports.61,62
The majority of patients having an adequate response to statin therapy following the index ACS show coronary plaque regression,4 which closely associates with improved cardiovascular outcomes.4,20 Indeed, during statin therapy atherosclerotic coronary plaques increasingly adopt features of plaque healing (e.g. enhanced collagen synthesis, reduced lipid content and oxidative stress, and blunted activation of both endothelial cells and macrophages).1 Importantly, in our subcohort of ACS patients treated with 40 mg rosuvastatin daily, and subjected to both serial intracoronary imaging and longitudinal sLOX-1 measurements, those with plaque regression in non-IRA showed a marked decline in circulating sLOX-1, whilst those with plaque progression did not. This hypothesis-generating finding again argues for a plaque-derived source of sLOX-1, and highlights a potential diagnostic avenue to assess ASCVD progression in high-risk patients less invasively.
While previously conducted interventional trials so-far failed to gain therapeutic benefit from the emerging understanding of oxidized lipids in atherogenesis,3 our study provides hints that the shedding product of LOX-1, sLOX-1, may represent a novel and cost-effective marker of coronary plaque vulnerability and progression, and thus may provide a promising means to direct future patient management. While we must deepen our understanding of the main sources of plasma sLOX-1 in vivo, the design of large-scale studies investigating the diagnostic accuracy of longitudinal sLOX-1 levels to predict plaque progression/regression merits consideration.
Limitations
Potential limitations of this study warrant consideration. First, only few CCS patients were included in the current study, and these patients are characterized by specific inclusion criteria, which may be reflected by phenotypic differences with a potential impact on sLOX-1 plasma levels. However, differences were similarly observed in the independent control group (i.e. sex- and age-matched healthy controls) and remained consistent after controlling for differences in baseline characteristics, with similar results reported by independent groups,46,63,64 strengthening the notion that sLOX-1 levels are indeed diminished in patients with CCS when compared with ACS. Second, the event rate in our study was relatively low. Yet, the strong association of sLOX-1 at both categorical (Supplementary material online, Table S2) and continuous scales (Supplementary material online, Table S3) with multiple fatal endpoints after different follow-up periods provide high internal validity of these findings. Furthermore, in the majority of patients, sLOX-1 levels were assessed only at a single time-point (at the time of presentation immediately prior to PCI/CABG), while longitudinal measurements were performed only at two time-points in a small subcohort of ACS patients undergoing serial intravascular ultrasonography. Indeed, we consider the presented data on plaque regression/progression only as hypothesis-generating, as the number of patients included in the respective analysis is rather low. Third, as in any observational study, residual confounding may have affected the results. To minimize this, a step-wise modelling approach was used, with the results presented being controlled for sensitive markers reflecting myocardial injury (centrally measured hs-TnT), systemic inflammation (centrally measured hs-CRP), clinical variables associated with poor outcomes (elevated NT-proBNP levels, history of hypercholesterolaemia, age, diabetes, LDL-C, indices of renal function, type of ACS, and sex) and the externally validated and broadly used GRACE 2.0 score. Finally, no external validation was performed, which is a significant limitation of the current study. Yet, established internal validation strategies confirmed the independent association of sLOX-1 with each fatal endpoint, as reported by us previously,44 with the data presented herein being in line with previously conducted pilot studies.46,65,66
Conclusions
Plasma levels of sLOX-1 are increased during ACS, particularly in patients with STEMI, and predict fatal events at 1 year beyond both traditional and established risk factors, and beyond GRACE 2.0. Persistently high plasma levels of sLOX-1 after ACS associate with coronary plaque progression in patients receiving lipid-lowering therapy. Soluble LOX-1 is a novel and independent biomarker for fatal events in patients presenting with ACS, and longitudinal changes of plasma sLOX-1 represent a surrogate of plaque dynamics in patients with established ASCVD. Additional prospective studies are warranted to confirm the independent association of sLOX-1 with adverse outcomes following ACS.
Authors' contribution
S.K., A.A., and T.F.L. conceived the study; S.K., F.A.W., and G.G. gathered and analysed the data; S.K. and F.A.W. wrote the manuscript. All the authors vouch for the data and analyses reported. All co-authors revisited the work critically for important intellectual content and approved the version to be published, and agreed to be accountable for all aspects of the work in ensuring that questions related to the integrity of any part of the work presented are appropriately investigated and resolved.
Supplementary material
Supplementary material is available at European Heart Journal online.
Acknowledgements
We acknowledge the enormous work that has been devoted to the development and maintenance of the national register this study is based on. We want to thank all clinicians, administrative personnel, and data managers for making this study possible. In particular, we sincerely thank the independent event adjudication committee chaired by Matthias Pfisterer, Lukas Kappenberger, Tiziano Moccetti, Philippe Meyer, Pascal Meier, Juan F. Iglesias, and Fabio Rigamonti as members. Furthermore, we thank the Blood Donation Center Zurich (Schlieren, Zurich, Switzerland) for providing blood samples of healthy subjects who served as additional controls in the current study. We are grateful to Carola Kälin-Weeke, Isabelle Peereboom, and Monika Seiler for coordinating and supervising the analytical studies in the core laboratory. Also, we thank the local study nurses, the core lab technicians, the central data monitors, in particular Nicole Piller, Torsten Illmann, and Gunter Antoneag for supervising the electronic data capturing system (Webspirit Systems GmbH, Ulm, Germany), and finally all the members of the local catheter teams for their invaluable work.
Funding
This work was supported by the Swiss National Science Foundation (SPUM 33CM30-124112 and 32473B_163271), the Swiss Heart Foundation (both to T.F.L.), the Theodor-Ida Herzog Stiftung (to S.K.), and the Foundation for Cardiovascular Research–Zurich Heart House (T.F.L., S.K., A.A., G.G.C.). The SPUM consortium was further supported by Roche Diagnostics (Boehringer Mannheim, Indianapolis, IN, USA), Eli Lilly (Indianapolis, IN, USA), AstraZeneca (Baar, ZG, Switzerland), Medtronic (Münchenbuchsee, BE, Switzerland), MSD Merck Sharpe and Dome (Lucerne, LU, Switzerland), Sanofi-Aventis (Vernier, GE, Switzerland), and St Jude Medical AG (Zurich, ZH, Switzerland).
Conflict of interest: T.F.L. has no conflicts of interest related to this manuscript, but has received educational and research grants from Amgen, AstraZeneca, Daiichi-Sankyo, and Sanofi related to lipids, but not to LOX-1. Outside these fields, he has also received grants from Abbott, Ablative Solutions, Boehringer Ingelheim, Novartis, Servier, and Vifor. The hs-CRP, hs-TnT, and NT-proBNP assays reported in this study were kindly provided by Roche Diagnostics (Boehringer Mannheim, Indianapolis, IN, USA). G.G.C. and L.L. are co-inventors on the international patent WO/2020/226993 filed in April 2020. The patent relates to the use of antibodies which specifically bind IL-1α to reduce various sequelae of ischaemia–reperfusion injury to the central nervous system. G.G.C. is a consultant to Sovida solutions limited. L.L. reports speaker fees outside of this work from Daiichi-Sankyo. S.L. is employed by CTU Bern, which is involved in design, conduct, or analysis of clinical studies funded by not-for-profit and for-profit organizations. In particular, pharmaceutical and medical device companies provide direct funding to some of these studies. The other authors report no conflicts of interest.
References
Author notes
These authors contributed equally to the study.
These authors jointly directed the study.

