


Abstract
Pre-operatively diagnosed patent foramen ovale (PFO) is associated with an increased risk of ischaemic stroke within 30 days after surgery. This study aimed to assess the PFO-attributable ischaemic stroke risk beyond the perioperative period.
This observational study of adult patients without history of stroke undergoing non-cardiac surgery with general anaesthesia examined the association of PFO with ischaemic stroke 1 and 2 years after surgery using multivariable logistic regression. Of the 144 563 patients included, a total of 1642 (1.1%) and 2376 (1.6%) ischaemic strokes occurred within 1 and 2 years after surgery, 54 (4.7%) and 76 (6.6%) among patients with PFO, and 1588 (1.1%) and 2300 (1.6%) among patients without PFO, respectively. The odds of ischaemic stroke within 1 and 2 years after surgery were increased in patients with PFO: adjusted odds ratio (aOR) 2.01, 95% confidence interval (CI) 1.51–2.69; P < 0.001 and aOR 2.10, 95% CI 1.64–2.68; P < 0.001, respectively. Among patients who underwent contrast transoesophageal echocardiography, the frequency of PFO was 27%, and the increased stroke risk in patients with PFO was robust (aOR 3.80, 95% CI 1.76–8.23; P = 0.001 for year 1). The PFO-attributable risk was mitigated by post-operative prescription of combination antithrombotic therapy (odds ratio 0.41, 95% CI 0.22–0.75; P for interaction = 0.004).
Patients with PFO are vulnerable to ischaemic stroke for an extended period of time after surgery. Physicians should consider implementing PFO screening protocols in patients scheduled for major non-cardiac surgery.
See page 925 for the editorial comment on this article (doi: )
Introduction
Patent foramen ovale (PFO) is an anatomical anomaly present in up to a quarter of the general population and is associated with an increased risk of stroke.1–3 With increasing evidence that PFO closure decreases the risk of recurrent strokes in patients with cryptogenic stroke,4–7 there is a need to further identify at risk populations, for whom pharmacological or mechanical preventive therapies may be beneficial.
Patients undergoing surgery are at heightened risk of venous thrombosis from factors such as hypercoagulability after withdrawal of antiplatelet and anticoagulant agents, disease-related prothrombotic state, and due to inflammation and immobilization from the surgical procedure itself.8–10 For patients with PFO, venous thrombi may result in ischaemic strokes from paradoxical embolism across the right-to-left shunt. Recently, a large observational study showed that having a pre-operatively diagnosed PFO is associated with an increased risk of perioperative ischaemic stroke within 30 days after surgery.11 From a physiological and clinical point of view, the period of increased vulnerability to stroke after surgery may extend beyond 30 days in certain high-risk patients.12 This may be due to underlying malignancies which necessitated surgery, delayed resumption of antithrombotic therapy, low efficacy of bridging therapy,13 and prolonged post-operative immobilization.14 The long-term stroke risk after surgery and possible preventive strategies have not been studied among patients with PFO. Consequently, guidelines of the European Society of Cardiology (ESC) do not address perioperative management of PFO in patients undergoing non-cardiac surgery.15 , 16
We hypothesized that having a pre-operatively diagnosed PFO is associated with an increased risk of delayed stroke up to 1 and 2 years after surgery. In addition, we evaluated if combination antithrombotic therapy modified the effect of PFO on post-operative stroke risk.
Methods
Study population and design
Surgical cases from three Harvard teaching hospitals between 1 January 2007 and 31 December 2015 were considered for this study. The Partners Institutional Review Board (IRB) approved the study and the need for informed consent was waived (IRB protocol number: 2018P000193).
Patients undergoing surgical procedures with general anaesthesia, intubation at the beginning of the procedure, and immediate post-procedural extubation were eligible. Exclusion criteria were age younger than 18 years, paediatric surgery, cardiac surgery, history of ischaemic stroke prior to surgery, and brain death [i.e. American Society of Anesthesiologists (ASA) physical status classification of six].
Exposure
The exposure was defined as a pre-operative billing diagnosis of PFO according to the International Classification of Diseases, Ninth or Tenth Revision (ICD 9/10) codes: ‘745.5’ and ‘Q21.1’. Patients without the above diagnosis and those who underwent PFO closure before surgery were regarded as not exposed.
Outcomes
Newly diagnosed ischaemic stroke within 1 year after surgery was defined as the primary outcome. The co-primary outcome was newly diagnosed ischaemic stroke within 2 years after surgery. Ischaemic stroke was defined by ICD 9 (‘433.X1’, ‘434.X1’, ‘437.1’, and ‘437.9’) and ICD 10 (‘I63’, ‘I67.81’, ‘I67.89’, and ‘I67.9’) diagnostic codes. The primary outcome was validated by medical record review (see Supplementary material online, Section V.a). To avoid bias due to multiple testing, a hierarchical sequence of the main outcomes with a two-sided α error of 0.05 was pre-specified.17
The subtype of ischaemic stroke by Oxfordshire Community Stroke Project (OCSP) classification18 as well as the recurrence of ischaemic stroke within 2 years after surgery were assessed through review of neurology notes and radiological reports of cerebral computed tomography and magnetic resonance imaging (see Supplementary material online, Section I.a).
Statistical analysis
It has previously been reported that recurrent non-fatal ischaemic stroke was 50% less likely to occur in patients undergoing PFO occlusion compared with patients with medical management.7 Based on this observation, an odds ratio (OR) of 2.0 was defined as a clinically meaningful association between PFO and post-operative ischaemic stroke within 1–2 years after surgery prior to performing any analysis. Under the assumption of an observed PFO rate of 0.8%, an ischaemic stroke event rate of 1.1% within 1 year after surgery, and a one-sided α level of 0.025, a power of 98.3% was achieved to detect a difference in stroke risk between patient groups with the present sample size.
Outcomes and statistical methodology were defined prior to analysis. Categorical variables were tested using χ2 test, continuous variables were tested using Wilcoxon rank-sum or Student’s t-test in crude analyses. If not specified otherwise, unadjusted and multivariable logistic regression analyses were performed.
Multivariable analysis was adjusted for confounders selected a priori based on review of current literature and clinical plausibility. The confounder model included pre-operative patient characteristics such as age, sex, body mass index (BMI, kg/m2), Charlson comorbidity index,19 ASA physical status classification, and history of the following comorbidities based on ICD diagnostic codes: tobacco use, arterial hypertension, diabetes, dyslipidaemia, coronary artery disease, congestive heart failure, cardiomyopathy, congenital heart disease, valvular heart disease, atrial fibrillation (AF), myocardial infarction, pulmonary oedema, pulmonary hypertension, chronic obstructive pulmonary disease, chronic kidney disease, hypercoagulopathy, deep vein thrombosis (DVT), migraine, pulmonary, or systemic embolism. Furthermore, we controlled for history of antiplatelet drugs, anticoagulant agents, beta-blockers, and statins, each defined as prescriptions within 28 days prior to surgery; and surgical parameters such as emergency surgery status, duration of surgery, ambulatory vs. inpatient surgery, work relative value units (work RVU) as marker of the complexity of procedure, and high-risk surgical service20; as well as intraoperative factors including total dose of vasopressors,21 fluid volume, transfused packed red blood cells, and duration of intraoperative hypotension (minutes of mean arterial pressure below 55 mmHg).22 , 23 The definitions of exposure, outcome, and confounder variables based on ICD 9/10 codes are listed in Supplementary material online, Table S1. A detailed description of the data collection is provided in Supplementary material online, Section I.
Baseline and intraoperative characteristics of patients stratified by patients with and without preoperatively diagnosed PFO
| Characteristics | Total study population (n = 144 563) | PFO (n = 1160) | No PFO (n = 143 403) | Standardized difference |
|---|---|---|---|---|
| Pre-operative characteristics | ||||
| Age (years), mean ± SD | 54 ± 16 | 58 ± 16 | 54 ± 16 | 0.234 |
| Female sex, n (%) | 79474 (55.0) | 643 (55.4) | 78831 (55.0) | 0.009 |
| Body mass index, mean ± SD | 28.5 ± 7.1 | 28.15 ± 7 | 28.51 ± 7.1 | 0.051 |
| ASA physical status classificationa, median (IQR) | 2 (2–3) | 3 (2–3) | 2 (2–3) | 0.725 |
| Charlson comorbidity indexb, median (IQR) | 2 (0–3) | 3 (2–8) | 2 (0–3) | 0.552 |
| Smoking, n (%) | 28 539 (19.7) | 300 (25.9) | 28 239 (19.7) | 0.148 |
| Hypertension, No. (%) | 59 561 (41.2) | 702 (60.5) | 58 859 (41.0) | 0.397 |
| Diabetes, n (%) | 19 518 (13.5) | 275 (23.7) | 19 243 (13.4) | 0.267 |
| Dyslipidaemia, n (%) | 45 289 (31.3) | 519 (44.7) | 44 770 (31.2) | 0.281 |
| Coronary artery disease, n (%) | 17 308 (12.0) | 399 (34.4) | 16 909 (11.8) | 0.557 |
| Myocardial infarction, n (%) | 2265 (1.6) | 92 (7.9) | 2173 (1.5) | 0.306 |
| Congestive heart failure, n (%) | 8188 (5.7) | 305 (26.3) | 7883 (5.5) | 0.593 |
| Pulmonary oedema, n (%) | 9051 (6.3) | 269 (23.2) | 8782 (6.1) | 0.497 |
| Pulmonary hypertension, n (%) | 1971 (1.4) | 129 (11.1) | 1842 (1.3) | 0.417 |
| Cardiomyopathy, n (%) | 4360 (3.0) | 177 (15.3) | 4183 (2.9) | 0.440 |
| Congenital heart disease, n (%) | 921 (0.6) | 61 (5.3) | 860 (0.6) | 0.279 |
| Eisenmenger’s syndrome, n (%) | 172 (0.1) | 19 (1.6) | 153 (0.1) | 0.165 |
| Atrial fibrillation, n (%) | 10 856 (7.5) | 317 (27.3) | 10 539 (7.3) | 0.547 |
| Valvular heart disease, n (%) | 13 681 (9.5) | 567 (48.9) | 13 114 (9.1) | 0.974 |
| COPD, n (%) | 10 491 (7.3) | 187 (16.1) | 10 304 (7.2) | 0.281 |
| Transient ischaemic attack, n (%) | 878 (0.6) | 49 (4.2) | 829 (0.6) | 0.240 |
| Migraine, n (%) | 5704 (3.9) | 55 (4.7) | 5649 (3.9) | 0.039 |
| Chronic kidney disease, n (%) | 10 049 (7.0) | 239 (20.6) | 9810 (6.8) | 0.408 |
| Hypercoagulable state, n (%) | 12 760 (8.8) | 253 (21.8) | 12 507 (8.7) | 0.370 |
| Deep vein thrombosis, n (%) | 3461 (2.4) | 90 (7.8) | 3371 (2.4) | 0.249 |
| Pulmonary embolism, n (%) | 2224 (1.5) | 69 (5.9) | 2155 (1.5) | 0.236 |
| Systemic embolic phenomenon, n (%) | 7631 (5.3) | 131 (11.3) | 7500 (5.2) | 0.222 |
| Prescription of medication within 28 days before surgery | ||||
| Anticoagulants, n (%) | 43 534 (30.1) | 558 (48.1) | 42 976 (30.0) | 0.378 |
| Statins, n (%) | 32 197 (22.3) | 405 (34.9) | 31 792 (22.2) | 0.285 |
| Antiplatelet drugs, n (%) | 15 551 (10.8) | 287 (24.7) | 15 264 (10.6) | 0.376 |
| Beta blockers, n (%) | 18 216 (12.6) | 322 (27.8) | 17 894 (12.5) | 0.388 |
| Intraoperative characteristics | ||||
| Emergency procedure, n (%) | 5684 (3.9) | 68 (5.9) | 5616 (3.9) | 0.090 |
| High risk procedurec, n (%) | 56 755 (39.3) | 536 (46.2) | 56 219 (39.2) | 0.142 |
| Inpatient procedure, n (%) | 106 970 (74.0) | 1040 (89.7) | 105 930 (73.9) | 0.418 |
| Work relative value unitsd, median (IQR) | 14.5 (8.1–22) | 15 (8.2–22.7) | 14.5 (8.1–22) | 0.124 |
| Duration of procedure in minutes, median (IQR) | 144 (92–227) | 159 (100–264) | 144 (91–227) | 0.196 |
| Intraoperative hypotensive minutes MAP <55 mmHg, median (IQR) | 0 (0–2) | 0 (0–2) | 0 (0–2) | 0.124 |
| Total intraoperative norepinephrine equivalent dose in mg, median (IQR) | 0.02 (0–0.19) | 0.10 (0–0.42) | 0.02 (0–0.19) | 0.398 |
| Total intraoperative fluids in mL, median (IQR) | 1250 (800–2000) | 1250 (750–2300) | 1250 (800–2000) | 0.240 |
| Packed red blood cell units transfused intraoperatively, n (%) | 4891 (3.4) | 80 (6.9) | 4811 (3.4) | 0.161 |
ASA, American Society of Anesthesiologists; COPD, chronic obstructive pulmonary disease; IQR, interquartile range; MAP, mean arterial pressure; SD, standard deviation.
Evaluates patient’s health status before undergoing anaesthesia, six categories ranging from ASA I (normal healthy patient) to ASA VI (patient with brain death).
Classifies a patient’s comorbidity status by scoring the risk of death based on 22 comorbid diseases with assigned scores of 1, 2, 3, or 6.
General surgery, neurosurgery, surgery for burns, thoracic surgery, vascular surgery, and transplant surgery.
Work relative value units measure the value of physician services and are an indicator of the procedural complexity.
Using forced variable entry, the primary regression model for post-operative ischaemic stroke was applied and model discrimination and calibration were evaluated to ensure conventional interpretation of the estimates. The linearity assumption was tested for all continuous variables in the primary regression model. In case of non-linearity, variables were divided into equally-sized quintiles (see Supplementary material online, Section II).
Secondary analysis: pre-defined interaction analyses
The hypothesis that post-operative prescription of antithrombotic medications within 1 year after surgery modifies the association between PFO and stroke was evaluated. Post-operative antithrombotic therapy was defined in three categories: (i) single antiplatelet agent, (ii) oral anticoagulation therapy, and (iii) combination therapy—either dual antiplatelet therapy or combination of an antiplatelet agent and oral anticoagulant. Considering that ‘PFO × antiplatelet therapy groups’ are likely to have different multivariate distributions of the factors associated with the indication for antiplatelet therapy, a propensity score to predict the likelihood of receiving an antiplatelet prescription within 1 year after surgery was built. Subsequently, propensity score stratification and inverse probability of treatment weighting were used to examine these varying factors and ensure conservative interpretation of the interaction analyses.
Since new onset perioperative AF has been shown to be associated with an increased long-term stroke risk after surgery,12 the effect of PFO on long-term stroke after surgery was tested for modification by post-operative new onset AF. Furthermore, the hypothesis that a DVT occurring within 1 year after surgery modifies the effects of PFO on long-term stroke was examined.
Patients suffering from malignant diseases are at increased risk of thromboembolic complications.24 Therefore, effect modification of the PFO-stroke relationship by malignancy within 1 year prior to surgery was evaluated.
For details on interaction analyses, see Supplementary material online, Section IV.
Sensitivity analyses
Several a priori defined sensitivity analyses were performed to evaluate the underlying assumptions and test the robustness of the main findings.
Adjusted Cox regression analysis was used to test the association between pre-operatively diagnosed PFO and ischaemic stroke within 1 and 2 years after the index surgery. Accounting for the competing risks of 1-or 2-year mortality, as well as absence of follow-up exams within the healthcare network studied, patients were censored at the time of death or when they were lost to follow-up. The proportional hazards assumption was tested before conducting Cox regression analysis.
Subgroup analyses were conducted to examine the risk of ischaemic stroke with regards to the PFO status in specific post-operative timeframes: (i) between post-operative days 31 and 365 and (ii) in the second year after surgery. To account for unrecorded post-operative stroke due to missing follow-up data, subgroup analysis was performed in patients with medical records available for a minimum of 2 years after surgery.
A propensity score to estimate the probability of diagnosed PFO was calculated using logistic regression analysis, and the primary hypothesis was re-examined in a propensity matched cohort (see Supplementary material online, Section V.b). To further address potential workup bias, the relationship of PFO and long-term stroke risk after surgery was re-examined in patients who underwent transoesophageal echocardiography (TOE) with injection of agitated saline (‘bubble study’).
Characteristics reflecting surgical complexity such as duration of surgery, work RVU, high-risk surgical service, total dose of vasopressors, duration of intraoperative hypotension, intraoperative fluid volume, and packed red blood cell transfusion were previously shown to affect both short- and long-term outcomes after surgery and were therefore, included in the primary confounder model.25–28 Sensitivity analyses were performed to examine the effect of changes in risk factors with increasing time from surgery on the PFO-stroke association (see Supplementary material online, Section V.e).
Falsification testing was performed in order to ensure the primary finding was not caused by underlying effects unrelated to our hypothesis. Two additional outcomes occurring within 1 year after surgery that are theoretically not related to the pathophysiological relationship between PFO and ischaemic stroke, but have an aetiology of non-thrombotic ischaemic tissue injury were examined: peptic ulcer disease and surgical wound complication.
Exploratory analyses
The association of PFO and the following stroke subtypes was tested using multinomial logistic regression analysis: large-vessel territorial infarct including total anterior, partial anterior and posterior circulation, as well as lacunar infarct and unclassifiable cerebral ischaemia. Results were reported as relative risk ratios.
The occurrence of repeat ischaemic stroke within 2 years after surgery following first ischaemic stroke in post-operative year one was compared using unadjusted logistic regression. The proportion of patients receiving combination antithrombotic therapy among the entire study cohort and patients with recurrent stroke were compared (see Supplementary material online, Section IV.b).
Due to the higher comorbidity burden among patients with pre-operatively diagnosed PFO, differences in surveillance within Partners HealthCare network in the 2 years after surgery was assessed, and added to the primary confounder model in exploratory analysis.
Patients with documented PFO closure before surgery were regarded as not exposed in the main analysis. In an exploratory analysis, the risk of post-operative ischaemic stroke within 1 year after surgery was compared among patients with closed PFO and patients without PFO using the primary regression model.
Additional analyses are described in the Supplementary material online. Data were managed and analysed using STATA software, version 13 (StataCorp LP) and R Studio software, version 3.2.5 (R Foundation for Statistical Computing). Statistical significance was achieved at a two-tailed P-value of less than 0.05.
Results
Study cohort and characteristics
A total of 182 393 patients underwent surgery with general anaesthesia, immediate pre-operative intubation, and post-operative extubation at one of three Harvard teaching hospitals between January 2007 and December 2015. After applying the exclusion criteria, 161 996 patients were considered eligible for analysis. A total of 17 433 cases (10.8%) had missing data for the exposure, main outcomes, or covariates. The complete case cohort included 144 563 cases (Figure 1).
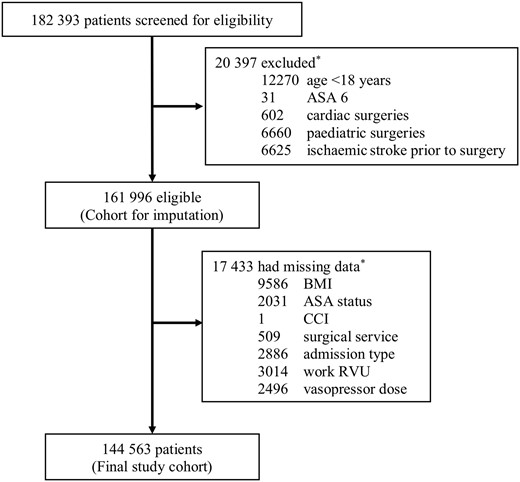
Study flow. *Individual patients could meet more than one reason. ASA status, American Society of Anesthesiologists physical classification; BMI, body mass index; CCI, Charlson comorbidity index; Work RVU, work relative value units.
A total of 1160 (0.8%) patients included in the analysis had a PFO diagnosed prior to surgery. Patient and intraoperative characteristics of the study cohort are shown in Table 1 and described in Supplementary material online, Section III.
Main outcomes
A total of 1642 (1.1%) ischaemic strokes occurred within 1 year after surgery, 54 (4.7%) among patients with PFO and 1588 (1.1%) among patients without PFO. Having a pre-operatively diagnosed PFO was associated with an increased risk of ischaemic stroke within 1 year after surgery in both crude [unadjusted odds ratio (OR) 4.36, 95% confidence interval (CI) 3.30–5.76; P < 0.001], and adjusted analysis [adjusted odds ratio (aOR) 2.01, 95% CI 1.51–2.69; P < 0.001], respectively.
Tested in pre-specified sequence, ischaemic stroke within 2 years after surgery was significantly increased among patients with PFO [76/1160 (6.6%) vs. 2300/143 403 (1.6%); unadjusted OR 4.30, 95% CI 3.40–5.45; P < 0.001; aOR 2.10, 95% CI 1.64–2.68; P < 0.001]. Despite a lower observed ischaemic stroke incidence in the second year compared with the first year after surgery, the PFO-attributable risk remained significant (Figure 2, Table 2).
Main results: the association of pre-operatively diagnosed PFO and ischaemic stroke up to 2 years after non-cardiac surgery
| Definition of outcome | PFO (n = 1160) | No PFO (n = 143 403) | Absolute risk difference, % (95% CI) | Adjusted absolute risk difference, % (95% CI) | Odds ratio (95% confidence interval) | |||||
|---|---|---|---|---|---|---|---|---|---|---|
| n (%) | Estimated probability, % (95% CI) | n (%) | Estimated probability, % (95% CI) | Unadjusted | Adjusted | |||||
| Co-primary outcomes | ||||||||||
| New ischaemic stroke within 1 year after surgery | 54 (4.7) | 1.3 (1.0–1.7) | 1588 (1.1) | 0.7 (0.6–0.7) | 3.5 (2.3–4.8) | 0.7 (0.3–1.1) | 4.36 (3.3–5.76) | P < 0.001 | 2.01 (1.51–2.69) | P < 0.001 |
| New ischaemic stroke within 2 years after surgery | 76 (6.6) | 2.1 (1.6–2.6) | 2300 (1.6) | 1.0 (0.9–1.1) | 4.9 (3.5–6.4) | 1.1 (0.6–1.6) | 4.3 (3.4–5.45) | P < 0.001 | 2.1 (1.64–2.68) | P < 0.001 |
| Sensitivity analysis | ||||||||||
| New ischaemic stroke between post-operative day 31 and 365 (n = 143 265) | 40 of 1129 (3.4) | 1.0 (0.6–1.3) | 1107 of 142 136 (0.8) | 0.5 (0.4–0.5) | 2.8 (1.7–3.8) | 0.5 (0.2–0.8) | 4.68 (3.39–6.45) | P < 0.001 | 2.11 (1.51–2.95) | P < 0.001 |
| New ischaemic stroke within the second year after surgery (n = 137 418) | 22 of 991 (2.2) | 0.7 (0.4–1.0) | 712 of 136 427 (0.5) | 0.3 (0.26–0.33) | 1.7 (0.8–2.6) | 0.4 (0.1–0.7) | 4.33 (2.82–6.65) | P < 0.001 | 2.3 (1.47–3.58) | P < 0.001 |
| Falsification analysis (within 1 year after surgery) | ||||||||||
| Peptic ulcer disease | 28 (2.4) | 0.7 (0.4–1.0) | 1397 (1.0) | 0.6 (0.6–0.7) | 1.4 (0.6–1.3) | 0.1 (−0.2 to 0.4) | 2.51 (1.72–3.67) | P < 0.001 | 1.14 (0.77–1.69) | P = 0.51 |
| Wound complication | 133 (11.5) | 5.5 (4.5–6.5) | 11 292 (7.9) | 6.2 (6.1–6.3) | 3.6 (1.8–5.4) | −0.7 (−1.7 to 0.3) | 1.52 (1.26–1.82) | P < 0.001 | 0.88 (0.73–1.07) | P = 0.20 |
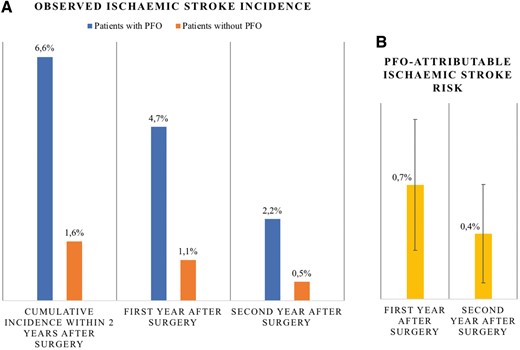
Trend of ischaemic stroke risk across 2 years after surgery. (A) Observed ischaemic stroke incidence (%) is higher among patients with PFO (blue) compared with patients without PFO (orange) and higher within first (middle) compared with second year after surgery (right). (B) Long-term stroke risk attributable to PFO (adjusted absolute risk difference, yellow) is higher within the first compared with the second year after surgery. Error bars are 95% confidence intervals. PFO-attributable stroke risk is significant within first and second year after surgery.
Secondary analysis: pre-defined interaction analyses
The use of antithrombotic therapy may decrease the risk of ischaemic stroke. Details on the use of antiplatelet therapy in the first year after surgery are shown in Supplementary material online, Table S2 A. Neither the post-operative use of a single antiplatelet agent nor use of oral anticoagulation therapy by itself modified the risk of ischaemic stroke within 1 year after surgery among patients with PFO (interaction terms ‘PFO × post-operative prescription of single antiplatelet agent within 1 year after surgery’: P for interaction = 0.65; and ‘PFO × post-operative prescription of oral anticoagulation therapy within 1 year after surgery’: P for interaction = 0.91). Combination antithrombotic therapy mitigated the long-term risk of post-operative ischaemic stroke attributable to PFO (interaction term ‘PFO × post-operative prescription of combination antithrombotic therapy within 1 year after surgery’: OR 0.41, 95% CI 0.22–0.75; P for interaction = 0.004). The PFO-attributable risk was 0.4% among patients receiving dual antiplatelet therapy or a combination of an antiplatelet agent and oral anticoagulation, and 1.0% among patients not receiving such combination antithrombotic therapy. Close examination of the multivariate distributions of the factors associated with the indication for antiplatelet therapy confirmed these results (see Supplementary material online, Section IV.b).
Having new onset AF within 1 year after surgery did not modify the association of PFO and long-term post-operative stroke risk (P for interaction = 0.12). Similarly, occurrence of a DVT within 1 year after surgery did not significantly modify the PFO-stroke relationship (P for interaction = 0.19).
A total of 53 802 patients (37.2%) had an active diagnosis of malignancy in the year prior to surgery. The risk of ischaemic stroke within 1 year after surgery, attributable to PFO, was higher among patients with malignancy (0.9%) compared with patients without malignancy (0.4%) (P for interaction = 0.066).
Evaluation of the primary regression model
The underlying assumptions of the primary multivariable model and the model fit were examined. The model had an area under the receiver operating characteristic curve of 0.79 (see Supplementary material online, Figure S1a). The primary regression model had a good resolution (insert in Supplementary material online, Figure S1a) and was well-calibrated (see Supplementary material online, Figure S1b).
Sensitivity analyses
The proportional hazards assumption was met and the primary findings from multivariable logistic regression were confirmed in adjusted Cox regression analyses accounting for the competing risks of 1- or 2-year mortality, as well as absence of follow-up data within the healthcare network studied [stroke within 1 year after surgery—hazard ratio (HR) 1.92, 95% CI 1.45–2.53; P < 0.001]; stroke within 2 years after surgery—HR 2.00, 95% CI 1.58–2.52; P < 0.001) (see Supplementary material online, Table S3). A total of 2856 patients were excluded from these analyses due to death on the day of surgery, or non-existing post-operative follow-up records as of post-operative day one. Figure 3 A shows an adjusted time-to-event plot.
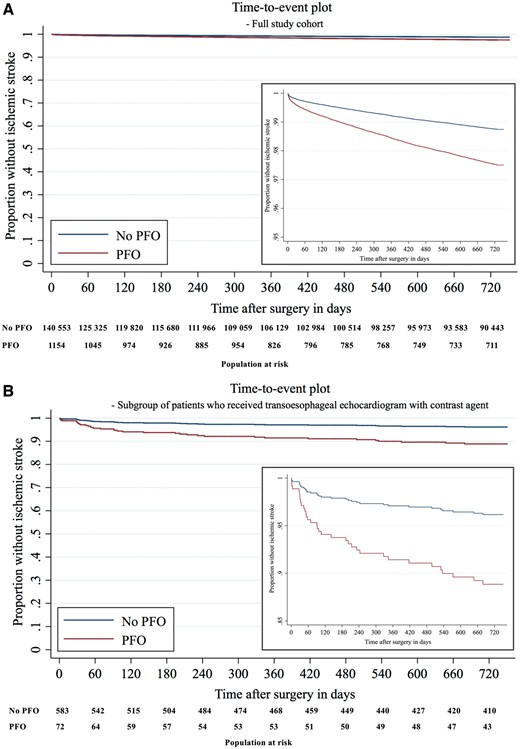
Time-to-event plot. (A) Time-to-event plot in full study cohort. (B) Time-to-event plot in subgroup of 658 patients who received transoesophageal echocardiogram with contrast agent. Time-to-event plots show survivor function for patients with PFO (red) and without PFO (blue). It was estimated after multivariable Cox regression analysis for ischaemic stroke within 2 years after surgery, censoring patients at time of death or when they were lost to follow up. The population at risk with and without PFO is shown in 60-day intervals.
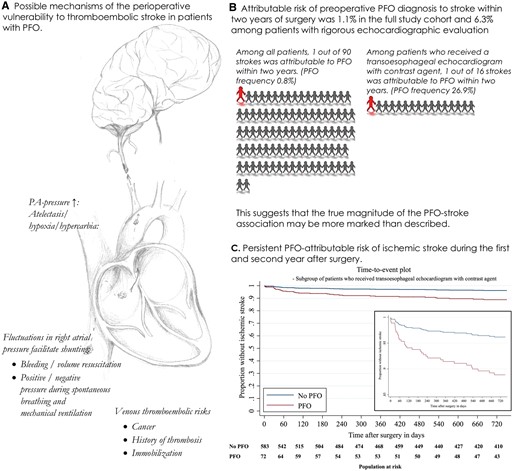
(A) Mechanisms of perioperative thromboembolic stroke in patients with PFO. (B) PFO-attributable risks of stroke within 2 years in the full study cohort and the cohort which received a transoesophageal echocardiogram with contrast agent. (C) Time-to-event plot for patients with PFO (red) and without PFO (blue) in subgroup of 658 patients who received a TOE with contrast agent (see Figure 3B).
The association between PFO and increased long-term risk of ischaemic stroke was maintained when only newly diagnosed ischaemic strokes occurring between post-operative days 31 and 365, or occurring in the second year after surgery were considered, excluding patients who died or experienced a stroke between index surgery and the respective analysed time frame (Table 2).
Further, the main findings remained consistent in a subgroup of 92 077 (63.7%) patients with follow-up records for a minimum of 2 years after surgery within Partners HealthCare network (see Supplementary material online, Section V.h, Table S3).
A total of 1156 (99.6%) of the 1160 cases with PFO were successfully matched based on their propensity for an incidentally diagnosed PFO. In the final 1:5 matched cohort (see Supplementary material online, Table S4), PFO was associated with an increased risk of stroke within 1 year after surgery [54/1156 (4.7%) vs. 126/5771 (2.2%); aOR 2.20, 95% CI 1.57–3.02; P < 0.001].
Among patients who underwent TOE with agitated saline contrast (n = 658), the frequency of PFO was 26.9%, which is comparable to the prevalence of PFO in post-mortem studies.29 The effect size of the association between PFO and ischaemic stroke 1 year [16/177 (9.0%) vs. 12/481 (2.5%); aOR 3.80, 95% CI 1.76–8.23; P = 0.001; PFO-attributable risk 6.2%, 95% CI 1.9–10.6%] and 2 years after surgery [18/177 (10.2%) vs. 16/481 (3.5%); aOR 3.02, 95% CI 1.52–6.02; P = 0.002; PFO-attributable risk 6.3%, 95% CI 1.7–10.9%] was increased in this subgroup (see Supplementary material online, Section V.c, Table S3). These findings remained consistent in adjusted Cox regression analysis (Figure 3 B, Supplementary material online, Table S3).
The frequency of first ischaemic stroke stratified by surgical service and PFO status is shown in Supplementary material online, Table S5. The primary association remained robust in different regression models reflecting changes in risk factors with increasing time from surgery (see Supplementary material online, Section V.e).
In falsification analyses, having a PFO was not significantly associated with peptic ulcer disease [28/1160 (2.4%) vs. 1397/143 403 (1.0%); aOR 1.14, 95% CI 0.77–1.69; P = 0.51] or wound complication [133/1160 (11.5%) vs. 11 292/143 403 (7.9%); aOR 0.88, 95% CI 0.73–1.07; P = 0.20] within 1 year after surgery (Table 2).
Exploratory analyses
PFO was significantly associated with large-vessel territory infarct within 1 year after surgery [16 (1.4%) vs. 388 (0.3%); adjusted relative risk ratio 2.59, 95% CI 1.54–4.37; P < 0.001], while not being associated with lacunar stroke [1 (0.1%) vs. 77 (0.5%); unadjusted relative risk ratio 1.63, 95% CI 0.23–11.72; P = 0.63]. Detailed results of analyses related to ischaemic stroke subtype are shown in Supplementary material online, Table S6.
There was no significant difference in risk of recurrent ischaemic stroke within 2 years after surgery between patients with and without PFO (9.5% vs. 11%; unadjusted OR 0.85, 95% CI 0.19–3.74; P = 0.83). A significantly higher proportion of patients with recurrent stroke (57.1%) compared with the entire study cohort (7.2%) received combination antithrombotic therapy in the year after surgery.
The unique association between PFO and long-term stroke risk after surgery remained robust when adding the days with institutional health care surveillance to the confounder model (see Supplementary material online, Section VI.c).
A total of 131 patients had a history of PFO closure. Among these patients, 13% had a history of transient ischemic attack (TIA), compared with 6.6% among patients with PFO but no documented closure, and 1.1% among patients without PFO. Based on medical record review, there was no significant PFO-attributable risk of post-operative ischaemic stroke within 1 year after surgery among patients with closed PFO compared with patients without PFO [1/131 (0.8%) vs. 617/143 272 (0.4%); aOR 0.97, 95% CI 0.13–7.20; P = 0.97; adjusted absolute risk difference −0.01%, 95% CI −0.5–0.5%].
Discussion
In this cohort comprising 144 563 patients who underwent non-cardiac surgery, a pre-operatively diagnosed PFO was associated with a substantial increase in ischaemic stroke risk during the first and second year after surgery compared with patients without diagnosed PFO. After adjustment for risk factors of post-operative ischaemic stroke and numerous sensitivity analyses including Cox regression accounting for the competing risks of mortality and loss to follow-up, the association between PFO and delayed post-operative stroke remained to be clinically meaningful. The calculated effect size was numerically greater in a subcohort of patients who received a rigorous echocardiography evaluation (contrast TOE with agitated saline), which suggests that the true magnitude of the PFO-stroke association may be more marked than described (PFO-attributable stroke risk: 6.3% vs. 1.1% in full study cohort) (see Take home figure). The long-term ischaemic stroke risk attributable to PFO was significantly reduced among patients who received a post-operative prescription of combined antithrombotic therapy, and not apparent among patients with PFO closed before surgery.
It is well established that patients undergoing surgery are at increased risk of ischaemic stroke in the perioperative period.30 , 31 However, few studies have examined the long-term association of surgery and ischaemic stroke beyond the early post-operative period, especially in the general surgical population. Based on an administrative data registry of more than 1 700 000 patients, the post-operative cumulative stroke rate at 1 year was 0.4–1.5% among patients undergoing non-cardiac surgery.12 In a German public health registry, the risk of cerebrovascular events within the first 90 days after non-carotid and non-cardiothoracic surgery was significantly higher than in post-procedural days 91–365.32 In the current study including patients undergoing non-cardiac surgery with general anaesthesia, the overall risk of stroke was 1.1% in the first year, and 1.6% in the first 2 years after surgery, thereby confirming a high incidence of stroke in the post-operative period, irrespective of PFO. We conclude based on our findings and the observations of others,12 , 32 that patients after surgery represent a high-risk phenotype, vulnerable to thromboembolic complications, and speculate this may be due to persistent inflammation and immobility. This mechanistic hypothesis is supported by our finding that the PFO-attributable risk of ischaemic stroke, likely promoted by paradoxical embolism, during the first year after surgery was higher among patients carrying a cancer diagnosis compared with patients without (0.9% vs. 0.4%; P for interaction = 0.066). Patients with cancer are at increased risk of thromboembolic complications,24 which may have magnified the PFO-attributable risk of stroke, likely promoted by paradoxical embolism. In addition, post-operative survivors of major surgery and critical illness are frequently left with a legacy of long-term physical and neuropsychiatric impairment.33 , 34 The functional disability and resulting immobilization may also be a contributing factor of the observed, persistent association between PFO and ischaemic stroke beyond the immediate post-operative period.
In our study, we observed that patients with PFO were at increased risk of large-vessel territory stroke (a composite of total anterior, partial anterior and posterior circulation ischaemia) up to 1 year after surgery compared with patients without PFO (aOR 2.59, 95% CI 1.54–4.37). On the contrary, a pre-operatively diagnosed PFO was not significantly associated with an increased risk of lacunar cerebral ischaemia. These findings support the potential pathophysiological link of paradoxical embolism between PFO and post-operative stroke in our cohort, since the mean diameter of a PFO allows passage of emboli of sufficient size to induce large-vessel territorial infarcts.35 In fact, cryptogenic strokes in patients with known PFO are typically large, cortical, and radiologically apparent.36
Patent foramen ovale is a known risk factor of cryptogenic stroke,37 and a pre-operative diagnosis of PFO is associated with ischaemic stroke within 30 days after non-cardiac surgery,11 generating discussion in exploring preventive treatments.38 We observed a persistently increased PFO-attributable risk of ischaemic stroke for an extended period of up to 2 years after surgery, and conclude that the population with PFO undergoing non-cardiac surgery carries a high PFO-related stroke risk even independently of the surgical procedure. Based on our observation of the persistent increase in PFO-attributable risk of ischaemic stroke after surgery, we propose current recommendations for perioperative stroke prevention in PFO patients be revisited. Echocardiography is considered a key element in the pre-operative assessment of high-risk surgical populations.16 The guidelines for cardiovascular assessment and management in non-cardiac surgery from the Joint Task Force of the ESC and European Society of Anaesthesiology state that patients with symptoms suggestive of TIA or stroke within six months preceding non-cardiac surgery should undergo pre-operative neurological consultation including neurovascular imaging, as appropriate.16 Based on our data, cardiologists may consider implementing a pre-operative screening protocol for PFO, particularly in patients with malignancy, venous thromboembolism, or migraine with aura undergoing high-risk surgical procedures.39
In the current study, dual antiplatelet therapy or combination therapy of an antiplatelet agent with oral anticoagulation significantly mitigated the PFO-stroke association. The finding that both were effective in reducing the risk of perioperative ischaemic stroke is in line with previous meta-analysis, which showed absence of a significant difference between the effectiveness of oral anticoagulation and antiplatelet therapy for secondary stroke prevention in patients with PFO.40
Furthermore, recent randomized controlled trials have demonstrated the effectiveness of PFO closure in certain patients with a history of cryptogenic stroke.4–7 Patients already planned for PFO closure should time their closure procedure prior to rather than after an elective surgery, as there are data showing that PFO closure combined with antiplatelet therapy is associated with lower risks of recurrent stroke than antiplatelet therapy alone.5 , 6 Notably, the increased risk of post-operative ischaemic stroke was abolished among patients with documented PFO closure in our study. We suggest that physicians consider expanding the indication for pre-operative PFO closure beyond the population already deemed at increased risk of perioperative ischaemic stroke.41
Utilization of antithrombotic therapy for an extended period of time after surgery may be a reasonable alternative preventive strategy. In fact, the preventive effect against paradoxical embolism provided by combination antithrombotic therapy may not be significantly inferior to PFO closure,42 although possibly at the expense of unfavourable consequences such as bleeding.43
Future studies are required to further risk stratify patients with PFO undergoing surgery, and to examine if a multimodal approach to preventing thromboembolism such as enforcing early mobilization may be effective in reducing the incidence of post-operative ischaemic stroke.
Limitations
This study has limitations. First, administrative data are susceptible to misclassification and may bear risks of unrecognized bias and confounding. However, validation of the occurrence of ischaemic stroke within 1 year after surgery via medical chart review confirmed the association of PFO and increased long-term stroke risk after surgery. Second, the lack of systematic pre-operative screening for PFO resulted in a prevalence of 0.8%, much lower than the approximately 25% reported in other cohorts.2 , 3 The presence of undiagnosed PFO in up to 25% of patients in the control group is likely to have blunted the true PFO-stroke association. Third, the indication for PFO-detecting examinations might be insufficiently controlled for in multivariable analysis. Yet, a sensitivity analysis in patients with adequate pre-operative diagnostic workup for diagnosing PFO (contrast TOE) demonstrated a PFO prevalence consistent with studies in the general population and the association of PFO with ischaemic stroke within 1 year after surgery remained robust. Fourth, examining effect modification is difficult in this setting given that the relationship between PFO and antiplatelet therapy likely expresses different multivariate distributions of the factors associated with the indication for antiplatelet therapy. Several studies have demonstrated that under such conditions, the statistical methods used to adjust the effect modification for these differing patterns of confounders can produce very different results.44 , 45 To address this issue, different statistical approaches were used: a multivariable model, propensity score stratification, and inverse probability of treatment weighting; and these analyses provided very similar effect estimates for the effect modification by combined antithrombotic therapy. As such, we hypothesize that combined antithrombotic therapies are worth of further study in reducing stroke risk in surgical patients with PFO.
Conclusion
Patients with a pre-operatively diagnosed PFO are vulnerable to newly diagnosed ischaemic stroke for an extended period of time after surgery. Future studies should examine the long-term effectiveness of stroke prevention measures in patients with PFO recovering from surgery.
Acknowledgements
Essential non-author contributions (collaborator/writing committee) were made by Paul Rostin, Dana Raub, Nishan Rajaratnam, Khushi Chhangani, Maria Patrocínio MD, Charlotte Lukannek, Myles D. Boone MD, Bijan Teja MD and Denys Shaydenfish.
Funding
This work was supported by philanthropic donation from Jeff and Judy Buzen, Boston, MA, USA.
Conflict of interest: B.S. discloses the following relationships—National Institutes of Health, NIGMS (PI), Mallinckrodt pharmaceuticals, DL Biotech, Edward LifeSciences. D.L.B. discloses the following relationships—Advisory Board: Cardax, Elsevier Practice Update Cardiology, Medscape Cardiology, Regado Biosciences; Board of Directors: Boston VA Research Institute, Society of Cardiovascular Patient Care; Chair: American Heart Association Quality Oversight Committee; Data Monitoring Committees: Cleveland Clinic, Duke Clinical Research Institute, Harvard Clinical Research Institute, Mayo Clinic, Mount Sinai School of Medicine, Population Health Research Institute; Honoraria: American College of Cardiology (Senior Associate Editor, Clinical Trials and News, ACC.org; Vice-Chair, ACC Accreditation Committee), Belvoir Publications (Editor in Chief, Harvard Heart Letter), Duke Clinical Research Institute (clinical trial steering committees), Harvard Clinical Research Institute (clinical trial steering committee), HMP Communications (Editor in Chief, Journal of Invasive Cardiology), Journal of the American College of Cardiology (Guest Editor; Associate Editor), Population Health Research Institute (clinical trial steering committee), Slack Publications (Chief Medical Editor, Cardiology Today’s Intervention), Society of Cardiovascular Patient Care (Secretary/Treasurer), WebMD (CME steering committees); Other: Clinical Cardiology (Deputy Editor), NCDR-ACTION Registry Steering Committee (Chair), VA CART Research and Publications Committee (Chair); Research Funding: Abbott, Amarin, Amgen, AstraZeneca, Bristol-Myers Squibb, Chiesi, Eisai, Ethicon, Forest Laboratories, Ironwood, Ischemix, Lilly, Medtronic, Pfizer, Roche, Sanofi Aventis, The Medicines Company; Royalties: Elsevier (Editor, Cardiovascular Intervention: A Companion to Braunwald’s Heart Disease); Site Co-Investigator: Biotronik, Boston Scientific, St. Jude Medical (now Abbott); Trustee: American College of Cardiology; Unfunded Research: FlowCo, Merck, PLx Pharma, Takeda. T.T.H. reports grants from NINDS (PI), grants from NIGMS, personal fees from Headache, personal fees from Anesthesiology, personal fees from Cephalagia, outside the submitted work. M.E. received funding for investigator-initiated trials from Merck, and received honorarium for giving advice to Merck; he holds equity of Calabash Bioscience Inc., and received funding from Jeffrey and Judith Buzen and is an Associate Editor of the British Journal of Anaesthesia. All other authors declared no conflict of interest.
References
Author notes
The Sabine Friedrich, Pauline Y. Ng and Katharina Platzbecker authors contributed equally to this study.

