


Abstract
Internal, slow‐release implants can be an effective way to manipulate animal physiology or deliver a chemical exposure over long periods of time without the need for an exogenous exposure route. Slow‐release implants involve dissolving a compound in a lipid‐based carrier, which is inserted into the body of an organism. However, the release kinetics of the compound from the implant to body tissues also requires careful validation. We tested and validated a slow‐release implant methodology for exposing fish to a pharmaceutical pollutant, fluoxetine. We tested two lipid‐based carriers (coconut oil or vegetable shortening) in the common roach (Rutilus rutilus). The implants contained either a high (50 μg/g), low (25 μg/g), or control (0 μg/g) concentration of fluoxetine, and we measured tissue uptake in the brain, muscle, and plasma of implanted fish over 25 days. The two carriers released fluoxetine differently over time: coconut oil released fluoxetine in an accelerating manner (tissue uptake displayed a positive quadratic curvature), whereas vegetable shortening released fluoxetine in a decelerating manner (a negative quadratic curvature). For both carrier types, fluoxetine was measured at the highest concentration in the brain, followed by muscle and plasma. By comparing the implant exposures with waterborne exposures in the published literature, we showed that the implants delivered an internal exposure that would be similar if fish were exposed in surface waters containing effluents. Overall, we showed that slow‐release internal implants are an effective method for delivering chronic exposures of fluoxetine over at least 1‐month time scales. Internal exposures can be an especially powerful experimental tool when coupled with field‐based study designs to assess the impacts of pharmaceutical pollutants in complex natural environments. Environ Toxicol Chem 2023;42:1326–1336. © 2023 The Authors. Environmental Toxicology and Chemistry published by Wiley Periodicals LLC on behalf of SETAC.
INTRODUCTION
Studying if and how emerging contaminants of concern affect wildlife at population or ecosystem levels is often a methodological challenge because it requires the application of controlled, experimental techniques across large spatial and temporal scales (Hellström et al., 2016; Nilsen et al., 2018; Windsor et al., 2017). Such “upscaling” is necessary to increase the ecological realism of the study environment in which effects are being tested (e.g., number of individuals, species, habitat complexity, exposure complexity; Bertram et al., 2022). Thus, there is a need for more experimental control in field settings, and to accomplish this, we require new methods and technologies to overcome the logistical hurdles of conducting experiments at these scales. For example, outdoor mesocosms are a way to conduct replicated pollutant exposures under realistic, natural environmental conditions (Mikó et al., 2015), and acoustic telemetry is a means of tracking aquatic animal movement in large‐scale, field‐based exposure studies (Hellström et al., 2016; Klaminder et al., 2019).
One hurdle to conducting field‐based ecotoxicological studies is the scale at which exposures must be conducted, and here, internal, slow‐release exposure implants can be an effective solution. Commercially available lipid‐based products (e.g., coconut oil, cocoa butter) can be used as carriers to slowly deliver an internal exposure of emerging contaminants to aquatic organisms (McCallum et al., 2019; McDonald et al., 2011). These slow‐release implants function by suspending a known concentration of a chemical compound in a liquified lipid‐based carrier; the solution is then injected into the body cavity (intraperitoneal) to solidify. Lipid‐based carriers have a long history in endocrinology‐focused research to uncover how controlled, internal exposures to endogenous hormones such as cortisol affect immune function, physiology, and behavior in both the laboratory and the field (see Birnie‐Gauvin et al., 2018; O'Connor et al., 2009; Pickering & Duston, 1983; and references reviewed in Gamperl et al., 1994). Other forms of slow‐release hormone implants that have been tested in fish—but are not the focus of the present study—include silastic capsules, cholesterol, cellulose, and/or silicone‐based implants, (see Berglund et al., 1994; reviewed in Gamperl et al., 1994; Sopinka et al., 2015). There are many advantages to this approach: the implants are practical and cost‐effective, and they can reduce the exposure cost and the inevitable pollution that would result from whole‐lake or whole‐ecosystem chemical exposures. Slow‐release implants can also be coupled with animal movement or physiological technologies like passive integrative transponder (PIT) tags, acoustic tags, or biologgers. Although slow‐release implants are an attractive means by which to upscale research on emerging chemicals, it is also necessary to validate the release kinetics of the chemical compound from the implant.
We validated an implant methodology for a relevant chemical pollutant, the pharmaceutical fluoxetine. We focused on this compound because of its high consumption by humans as well as the growing body of research showing that fluoxetine is present in the environment and can affect aquatic animals. Fluoxetine (trade name, Prozac) is a selective serotonin re‐uptake inhibitor (SSRI) antidepressant that has been prescribed since the late 1980s and is still one of the top‐prescribed antidepressants (Luo et al., 2020). Fluoxetine has been detected in aquatic environments across the world, most typically in relatively low concentrations in surface waters (<10 ng/L) and in higher concentrations in wastewater or pharmaceutical manufacturing effluents (e.g., >500 ng/L; Giebułtowicz & Nałecz‐Jawecki, 2014; Hughes et al., 2013; Mole & Brooks, 2019; Schultz et al., 2010; Wilkinson et al., 2022). Fluoxetine and other SSRIs are unlikely to cause direct mortality to exposed aquatic organisms in the wild, but they can bioaccumulate in tissues (Arnnok et al., 2017). There has been increasing concern over the sublethal impacts that fluoxetine could have on aquatic organisms, especially via its behavioral effects (Correia et al., 2023; Gould et al., 2021). Laboratory studies have revealed that waterborne fluoxetine exposure can affect a range of behaviors including foraging, antipredator responses, and social and aggressive behaviors, and can also reduce among‐individual variation in such behaviors (see Martin et al., 2017; McCallum et al., 2017; Painter et al., 2009; Polverino et al., 2021; Thoré et al., 2020; behavioral effects reviewed in Salahinejad et al., 2022). However, the effects of fluoxetine on behavior are complex and there is considerable variation in sensitive species and the concentrations that lead to behavioral change (Ford & Feuerhelm, 2020; Sumpter et al., 2014).
Given the accumulating evidence for the behavioral effects of fluoxetine observed under laboratory conditions, we would benefit from further studies of how fluoxetine affects aquatic organisms in more complex, natural settings. Implant methods can help accomplish this, and so we evaluated the release kinetics and tissue‐specific uptake of fluoxetine from internal implants using two different lipid‐based carriers. As a model species, we used the common roach (Rutilus rutilus)—a planktivorous fish species in temperate climates of Europe and Western Asia. We evaluated the implants' performance over a month‐long period by analyzing the concentrations of fluoxetine in muscle, brain, and plasma via liquid chromatography tandem mass spectrometry. Given previous research using similar lipid‐based carriers (see McCallum et al., 2019 for oxazepam, and Birnie‐Gauvin et al., 2018 for cortisol), we generally expected that fluoxetine concentrations would initially increase and then decline in all tissues over the month as fluoxetine migrates from the implant to the surrounding fish tissues down a concentration gradient. We also predicted that fluoxetine would bioconcentrate to the highest concentrations in brain tissues versus muscle and plasma because of its higher lipophilicity (Duarte et al., 2022).
MATERIALS AND METHODS
Fish collection and housing
We collected wild adult roach (n = 134, mass: 70.26 ± 31.66 g, standard length: 16.95 ± 2.10 cm) from the Ume River near Umeå, Sweden using umbrella traps and transported them to Umeå University. We housed fish in large (1500‐L), aerated, flow‐through tanks supplied with nonchlorinated groundwater for the duration of the experiment (i.e., for both the initial housing [at least 5 days] and exposure period). We fed the fish pellets (BioMar Inicio) until satiation, once daily. We monitored water quality in the housing/exposure tanks across the experiment every 3 days; the temperature was 7.62 ± 0.28 °C, the dissolved oxygen 13.12 ± 0.54 mg/L, and the pH 7.76 ± 0.40. The water quality by treatment/holding tank is reported in the Supporting Information, Table S1.
Implant exposures
We prepared the implants and exposed the fish following the methodology outlined in McCallum et al. (2019). Briefly, we prepared the implants by dissolving fluoxetine hydrochloride (CAS: 56296‐78‐7) in either of two commercially available implant carriers: vegetable shortening (Crisco, a blend of soybean and palm oils) or coconut oil (Kung's Markatta Virgin Coconut Oil). We liquified the carriers to just above their melting points using a stir‐plate and hot water bath. We prepared three exposure treatments for each implant carrier, a high dose (50 μg/g), a low dose (25 μg/g), and a control dose (0 μg/g, no fluoxetine and only implant). Each treatment was prepared by stirring fluoxetine in the liquified carrier until it was visibly dissolved (~5–10 min) and then sonicating the mixture in an ultrasound bath at 30 °C for 15 min (Babdelin Sonorex Digitec). We anesthetized the fish before implanting using MS‐222 (ethyl 3‐aminobenzoate methanesulfonate; Merck; at 0.15 g/L). We measured fish mass and standard length and then tagged the fish with a small PIT (Biomark) tag to identify them across the experiment via a small incision in the ventral, left side of the body cavity. We injected the liquified implant via the same incision site at a dosage of 5 μl implant/g of body mass. Fish were then placed in a dark, aerated tank to recover for approximately 30 min before being returned to their housing tank. Fish were randomly (haphazardly) assigned to treatment. This fish species is not externally sexually dimorphic; therefore, sex was only able to be confirmed after the experiment during tissue collections (discussed further below). A summary of fish body size and sex by treatment is presented in the Supporting Information, Table S2.
To validate the performance of the slow‐release implants, we euthanized five fish from each treatment after 24 h of exposure, and every 6 days thereafter (on days 7, 13, 19, and 25) to generate a time series. We only implanted a subset of the fish as control fish (0 μg/g), and they were euthanized at 24 h and on days 13 and 25—corresponding to the start, middle, and end of the exposure period. We collected plasma samples from all fish before terminal sampling at 24 h, and on days 13 and 25 using chilled needles rinsed with ethylenediaminetetraacetic acid (EDTA) solution to reduce blood clotting. We also sampled five fish on day 1 that had received no implant or PIT tag, to validate that the fish had no background fluoxetine contamination. All fish were euthanized using an overdose of ethyl 3‐aminobenzoate methanesulfonate (MS‐222; 0.45 g/L) and frozen whole at −18 °C until later analysis.
Sample pretreatment
We prepared tissue, plasma, and implant samples for chemical analysis following the methods used in McCallum et al. (2019). We thawed the fish, dissected samples of muscle and brain tissue (0.07–0.11 g), and placed them in separate 2‐ml polypropyelene (PP) tubes. We extracted the samples twice, sequentially. We began by adding 1.5 ml of acetonitrile, 100 ng of internal standard (fluoxetine‐D5, CAS 1173020‐43‐3; Merck; 100 μl of 1 μg/ml in methanol), and approximately 10 zirconium beads. The samples were then homogenized for 4 min at 42 000 oscillations/min (Mini Beadbeater; Biospec Instruments) and centrifuged for 10 min (Beckman Coulter Microfuge 22 R Centrifuge). We removed the supernatant, repeated the extraction process (only adding new acetonitrile, no internal standard or extra beads), and combined the two supernatants in 12‐ml glass vials. The eluent was evaporated to dryness and reconstituted in 150 μl of methanol. Samples were stored in autosampler vials and frozen at −18 °C until chemical analysis (see the following Chemical analysis section).
We thawed and briefly homogenized the plasma samples (vortex mixer, 10 s) and then took 50 μl of plasma, 50 μl of methanol, 20 μl of water with 0.1% formic acid, and 100 ng of internal standard into 2‐ml PP tubes. We mixed the samples for 2 min (no beads were used; Mini Beadbeater) and then froze them at −18 °C overnight before centrifuging them and transferring to a glass autosampler vial.
We extracted the implants from fish sampled at 24 h and on days 13 and 25 to verify the concentrations of fluoxetine in the implants. We removed the implant from the body cavity, manually homogenized it, and transferred 0.1 g (±0.01 g) to a 2‐ml PP tube. The extraction followed the same procedure as for muscle and brain tissue, but the centrifuge was set at 0 °C to solidify the fat (i.e., the carrier) from the liquid phase before removing the supernatant.
Chemical analysis
We used a triple‐stage quadrupole mass spectrometer (TSQ Quantiva;Thermo Scientific) equipped with a heated‐electrospray ionization ion source to analyze all samples within the present study. The instrument was coupled to an Accela LC pump (Thermo Fisher Scientific) and a PAL HTC autosampler (CTC Analytics). To separate target analytes, we utilized C18 phase Hypersil gold columns (50 mm × 2.1 mm ID × 3 μm particles; Thermo Fisher Scientific). Liquid chromatography–mass spectrometry (LC–MS)‐grade acetonitrile and methanol (LiChrosolv—hypergrade) were purchased from Merck. Formic acid (Sigma‐Aldrich) was used to acidify the water in the extraction protocol of plasma samples and mobile phases used for LC.
To assess quality assurance and quality control for the analytical method, we evaluated its performance based on linearity, precision, limit of quantification (LOQ), recovery, and measurement of blank samples. We quantified fluoxetine in samples using the internal standard approach. We derived LOQ and precision from a six‐point standard curve ranging between 0.1 and 100 ng/g that was run together with each batch of samples. We used peak area corresponding to the lowest point of the calibration curve that had a signal/noise ratio of at least 10 to calculate LOQs in individual samples and a relative standard deviation (RSD) of response factors calculated for each point of the calibration curve to express precision. We calculated recovery from fortified samples that were spiked with 5 ng of fluoxetine surrogate standard. (We used tissues and implants from control fish to prepare these).
Statistical analyses
All statistical analyses were conducted in R, Ver 4.1.2 (R Core Team, 2022). We used linear mixed effects models (LMMs; using the “glmmTMB” R package, Brooks et al., 2017) to test whether the concentration of fluoxetine in tissues varied with implant carrier type (categorical variable: coconut oil or vegetable shortening), exposure concentration (categorical variable: low vs. high), and tissue type (categorical variable: brain, muscle, plasma). We also included the first‐ and second‐degree orthogonal polynomials of sampling day (continuous variable) to investigate any nonlinear (quadratic) patterns in the uptake of fluoxetine. We included a random intercept of “fish ID” to account for the multiple tissue samples taken from each fish. Fluoxetine concentrations were ln‐transformated to meet parametric assumptions. We explored all two‐way and three‐way interactions in the model and removed them when they did not significantly improve the model fit based on a likelihood ratio test (LRT). We used “emmeans” (R package, Lenth, 2022) to examine pairwise contrasts between carrier types.
We tested whether tissue fluoxetine concentrations were proportional to the implant treatment (i.e., high vs. low) by calculating an implant bioconcentration factor (implant‐BCF, “IBCF”) using the following equation:
For this equation, the units of concentration in tissues were ng/g and ng/ml for plasma samples. We then ran an LMM on IBCF using the same model structure just described.
We evaluated the intrafish variability of fluoxetine concentrations among tissues by plotting correlations and extracting Pearson correlation coefficients.
To compare the tissue concentrations of fluoxetine that resulted from our implant exposures with those from an external waterborne exposure, we collected data from published studies in which fish were exposed to fluoxetine via the water column. We extracted the average concentrations of fluoxetine measured in three tissue types (muscle, brain, plasma) along with the concentrations of fluoxetine that the fish were exposed to in the water column (see full list in the Supporting Information, Data file S4). We used a correlation with ln‐transformed values to then determine which implant concentrations would yield similar tissue concentrations for different waterborne fluoxetine exposures.
In all of the above analyses and the following figures, any samples that measured below the LOQ were set at half the tissue‐specific LOQ value unless otherwise explained (Duval & Karlsson, 2002).
RESULTS
Fluoxetine was not detected in muscle, brain, and plasma samples from any of the baseline fish (not implanted) or from any control‐implanted fish. The average LOQ values for the three tissues calculated from all analyzed individual samples were 0.16, 0.27, and 0.71 ng/g, respectively. The method performance was satisfactory within the selected concentration range for linearity (R2 between 0.9798 and 0.9844) and precision (RSD between 22% and 25%), depending on the actual run. The average recovery values calculated from fortified samples (n = 5 for each sample type) were 108%, 111%, 110%, and 103% for muscle, brain, plasma, and implant, respectively.
Tissue‐specific uptake of fluoxetine from the implants
Treated fish showed tissue‐specific, nonlinear uptake of fluoxetine from the implants over the exposure period (Figure 1 and Table 1), and this effect differed significantly between the carrier types (LRT for three‐way interaction between sampling day × implant carrier × tissue type, df = 4, ΔAIC = −231.57, LRT statistic = 48.67, p < 0.0001). We broke down this interaction by fitting this model separately for each of the two implant carrier types, to better resolve the pharmacokinetics of fluoxetine from each of them.
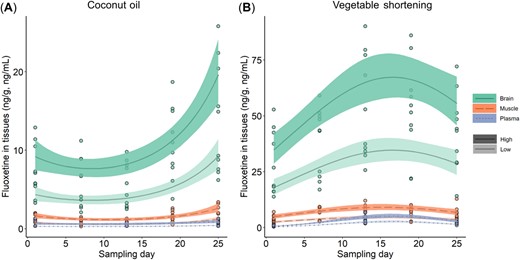
Note the difference in y‐axis scales between (A) and (B). Tissue‐specific uptake of fluoxetine from the two implant carriers (A) coconut oil and (B) vegetable shortening plotted by exposure treatment (shown by color saturation) and tissue type (shown by color and line type). Lines show predicted mean values, the shaded ribbons give the 95% confidence interval around the mean, and individual data points are raw values. Any value that was less than the limit of quantitation (LOQ) were set to ½ of its tissue‐specific LOQ (see Materials and Methods section).
Mean (±SD) concentration of fluoxetine measured in brain (ng/g), muscle (ng/g), plasma (ng/ml), and implant (ng/g)
| High | Low | |||||
| 1 day | 13 days | 25 days | 1 day | 13 days | 25 days | |
| Coconut oil | ||||||
| Brain | 9.56 (2.98) 5/5 | 8.02 (1.47) 5/5 | 19.82 (4.60) 5/5 | 5.04 (1.59) 5/5 | 3.14 (0.71) 5/5 | 7.82 (1.25) 5/5 |
| Muscle | 1.64 (0.36) 5/5 | 1.04 (0.19) 5/5 | 2.64 (0.68) 5/5 | 1.00 (0.21) 5/5 | 0.60 (0.31) 5/5 | 1.00 (0.21) 5/5 |
| Plasma | 0.75 (0.47) 2/4 | 0.53 (0.24) 2/5 | 0.99 (0.41) 4/5 | NA 0/5 | NA 0/3 | 0.38 (0.06) 1/5 |
| Implant | 32 949.4 (4524.59) 5/5 | 34 159.0 (2132.63) 5/5 | 29 621.4 (3590.66) 5/5 | 16 665.0 (5280.88) 5/5 | 19 112.4 (2835.16) 5/5 | 15 608.0 (1601.98) 5/5 |
| Vegetable shortening | ||||||
| Brain | 40.90 (9.62) 5/5 | 73.58 (13.94) 5/5 | 55.70 (11.74) 5/5 | 16.62 (1.98) 5/5 | 33.04 (4.52) 5/5 | 30.10 (10.89) 5/5 |
| Muscle | 5.02 (1.33) 5/5 | 9.46 (1.78) 5/5 | 7.86 (2.95) 5/5 | 2.58 (0.59) 5/5 | 4.76 (1.09) 5/5 | 3.42 (1.13) 5/5 |
| Plasma | 0.74 (0.40) 3/5 | 5.02 (1.04) 5/5 | 2.44 (0.68) 5/5 | NA 0/1 | 0.66 (0.65) 5/5 | 1.80 (0.58) 5/5 |
| Implant | 18 187.00 (4982.02) 5/5 | 10 056.80 (1626.08) 5/5 | 6531.80 (1785.79) 5/5 | 6963.80 (2136.59) 5/5 | 3932.40 (750.18) 5/5 | 3027.40 (634.15) 5/5 |
Below each mean is a fraction showing the number of samples in which fluoxetine was detected above the limit of quantification (LOQ) over the total number of samples analyzed. For the means, any samples less than the LOQ were set to ½ of its tissue‐specific LOQ (see Statistical analyses section).
NA = not available.
For both carrier‐specific models, the final model structure (as systematically reduced by removing interactions that did not improve model fit; see Materials and Methods section) included terms for exposure concentration, tissue type, sampling day (fit with both linear and quadratic terms), and the interaction between tissue type and sampling day. For both carrier types, fish implanted with high doses of fluoxetine took up higher concentrations of the pharmaceutical into their tissues than fish implanted with low doses (Figure 1 and Table 2). For each carrier type, there was also a significant interaction between sampling day and tissue type, indicating that the slope of fluoxetine uptake differed between the tissue types (Figure 1 and Table 2). Fluoxetine uptake into fish tissues displayed a positive (accelerating) quadratic curvature over the sampling period when the implants were coconut oil, whereas the uptake displayed a negative (decelerating) quadratic curvature when the implants were vegetable shortening (Figure 1 and Table 2). For both coconut oil and vegetable shortening, brain tissue concentrated more fluoxetine than muscle tissue, and plasma consistently showed the lowest concentration of fluoxetine concentrations (Figure 1).
Output from two linear mixed effects models for the uptake of fluoxetine from implants made of coconut oil or vegetable shortening
| Estimate ± SE | z‐value | p‐value | |
| Coconut oil | |||
| Intercept | 2.38 ± 0.061 | 39.05 | <0.0001 |
| Sampling day (linear term)(High ref. lvl)(Brain ref. lvl) | 3.16 ± 0.55 | 5.72 | <0.0001 |
| Sampling day (quadratic term)(High ref. lvl)(Brain ref. lvl) | 2.39 ± 0.55 | 4.34 | <0.0001 |
| Low treatment(High ref. lvl) | −0.75 ± 0.077 | −9.76 | <0.0001 |
| Muscle tissue(Brain ref. lvl) | −1.90 ± 0.051 | −37.15 | <0.0001 |
| Plasma(Brain ref. lvl) | −2.75 ± 0.066 | −41.65 | <0.0001 |
| Sampling day (linear term): Muscle(Brain ref. lvl) | −1.21 ± 0.59 | −2.03 | 0.042 |
| Sampling day (quadratic term): Muscle(Brain ref. lvl) | 0.37 ± 0.59 | 0.62 | 0.54 |
| Sampling day (linear term): Plasma(Brain ref. lvl) | −1.74 ± 0.66 | −2.64 | 0.0082 |
| Sampling day (quadratic term): Plasma(Brain ref. lvl) | −1.24 ± 0.69 | −1.79 | 0.074 |
| Vegetable shortening | |||
| Intercept | 3.98 ± 0.058 | 68.41 | <0.0001 |
| Sampling day (linear term)(High ref. lvl) (Brain ref. lvl) | 1.81 ± 0.50 | 3.60 | 0.0003 |
| Sampling day (quadratic term)(High ref. lvl) (Brain ref. lvl) | −1.91 ± 0.51 | −3.74 | 0.0002 |
| Low treatment(High ref. lvl) | −0.66 ± 0.076 | −8.69 | <0.0001 |
| Muscle tissue(Brain ref. lvl) | −2.01 ± 0.039 | −50.97 | <0.0001 |
| Plasma(Brain ref. lvl) | −3.08 ± 0.051 | −59.83 | <0.0001 |
| Sampling day (linear term): Muscle(Brain ref. lvl) | −0.58 ± 0.45 | −1.29 | 0.20 |
| Sampling day (quadratic term): Muscle(Brain ref. lvl) | −0.24 ± 0.46 | −0.52 | 0.61 |
| Sampling day (linear term): Plasma(Brain ref. lvl) | 4.039 ± 0.54 | 7.43 | <0.0001 |
| Sampling day (quadratic term): Plasma(Brain ref. lvl) | −4.22 ± 0.53 | −8.00 | <0.0001 |
Both models assessed differences among roach tissues (brain, muscle, plasma) and at two implant concentrations (low, high). Sampling day was fit with both a linear and quadratic term to accommodate any non‐linear pharmacokinetics. Each term needs to be interpreted in relation to the appropriate reference levels that are given in subscript at the end of each term. We answered more targeted research questions using emmeans post hoc analyses, and this output is given in Tables 3 and 4. Significant p‐values at α < 0.05 are given in bold.
We used emmeans post hoc contrasts (Tukey) on the original model with both carrier types (see output just described) to directly compare the performance of coconut oil and vegetable shortening, comparing concentrations of fluoxetine in the fish tissues on days 1 and 25. Vegetable shortening implants released fluoxetine into fish tissues more quickly than coconut oil implants. This was evident even on day 1, when all tissue types (with the exception of plasma) had already taken up more fluoxetine in the fish that were implanted with vegetable shortening than those implanted with coconut oil (see Figure 1 and Table 3 for comparison of tissue concentrations between carriers on days 1 and 25). Similarly, on day 25, fish implanted with vegetable shortening had taken up more fluoxetine into all tissues (including plasma) compared with the fish implanted with coconut oil (Figure 1 and Table 3).
Post hoc comparison of fluoxetine concentrations between implant carrier types (coconut oil and vegetable shortening) at beginning and end of the sampling period, for all tissues and both high and low treatments
| Tissue | Treatment | Estimate ± SE | df | t‐ratio | p‐value |
| Day 1: Vegetable shortening vs. coconut oil | |||||
| Brain | High | 0.62 ± 0.077 | 218 | 8.02 | <0.0001 |
| Muscle | High | 0.53 ± 0.077 | 218 | 6.86 | <0.0001 |
| Plasma | High | 0.048 ± 0.085 | 218 | 0.57 | 0.57 |
| Brain | Low | 0.57 ± 0.077 | 218 | 7.41 | <0.0001 |
| Muscle | Low | 0.45 ± 0.077 | 218 | 5.82 | <0.0001 |
| Plasma | Low | −0.031 ± 0.10 | 218 | −0.31 | 0.76 |
| Day 25: Vegetable shortening vs. coconut oil | |||||
| Brain | High | 0.39 ± 0.077 | 218 | 5.12 | <0.0001 |
| Muscle | High | 0.37 ± 0.077 | 218 | 4.82 | <0.0001 |
| Plasma | High | 0.45 ± 0.081 | 218 | 5.52 | <0.0001 |
| Brain | Low | 0.55 ± 0.077 | 218 | 7.10 | <0.0001 |
| Muscle | Low | 0.49 ± 0.077 | 218 | 6.39 | <0.0001 |
| Plasma | Low | 0.57 ± 0.081 | 218 | 7.02 | <0.0001 |
Vegetable shortening releases more fluoxetine than coconut oil, with the exception of plasma on at the start of the experiment. Statistical output from emmeans contrasts. Significant p‐values at α < 0.05 are given in bold.
We also used emmeans post hoc contrasts on each carrier‐specific model, to test whether tissue‐specific uptake was significantly nonlinear over time. We found that for coconut oil, all tissues took up more fluoxetine from the implants as time progressed (linear terms), and with the exception of plasma, their fluoxetine concentrations accelerated over time (quadratic terms; Figure 1A and Table 4). For vegetable shortening, all tissues took up more fluoxetine from the implants as time progressed (linear terms), but their fluoxetine concentrations decelerated over time (quadratic terms), and even began to decrease by the end of the 25‐day sampling period (Figure 1B and Table 4).
Post hoc comparison of whether tissue fluoxetine concentrations followed significantly linear or nonlinear (quadratic) temporal patterns for each implant carrier type (coconut oil and vegetable shortening), collapsed across treatment level
| Tissue | Term | Estimate ± SE | df | t‐ratio | p‐value |
| Coconut oil (effect of sampling day) | |||||
| Brain | Linear | 41.0 ± 7.22 | 114 | 5.69 | <0.0001 |
| Brain | Quadratic | 182.6 ± 42.08 | 114 | 4.34 | <0.0001 |
| Muscle | Linear | 25.2 ± 7.25 | 114 | 3.48 | 0.0007 |
| Muscle | Quadratic | 210.6 ± 42.21 | 114 | 4.99 | <0.0001 |
| Plasma | Linear | 18.4 ± 8.15 | 114 | 2.26 | 0.026 |
| Plasma | Quadratic | 88.2 ± 50.20 | 114 | 1.76 | 0.082 |
| Vegetable shortening (effect of sampling day) | |||||
| Brain | Linear | 25.4 ± 6.69 | 114 | 3.79 | 0.0002 |
| Brain | Quadratic | −146.0 ± 39.04 | 114 | −3.74 | 0.0003 |
| Muscle | Linear | 17.8 ± 6.69 | 114 | 2.65 | 0.0091 |
| Muscle | Quadratic | −164.2 ± 39.04 | 114 | −4.21 | 0.0001 |
| Plasma | Linear | 82.0 ± 7.85 | 114 | 10.44 | <0.0001 |
| Plasma | Quadratic | −468.5 ± 43.75 | 114 | −10.71 | <0.0001 |
Statistical output from emmeans contrasts. Significant p‐values at α < 0.05 are given in bold.
Intrafish implant variability and dose delivery
Intra‐individual differences were consistent among muscle and brain for both implant carriers (correlation coefficients 0.93 and 0.94; Figure 2), but were less consistent between brain and plasma and muscle and plasma (correlation coefficients of 0.28–0.56). Fluoxetine treatment did not affect the IBCF (LMM, effect of treatment, F1,98.64 = 0.24, p = 0.62), nor did treatment interact with any other factors (all p > 0.1), indicating that uptake from the implants was proportional to the concentration received from both carriers.
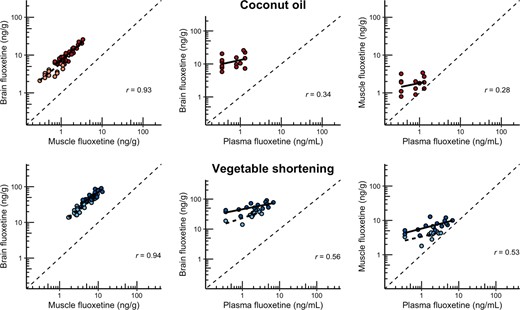
Uptake of fluoxetine in tissues for fish implanted with coconut oil (top row) or vegetable shortening (bottom row), all plotted on a log‐scale. Dark colors show the high‐exposure treatment, and light colors show the low‐exposure treatment. Correlation coefficients plotted are Pearson R values. Note that no low‐exposure treatment is shown for the coconut oil graphs containing plasma because all samples analyzed were less than the limit of quantification (LOQ; see Table 1).
DISCUSSION
We tested the performance of two lipid‐based carriers as a slow‐release method for delivering an internal exposure of the pharmaceutical fluoxetine in fish. Although previous studies have used fluoxetine implants to expose fish (McDonald et al., 2011; Morando et al., 2009), no study has yet quantified the magnitude, temporal dynamics, and tissue‐specific uptake patterns of fluoxetine from implants, or for any other antidepressant pharmaceutical. We found that both vegetable shortening and coconut oil released fluoxetine into fish tissues, but that they followed different kinetic patterns. For both carriers, tissue uptake followed nonlinear temporal patterns: tissues of fish implanted with coconut oil displayed an accelerating uptake of fluoxetine, whereas those of fish implanted with vegetable shortening decelerated by the end of the sampling period. The pharmacokinetics of fluoxetine uptake in human tissues are also nonlinear, meaning that fluoxetine accumulates internally because the substrates that metabolize and clear fluoxetine are fully saturated under a normal dosing regimen until steady state or an equilibrium is reached—usually after approximately 1 month (Hiemke & Härtter, 2000).
In the present study we saw that fluoxetine uptake from the vegetable shortening carrier followed a pattern similar to that of humans: fluoxetine increased in tissues over time, peaked, and then began to decline. (This decline deviates from that of humans following a daily dosing regimen.) In contrast, fluoxetine uptake from the coconut oil carrier appeared to be peaking by the end of the study duration. Moreover, fish implanted with vegetable shortening absorbed higher concentrations of fluoxetine than fish implanted with coconut oil, and the amount of fluoxetine absorbed tended to be more variable from vegetable shortening than from coconut oil (see standard deviations in Table 1). Overall, this suggests that fluoxetine is released in higher concentrations and more rapidly from the vegetable shortening carrier than from the coconut oil carrier. This is in line with previous research showing that the pharmaceutical oxazepam was released more rapidly from vegetable shortening than from coconut oil when implanted in roach (McCallum et al., 2019), and that the hormone cortisol was released more quickly from vegetable shortening than from cocoa butter when implanted in brown trout Salmo trutta (Birnie‐Gauvin et al., 2018). The differences in release between the two carriers could be due to differences in fatty acid composition: vegetable shortening has a higher proportion of unsaturated to saturated fat than coconut oil (vegetable shortening is ~30% saturated, whereas coconut oil is ~85% saturated). Vegetable shortening has a higher melting point range and is firmer at room and cooler temperatures compared with coconut oil. The two products will therefore differ in their rheological properties (i.e., how crystals are formed in the fat and how they deform in response to mechanical stress). Further research on the physical properties and behavior of these implants at environmental temperatures that would be experienced in the inside of a fish is needed to clearly identify the mechanisms underlying release differences.
Fluoxetine accumulated the most in brain tissue followed by muscle and then plasma, irrespective of carrier type. These findings agree with those of Liu et al. (2021), who found a similar tissue‐specific uptake pattern (brain > muscle > plasma) in Nile tilapia (Oreochromis niloticus) exposed via water for 8 days. Pan et al. (2018) found that muscle absorbed slightly more or similar amounts of fluoxetine as the brain tissues in red crucian carp (Carassius carassius) exposed via water for 30 days (plasma was not measured). In humans and rats taking oral dosages of fluoxetine, the ratio of fluoxetine in brain‐versus‐plasma studies is typically approximately 2 (Bolo et al., 2000; Caccia et al., 1990; Johnson et al., 2007; Wille et al., 2009) but values have been reported to be as much as 10–15 times higher in brain than plasma (Bolo et al., 2000; Johnson et al., 2007). In roach, we found that fluoxetine bioconcentrated approximately 12–55 times higher in brain than in plasma, and approximately 2–7 times higher in muscle than in plasma. Fish may bioconcentrate fluoxetine to a greater degree than humans because they lack orthologs of several of the cytochrome p450 isoenzymes that are responsible for metabolizing fluoxetine in humans (Smith et al., 2010; Wenthur et al., 2014). Still, fish are capable of metabolizing fluoxetine into norfluoxetine, but there appears to be notable interspecies variation in the efficiency of this metabolic capacity (Margiotta‐Casaluci et al., 2014; Paterson & Metcalfe, 2008; Smith et al., 2010). The concentrations of fluoxetine that we measured were still below human therapeutic concentrations, which range from 50 to 500 μg/L in plasma and 1000–40,000 μg/kg in the brain (Altamura et al., 1994). Therefore, a higher concentration of fluoxetine would be needed in the implant preparation if researchers want to ensure that implanted fish receive a human therapeutic exposure (which might be more likely to produce behavioral effects; see Margiotta‐Casaluci et al., 2014). However, we also refer interested readers to Morando et al. (2009), who found higher mortality in gulf toadfish, Opsanus beta, after exposure to 75 and 100 μg/g of fluoxetine via a coconut oil implant. These fish were held at much higher temperatures, which might have increased the rate at which fluoxetine was released from the implant; unfortunately, fluoxetine was not quantified in any fish tissues during that study for comparison.
We surveyed the published literature to extract data on the uptake of fluoxetine in fish tissues after waterborne exposures, and we used these data to estimate the waterborne concentrations of fluoxetine that would be needed to match the tissue concentrations of fluoxetine derived from our implant method (Figure 3). The coconut oil implants were effective at delivering an internal exposure that would be similar if fish were exposed in the environment near a wastewater effluent source (<100–500 ng/L, depending on which tissue or implant dosage you consider), whereas the vegetable shortening implants delivered a higher dosage. The tissue concentrations we observed in muscle are like those found in wild‐collected or caged fish near wastewater treatment plant outfalls (Muir et al., 2017; Togunde et al., 2012) and were higher than those reported in fish exposed to a 20% wastewater dilution (Lajeunesse et al., 2011). It should be noted that fluoxetine uptake into fish tissues from water is pH dependent (Martin et al., 2019; Nakamura et al., 2008), and this dependence could not be accounted for in our comparisons. Moreover, we showed that the internal fluoxetine exposure coming from the implants changed over time. Therefore, Figure 3 should serve as a general guide for estimating the waterborne concentrations of fluoxetine that would yield similar tissue concentrations as our implants, but it should not serve to make precise conversions.
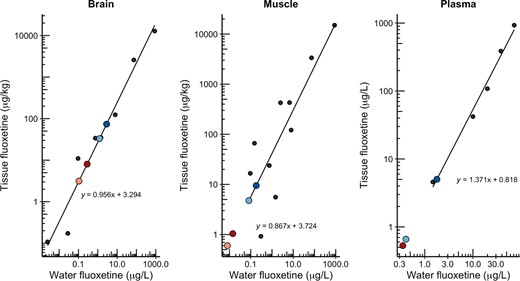
Scatter plot estimating the concentration of fluoxetine needed in a waterborne exposure scenario to match the concentrations of fluoxetine measured in tissues in our study. Black circles and regression line show the tissue and waterborne exposure concentrations from published primary research (given below). Larger colored points show concentrations of fluoxetine in tissues after 13 days of exposure in our study (light red, coconut oil low; dark red, coconut oil high; light blue vs. low; dark blue vs. high). See the Supporting Information, Figures S1 and S2, for days 1 and 25. Primary data used were from Schultz et al. (2011), Togunde et al. (2012), Marigotta‐Casaluci et al. (2014), Duarte et al. (2020), and Liu et al. (2021). Also see the Supporting Information.
In conclusion, we have quantified the release kinetics of the pharmaceutical fluoxetine from two lipid‐based internal exposure carriers. Our findings indicate that in roach, fluoxetine is released in a nonlinear manner similar to the pharmacokinetics of fluoxetine in human patients who were following a daily dosing regimen. Overall, coconut oil released fluoxetine at a slower rate than vegetable shortening, and this resulted in comparably lower, but also less variable, tissue concentrations. Thus coconut oil may be the favorable carrier when the aim of a study is to generate long‐lasting, stable exposures, whereas vegetable shortening may be superior in a more condensed exposure regime. Ultimately, the chosen carrier and dosage will depend on individual experimental needs. Our implant method is especially useful for conducting exposure experiments in the wild where waterborne exposures are not feasible or permissible. Similarly, this method can be used to dose fish held in laboratory settings that are outfitted with flow‐through housing systems. Natural extensions for experimental designs using our slow‐release, internal implant method would be to pair them with other technologies, such as physiological biologging and/or spatial (e.g., GPS or acoustic) tracking of individuals. By removing the need to perform whole‐waterbody or whole‐ecosystem exposures, our methods promise to deliver a low‐cost and more environmentally sustainable solution for assessing animal responses to chemical compounds like fluoxetine in naturalistic environments.
Supporting Information
The Supporting Information is available on the Wiley Online Library at https://doi.org/10.1002/etc.5613.
Acknowledgments
Our research was supported by funding from the Swedish Research Council Formas (grant 2018‐00828 to Tomas Brodin). The authors would like to thank J. Wiklund for assistance in collecting fish and E. Gennotin for help in the laboratory.
Disclaimer
The authors declare no conflicts of interest.
Author Contributions Statement
Erin S. McCallum: Conceptualization; Methodology; Formal analysis; Investigation; Writing—original draft and review & editing; Project administration. Daniel Cerveny: Methodology; Investigation; Writing—review & editing. Aneesh P. H. Bose: Investigation; Formal analysis; Writing—original draft and review & editing. Jerker Fick: Resources; Writing—review & editing. Tomas Brodin: Resources; Writing—review & editing; Funding acquisition.
Data Availability Statement
All data files used in the analysis are freely available and are attached in the Supporting Information.
