


Abstract
Effects of anthropogenic activities such as urbanization, population growth, and agriculture on water quality are major concerns particularly in low‐income countries where water quality monitoring can be challenging. The purpose of the present study was to evaluate the cytogenotoxic potential of water from urban and rural Malagasy marshes, coupling a fish (Nile tilapia, Oreochromis niloticus) and a plant (Allium cepa) species as bioindicators. The fish and plants were exposed for 72 h to water sampled in the two locations investigated. Using the comet assay on fish erythrocytes, DNA strand breaks were assessed, while mitotic index and nucleolar alterations were estimated in cells of the plant root apex. Comet assays revealed significant DNA strand breaks to fish erythrocytes in both the marshes investigated while the mitotic index and nucleolar characteristics in the roots of A. cepa mainly highlighted potential cytotoxicity in the urban marsh. Our results demonstrate the advantages of coupling in vivo biological test systems to screen potential cytogenotoxicity of surface water in low‐income countries where comprehensive data sets of aquatic contaminants are often lacking. Environ Toxicol Chem 2023;42:1266–1275. © 2023 The Authors. Environmental Toxicology and Chemistry published by Wiley Periodicals LLC on behalf of SETAC.
INTRODUCTION
Water availability and quality are among the most important concerns for human societies (McLennan, 2021). Water quality has deteriorated as a result of urbanization, population growth, industrialization, and agriculture. Today, poor water quality is widespread and has a major negative effect on many aspects of human society, economy, and the environment (Kirschke et al., 2020). In low‐income countries, concerns about the distribution and allocation of water resources and water pollution are increasing. So far, water monitoring data are lacking in less‐developed countries, notably because of capacity challenges to define an enabling environment or prioritizing parameters as well as limiting financial and human means (Capps et al., 2016; Kirschke et al., 2020).
One of the main concerns in water quality deterioration is potential exposure to substances that are both cytotoxic and genotoxic. Cytogenotoxicity can only be evaluated by biologically oriented tests (Hemachandra & Pathiratne, 2017). Among the toxic effects induced by chemicals, one of the main concerns are the mutagenic/genotoxic hazards which could lead to ecological and human health risks (Ohe et al., 2004). Coupling different in vivo models, such as fish and plants, and different targeting endpoints with direct exposure to the water samples allows an integrated view of the cytogenotoxic risk for aquatic biomonitoring, as recommended by Orsière et al. (2005). Furthermore, several studies already have reported that genotoxicity tests based on fish and plants are producing results showing good correlations with human and other mammalian test systems (see Dos Reis et al., 2017; Leme & Marin‐Morales, 2009; Vlastos et al., 2016), suggesting that they are appropriate models for assessing the cytogenotoxicity potential of contaminated waters to humans.
The potential benefits of using fish as indicators of cytogenotoxicity are now widely recognized (de Lapuente et al., 2015). This is due to their ecological and economic importance and their similarity to mammals, for which toxicological mechanisms are far better described (Martins & Costa, 2017). The comet assay, consisting in quantifying DNA breaks by gel electrophoresis (Singh et al., 1988), applied to fish erythrocytes, is known to be a sensitive way to monitor aquatic environments affected by pollutants (de Lapuente et al., 2015; Frenzilli et al., 2009; Martins & Costa, 2017). Compared with other genotoxicity tests, the advantages of the comet assay are the detection of slight DNA damages, the low number of cells required, low cost, precision, ease of application, reproducibility, and the short period of time needed to conduct the experiment. In plants, the Allium cepa assay, which assesses chromosomal damage and disturbances in the mitotic cycle, is well known among plant cytogenotoxicity tests and is now used in many laboratories for a wide range of applications (Leme & Marin‐Morales, 2009). As for the comet assay test, the advantages of the A. cepa test are that it is fast, easy to use, and inexpensive and requires minimal sample preparation (Barbério, 2013; Leme & Marin‐Morales, 2009). For these reasons, all these trials can be conducted in remote areas from low‐income countries because such tests require limited infrastructures to be performed (Hemachandra & Pathiratne, 2016, 2017).
The objective of the present study was to investigate the cytogenotoxic potential of water sampled from two marshes in Madagascar, where the urban population is growing at twice the rate of that in the rest of the world (+5% per year; Bastaraud et al., 2018). One of the two marshes is mainly used to supply water to the capital city of Antananarivo (>1 300 000 inhabitants), while the second is mainly surrounded by agricultural land. Given the risk for both the aquatic organisms and the human health through contaminants entering the food chain and affecting human health, we chose to assess in vivo exposure using Nile tilapia, Oreochromis niloticus, an aquatic species, and, A. cepa, a terrestrial species, as bioindicators of cytogenotoxicity. These species are consumed by local populations (Food and Agriculture Organization, 2022) and are both present in the two locations.
MATERIALS AND METHODS
Study areas and sample collection
The investigated urban marsh (Masay) is an artificial basin built in 2004 measuring approximately 1 km2 and located in the northern part of the city of Antananarivo (18°52′5″S, 47°32′23″E); it acts as a buffer basin for wastewater and runoff from the surrounding districts (Figure 1). The basin opens into the Andriantany canal and the Ikopa river, collects rainwater and untreated domestic wastewater and industrial discharges from two watersheds, and regulates excess water to prevent flooding. Masay marsh is surrounded by residential housing, agri‐food industrial establishments, and numerous car garages, while uncontrolled landfills also exist near the marsh. Locally, several unpublished studies highlighted the pollution of this marsh, notably by heavy metals and other contaminants, with sometimes illegal fishing for self‐consumption and sale in local markets. For the purpose of comparison, water was also collected in a rural marsh located along the Viliahazo River (18°48′5″S, 47°40′13″E), which is used for agriculture, mostly for rice and cassava cultivation and fishing (Figure 1). There is also significant market gardening activity in the area, allowing the supply of vegetables to the city of Antananarivo, an agricultural activity requiring much more pesticides compared with other cropping systems (Razanakoto et al., 2021).
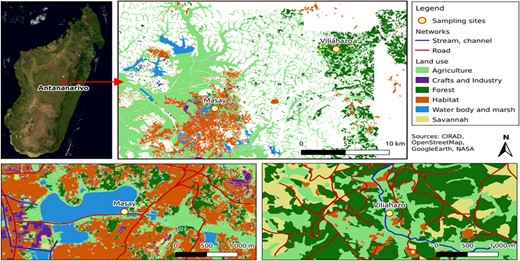
Location of Masay and Viliahazo marshes with respect to the capital city of Antananarivo and land uses in the vicinity. The map showing Masay marsh was modified from Dupuy et al. (2017).
The investigation was carried out in the rainy season, February 2019. Unfiltered surface water was collected from the urban and rural marshes at a depth of 50 cm and then, transported to the laboratory. For technical reasons, the samples of water were kept oxygenated using air bubbling and stored for 3 days at room temperature in the dark in separate 250‐L food‐grade plastic drums prior to the experiment. Ceretti et al. (2010) found that storage materials were not associated with the genotoxic properties of the water even after 10 days of storage at 40 °C. Thus, it is reasonable to assume that our storage conditions had no effect on water toxicity.
Water analysis
The physical–chemical parameters of the water under each experimental condition were measured at the beginning of the experiment. The temperature and the conductivity of the water were determined using a combined tester (HI 98311; Hanna Instruments), while pH was measured using a portable digital pH probe (HI 98128; Hanna Instruments). Dissolved oxygen was measured using a dissolved oxygen meter (HI 9146; Hanna Instruments), and the biochemical oxygen demand after 5 days was analyzed as described by Aminot and Kérouel (2004).
After the storage period, 100 mL subsamples of water originating from each location were taken from each drum, filtered using 0.2‐µm polyethersulfone filters, and kept in 50‐mL Falcon® tubes with trace element–grade nitric acid (pH <2) for the analysis of trace metals. All samples were kept at room temperature in the dark prior to analysis.
As potential cytogenotoxic agents (Tchounwou et al., 2012), the dissolved and particulate trace metals (i.e., As, Co, Cr, Cu, Fe, Mn, Ni, Pb, and Zn) were analyzed. In the water samples kept in Falcon tubes, trace elements were directly analyzed by inductively coupled plasma–mass spectrometry (ICP‐MS X series 2; Thermo Scientific). Trace metals on the filters were digested using hydrofluoric and perchloric acids following International Organization for Standardization (ISO) method ISO 14869‐1. All quality assurance procedures (e.g., blanks; reference materials SLRS6 and CRM 7004 [Metranal 34]) were applied in each analytical method. Only the elements recovered from reference materials in the 80%–120% range were analyzed.
Bioassay assembly
Thirty‐two adult Nile tilapia (fresh wt 127 ± 48 g) were obtained from a local fish farm. Fish were randomly placed in four 150‐L glass aquariums (n = 5/aquarium) filled with dechlorinated tap water and equipped with air‐lift filters and hiding places. Fish were acclimated to the laboratory conditions for 10 days under natural light and a natural photoperiod and were fed with a commercial diet (PGR32; Aqua Madagascar Innovation). Feeding was stopped 48 h before the bioassays began. After the acclimation period, the water in two aquariums was replaced by water collected from the urban and rural marshes, while the two other aquariums were used as controls. While dechlorinated tap water was used as a negative control, a further set of fish were exposed to ethyl methanesulfonate (EMS) at 10 mg L−1 and used as positive controls, similarly to a previous genotoxicity investigation in Nile tilapia (Könen & Çavaş, 2008). After the 3‐day exposure, five fish from each condition, including controls, were anesthetized with eugenol (0.5 mL L−1), and blood was sampled from the ventral tail vein using a heparinized syringe.
For the A. cepa test, we followed the protocol initially proposed by Fiskesjö (1985). Briefly, the plants were first grown in plastic glasses in tap water. When the roots were at least 1 cm long, they were transferred to the water collected from the urban and rural marshes, while, as for fish, dechlorinated tap water and EMS at 10 mg L−1 were used as negative and positive controls, respectively. After 72 h of exposure, root tips from all experimental and control conditions (n = 4 bulbs/condition) were processed for microscopy. The test was conducted under laboratory conditions in a shaded area at room temperature.
Bioassay procedures
Comet assay using fish
The alkaline comet assay using Nile tilapia erythrocytes was performed according to Singh et al. (1988) and Osman et al. (2012), with some modifications. Before the assay, frosted microscope slides were precoated with 1% (w/v) of normal‐melting agarose and dried at room temperature for at least 2 days. Each fish blood puncture was immediately diluted with phosphate‐buffered saline at a ratio of 1:500 (v/v). Then, 40 µL of each diluted blood sample was added to 360 µL of 0.5% (w/v) low‐melting agarose, and 150 µL of the mixture was immediately placed on the precoated slide and covered with a coverslip. The slides were incubated at 4 °C for 15 min to allow solidification, then immersed in cold lysing buffer (2.5 M NaCl, 100 mM ethylenediaminetetraacetic acid [EDTA], 10 mM trishydroxymethylaminomethane [Tris] base, pH 10, 1% Triton X‐100, 10% dimethyl sulfoxide) at 4 °C overnight (Hemachandra & Pathiratne, 2016; Iturburu et al., 2018). Then, the slides were incubated at 4 °C in electrophoresis buffer (300 mM NaOH, 1 mM EDTA, pH ≥ 13) for 40 min, and electrophoresis was carried out at 0.8 V/cm and 300 mA at 4 °C for 40 min. A neutralization step was then performed consisting of three successive 10‐min incubation periods in 0.4 M Tris buffer (pH 7.5). Slides were rinsed in ultrapure water for 5 min, then immersed in ethanol (≥99.6%) for 10 min to start dehydration before being dried at 45 °C for 1 h. Finally, the slides were stained with 100 µL of SYBR Gold (Thermo Fisher Scientific) diluted 10,000× with Tris/EDTA buffer (pH 8.0), and the comets were viewed under an epifluorescence microscope (Nikon Eclipse NI‐E; objective Plan APO 0, 75 NA ×20). For each fish, we analyzed two slides, each containing 200 cells (i.e., 400 cells/fish and ∼2000 cells/condition). The images were analyzed using the plug‐in OpenComet with ImageJ software (Gyori et al., 2014), and the extent of DNA strand breaks was expressed as the percentage of DNA in the tail (Kumaravel & Jha, 2006).
Mitotic index and nucleolar characteristics in the plant
The 3‐ to 5‐mm‐long root tips were cut, and immediately transferred to a fixative solution (ethanol:glacial acetic acid 3:1, v/v), and left overnight (Pathiratne et al., 2015). After fixation, the root tips were transferred to 70% ethanol and stored at 4 °C until analysis. Samples were hydrolyzed in 1 M HCl at 60 °C for 5 min (Creber et al., 1994) and washed three times with distilled water. Samples were processed with a ClearSee clearing protocol to enable visualization of all nuclei in the meristem region (Kurihara et al., 2015). After washing with a phosphate buffer, the root tips were immersed in a ClearSee solution (urea 25% w/v, sodium deoxycholate 15% w/v, xylitol, 10%, w/v) for 5–7 days under gentle shaking. The nuclei were then stained with a 4′,6‐diamidino‐2‐phenylindole solution (5 µg mL−1) prepared in ClearSee solution for 60 min. After washing, five root tips were placed on a glass slide and gently squashed in a drop of ClearSee solution by applying very slight pressure to the coverslip. Pictures of the meristem tissues were acquired with a multiphotonic microscope, 880 NLO Zeiss (Iena) equipped with an Apochromatic ×20 NA 1 objective, at 740 nm of excitation (bandpass emission, 405–495 nm; Plant Cell Imaging Platform, Plateforme d'histocytologie et d'imagerie cellulaire végétale, Montpellier Ressources Imagerie; ISO9001‐certified). A set of confocal images was taken of the specimen in such a way that the area of the image along the x‐ and y‐axes remained the same but the distance from the objective (z‐axis) differed in each image (z‐stack). Z‐stacks were performed on 100 µm with 1 µm between two optical slices (ZEN soft; Zeiss). Because the distance between adjacent images is precisely controlled in the z‐stack, it can be used to form a three‐dimensional (3D) image. This method allows us to obtain pictures on several intact cell layers. Some pictures were obtained with an ×40 LD C‐Apo 1.1NA W or an ×63 Plan Apo 1.4 NA oil objective to observe the morphology of the nuclei.
The mitotic index was used to evaluate the cytotoxic potential in each of the experimental conditions. It was calculated as the percentage of cells undergoing mitotic stages (metaphase, anaphase, and telophase) in at least 1000 cells of meristem tissues observed per root apex and three root apexes analyzed by plant (i.e., ∼3000 cells/plant and 10 000–12 000 cells/condition). In complement to the mitotic index, quantitative analysis of nucleoli has also been proposed as a sensitive biomarker for routine monitoring of cytotoxicity in plants (Arkhipchuk et al., 2000; Lima et al., 2019). In the present study, nucleolar alterations were determined by counting the number of nucleoli per nucleus and expressed as a percentage of approximately 1000 nuclei of root meristem cells per condition (Singh et al., 1988). Cell counting was performed using the Cell Counter plugin in ImageJ‐1.53a software.
Statistical analysis
The differences in tail DNA (in fish), mitotic index, and nucleolar activity (in plant) among the different experimental conditions were evaluated by one‐way analysis of variance, followed by Tukey's post hoc test. Data were arcsine‐transformed, and average values per individual were used in the statistical analysis. The normality and homogeneity of variances were graphically confirmed and evaluated by the Shapiro‐Wilk and Levene's tests. In addition, a nonparametric Spearman's correlation analysis was used with concentrations of trace elements in samples of water collected in the two locations prior to the experiment. All statistical analyses were performed in R, Ver 3.6.3, using the packages “car” and “stats,” while the package “ggplot2” was used to create graphics. The level of significance for statistical analyses was always set to α = 0.05. If not specified, the results are expressed as mean ± SD.
RESULTS
DNA damage in fish and plants
Comet assay in fish
After 72 h of exposure, no mortality was recorded in control and experimental conditions (i.e., water from the urban and rural marshes). Comet assays in blood cells (Figure 2) revealed significant differences in DNA strand breaks between conditions with high variability among individuals (p < 0.001). The genotoxicity detected in fish (n = 5) from the two marshes (mean ± SD 43.7 ± 25.8%, median 42.1% for the urban marsh; mean ± SD 39.2 ± 26.6%, median 36.3% for the rural marsh) was lower (p < 0.001) than that found in the positive control group (i.e., fish exposed to EMS; mean ± SD 64.1 ± 24.1%, median 71.9%) but higher (p < 0.001) than the DNA strand breaks found in the negative group (i.e., fish kept in tap water; mean ± SD 25.3 ± 22.8%, median 17.1%; Figure 2A). The DNA strand breaks in fish exposed to water from the two marshes were then compared with the damage detected in control conditions and confirmed by observations of DNA degradation in erythrocytes by epifluorescence microscopy (Figure 2B).
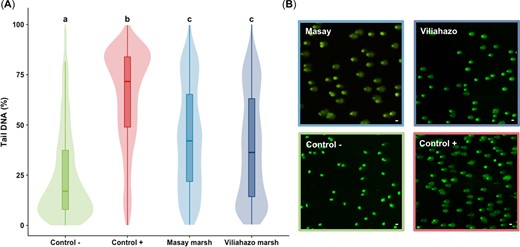
(A) Percentage of damage to the DNA of erythrocytes of Oreochromis niloticus exposed to tap water (negative control), ethyl methanesulfonate (positive control), and water taken from the urban (Masay) and rural (Viliahazo) marshes (n = 5 fish per condition, 400 measurements performed per fish) presented as box plots and violin plots (i.e., probability density of the data at different values). Lowercase letters denote significant differences (p < 0.05) between experimental conditions. (B) Degradation of DNA in O. niloticus erythrocytes by epifluorescence microscopy. Scale bar = 20 μm.
Mitotic index and nucleolar characteristics
Cytotoxicity was assessed by determining both the mitotic index and nucleolar alterations in plants (Figures 3 and 4). Significant differences were found in the mitotic index estimated for the cells of meristem tissues in the root apex of A. cepa between the experimental conditions (p < 0.001). Pairwise comparisons revealed that the mitotic index in the plants exposed to water sampled from the urban and rural marshes differed significantly (p = 0.035), with values of 1.18 ± 0.75 (n = 4 plants) in plants exposed to water taken from the urban marsh and 3.02 ± 0.64 in plants exposed to water taken from the rural marsh. Interestingly, while the mitotic indices were similar (p = 0.99) in plants exposed to water taken from the rural marsh and in plants exposed to tap water (i.e., negative controls), the mitotic indices of the plants exposed to water taken from the urban marsh were similar to the indices observed when plants were exposed to EMS (i.e., positive controls; p = 0.345; Figure 3). These results show that the mitotic index was only affected by exposure to water taken from the urban marsh. Significant differences were observed between the experimental conditions in the proportion of cells with three or more nucleoli per nucleus (p < 0.001). Nucleolar activity in plants exposed to water taken from the two marshes did not differ from the negative control (p ≥ 0.07), but the proportion of cells with three or more nucleoli per nucleus was lower in the rural marsh than in the urban marsh (i.e., 1.4 ± 0.7% vs. 12.0 ± 6.0%; p = 0.027; Figure 4).
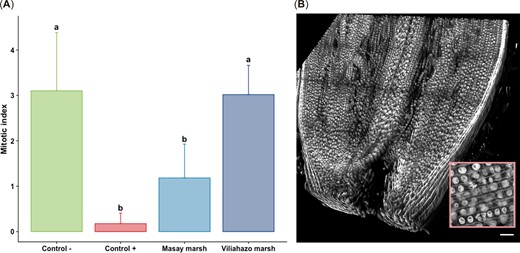
(A) Mitotic index of the root meristem cells of Allium cepa bulbs (n = 4 per condition, three measurements performed per bulb) exposed to tap water (negative control), ethyl methanesulfonate (positive control), and water from the urban (Masay) and rural (Viliahazo) marshes investigated. Lowercase letters denote significant differences (p < 0.05) between experimental conditions. (B) Three‐dimensional image of the meristem region used to calculate the mitotic index from a Z‐stack of 109 optical slices and tile scan function (frame size 1570 × 1570 × 110 µm) in the root apex. Inset: Magnified view of a portion of meristem cells showing some mitosis. Scale bar = 100 µm. Values are means ± SD.
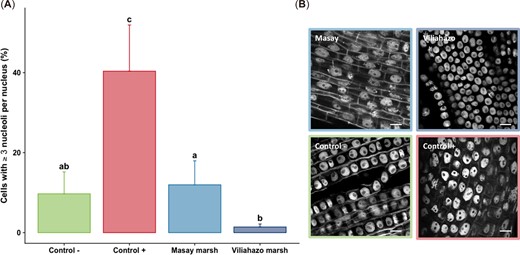
(A) Proportion of cells with three or more nucleoli per nucleus in meristem cells of Allium cepa roots (from n = 4 bulbs per condition) exposed to tap water (negative control), ethyl methanesulfonate (positive control), and water from urban (Masay) and rural (Viliahazo) marshes investigated. Lowercase letters denote significant differences (p < 0.05) between experimental conditions. (B) The nucleus of root meristem cells in each experimental condition. Four bulbs were used per experimental condition. Scale bar = 10 μm. Values are means ± SD.
Correlations between cytogenotoxicity and concentrations of trace elements in the water
The results of water quality measurements and trace element analysis are given in Table 1. Spearman's correlations revealed no significant correlations between cytogenotoxicity results (comet assay in fish, mitotic index and nucleoli activity in plant) and the concentrations of trace elements in water (p ≥ 0.13). Among the trace elements we investigated, concentrations of the nonessential elements (i.e., As, Ni, and Pb) in the unfiltered water were always <1 µg L−1 (Table 1).
Summary of water quality parameters and trace elements measured for the tap water (negative control) and water from urban (Masay) and rural (Viliahazo) marshes
| Treatment | ||||
| Parameter | n | Tap water (negative control) | Masay | Viliahazo |
| Water parameters | ||||
| Temperature (°C) | 5 | 22.2 ± 0.6a | 22.0 ± 0.5a | 22.0 ± 0.4a |
| DO (mg L−1) | 4 | 4.7 ± 1.0a | 5.1 ± 0.8a | 5.4 ± 0.3a |
| pH | 5 | 6.1 ± 0.2a | 6.9 ± 0.2b | 5.9 ± 0.2ac |
| Conductivity (µS cm−1) | 5 | 182 ± 50a | 346 ± 38b | 89 ± 33c |
| BOD5 (mg L−1) | 1 | 1.25 | 1.80 | 1.81 |
| Trace elements | ||||
| Cr (µg L−1) | 1 | 0.13 | 0.24 | 0.22 |
| Mn (µg L−1) | 1 | 12.42 | 57.22 | 16.43 |
| Fe (µg L−1) | 1 | 19.14 | 44.72 | 14.35 |
| Co (µg L−1) | 1 | 0.20 | 0.38 | 0.11 |
| Ni (µg L−1) | 1 | 0.46 | 0.67 | 0.40 |
| Cu (µg L−1) | 1 | 1.48 | 1.19 | 0.98 |
| Zn (µg L−1) | 1 | 69.71 | 10.58 | 38.46 |
| As (µg L−1) | 1 | 0.07 | 0.21 | 0.05 |
| Pb (µg L−1) | 1 | 0.76 | 0.19 | 0.63 |
Values are means ± SD. No data were recorded after ethyl methanesulfonate addition in tap water in the positive control, to avoid contamination of the instruments. Letters denote significant differences (p < 0.05) between experimental conditions.
BOD5 = biochemical oxygen demand after 5 days; DO = dissolved oxygen.
DISCUSSION
To the best of our knowledge, this is the first time cytogenotoxic effects of aquatic environments have been assessed in Madagascar. We combined different approaches for one species of fish (O. niloticus) and one species of plant (A. cepa) to evaluate the levels of cytogenotoxic pollution in two marshes, one located in an urban area and one in a rural area of the Malagasy highlands. Such investigation is needed to highlight the interest of implementing ecotoxicity assessment tools in the management of surface water in Madagascar.
The alkaline in vivo comet assay can be used to detect DNA breaks in aquatic species following exposure to genotoxics (Frenzilli et al., 2009) and is recommended for use by regulatory agencies (Speit et al., 2015). The Nile tilapia is known to respond rapidly to environmental alterations (Vijayan et al., 1997), making it a good candidate for genotoxic studies, while the erythrocyte‐based comet assay has already been successfully used for cytogenotoxicity assessments (de Campos Ventura et al., 2008; Christofoletti et al., 2009; Hemachandra & Pathiratne, 2016; Matsumoto et al., 2006). Cytogenotoxic effects can be detected very soon after exposure to contaminated waters. For instance, using the comet assay, cytogenotoxic effects have been detected in common carp (Cyprinus carpio) after 24 h of exposure to industrial plant effluents (SanJuan‐Reyes et al., 2015), while Matsumoto et al. (2006) found genotoxicity and mutagenicity in Nile tilapia exposed for 72 h to water contaminated with tannery effluents.
In the present study, we found that a greater cytogenotoxicity was induced by the contaminants in the water taken from the urban and rural marshes we investigated when compared with the negative control condition. According to de Souza Trigueiro et al. (2021), the median value of the percentage of DNA damage in the tail suggested that most of the damage was minimal or low for fish coming from the negative control condition, while fish exposed to the water from the two marshes exhibited mostly high damage. Such genotoxic effects in fish can lead to several cellular and physiological alterations, such as mutations causing changes in the life span and functions of circulating erythrocytes as well as cell death (Çavaş & Könen, 2007; da Silva et al., 2019; de Souza Trigueiro et al., 2021). The slight changes observed in the genotoxicity results between the two marshes combined with the absence of correlations between comet assay results and concentrations of trace elements suggest that (1) the genotoxic agents involved are not trace elements; (2) the genotoxic agents are present in both the urban and rural marshes, although probably not at the same concentrations in the marshes; and/or (3) the genotoxic effects observed were not caused by the same contaminants in the two locations.
The A. cepa test is one of the most efficient, feasible, and low‐cost methods for the assessment of the cytogenotoxic effects of mixtures of contaminants in aquatic environments (Leme & Marin‐Morales, 2009). In the A. cepa test, a decrease in the mitotic index in the root tip cells points to cytotoxicity, while induction of chromosomal abnormalities, micronuclei, and nuclear buds in the root cells indicate cytogenotoxicity and can also be used to check for mutagenicity (Leme & Marin‐Morales, 2009). In the present study, we combined measurement of the mitotic index and observations of nucleolar abnormalities with a focus on the number of nucleoli per nucleus.
Nucleolar activity is sometimes considered to be a more sensitive parameter than the parameters mentioned above in cytotoxicity studies (Lima et al., 2019). In A. cepa, some trace elements, including Al, Cd, Cu, and Pb, have been reported to disrupt the synthesis of ribosomal RNAs but also to inhibit nucleolus reconstruction at the end of the telophase (Jiang et al., 2014; Qin et al., 2010; Wang et al., 2016). At the root apex, the nuclear cells mainly have two nucleoli, which sometimes merge at the end of the telophase (Jiang et al., 2014). Thus, observations of three or more nucleoli per nucleus in root meristem cells point to cytotoxicity (Lima et al., 2019). The 3D images obtained thanks to multiphoton microscopy allowed us to observe the nuclei in all their thickness and to count the exact number of nucleoli, which are not always in the same plane in each nucleus, unlike what is visible in the two‐dimensional images commonly used for such measurements. Overall, the mitotic index and nucleolar activity measured in A. cepa indicated potential cytotoxicity of urban marsh water that primarily inhibited cell division, whereas no cytotoxicity of rural marsh water was found.
Cytogenotoxicity tests performed in fish and plants pointed to increasing toxicity effects ranked as follows: tap water (negative control) ≤ rural marsh ≤ urban marsh ≤ EMS (positive control), with several discrepancies between the comet assay performed in fish and the other cytotoxicity markers in plants. There are several possible explanations for these differences. Physical barriers in plants (i.e., cell walls and plasma membrane of the root) can prevent certain chemicals from entering, whereas in fish chemicals present in the water can enter the body directly (Matsumoto et al., 2006). Furthermore, depending on the contaminants involved and their respective concentrations, cytogenotoxic effects may occur in fish but not in plants. Radić et al. (2013) found that although genotoxicity responses to the exposure of fertilizer factory effluents were mostly in agreement in common carp and duckweed (Lemna minor), several discrepancies were observed. The authors linked these to differences in the sensitivity of model organisms or in experimental conditions.
The trace elements measured in the samples of water collected from the two marshes and from drinking water were within the Malagasy drinking water standards (Ministère de l'Eau, de l'Assainissement et de l'Hygiène, 2004) and do not exceed the World Health Organization guidelines for drinking water quality (World Health Organization, 2017). Nevertheless, both in vivo test systems (fish erythrocyte and A. cepa root‐based tests) confirmed the cytogenotoxicity of the marshes' waters. The absence of correlations with the trace elements in water suggests that the cytogenotoxic effects are not due to only one of the elements measured. However, because our chemical characterization of these water samples was not comprehensive, it is difficult to conclude on the actual chemical contamination status because a complex mixture of chemicals at trace concentrations can have cytogenotoxic impacts. In addition to trace elements (Barbosa et al., 2010), a wide range of contaminants can have cytogenotoxic effects that are likely to be present in Madagascar and potentially in our study locations.
Anthropogenic activities produce other contaminants of concern in Madagascar, including persistent organic pollutants that are likely to have cytogenotoxic effects (Baqar et al., 2017). Through a screening of environmental pollutants in wastewaters, Rasoazanany (2008) found that, by comparison to the rural environment, the urban environment of Antananarivo is disrupted by polluting elements including Cr and Pb. The pollutants occurring in an urban area and a rural area may differ. The agricultural practices used in cultivating vegetable crops in the vicinity of the rural marsh (Figure 1) included slash and burn, which may leach toxic pyrrolizidine alkaloids into the soil (Letsyo et al., 2021), and the use of pesticides, which could also explain the cytogenotoxic effects observed in this water body. A more comprehensive data set of contamination levels of Malagasy water bodies is needed to fully explain our observations.
It has also been shown that the toxicity of surface water can vary with the season (Wu et al., 2004). Meteorological and hydrological factors may greatly affect water quality. In the present study, the experiment was performed during the rainy season. We can thus hypothesize that rains may dilute pollutants dissolved in the water. Further investigations carried out during the dry season would be relevant to assess such changes. Indeed, several studies performed in tropical areas highlighted that induction of DNA damage in fish erythrocytes and gill tissues is higher in summer than in winter (Nagpure et al., 2015; Scalon et al., 2013). Our findings suggest that, although specific priorities need to be considered depending on countries, cytogenotoxicity assessments in tropical areas should consider potential seasonal or time‐specific changes, especially in the context of global climate change.
CONCLUSION
All of the bioassays we performed revealed cytogenotoxic potential, particularly in the marsh that received urban, industrial, and artisanal waste from the capital city Antananarivo. We demonstrated the interest in using fish and plant tests combined to assess cytogenotoxicity. Indeed, while the comet assay performed on fish erythrocytes showed genotoxicity for both marshes, the tests on A. cepa showed differential cytotoxicity between the waters from the two sources. The present study provides scientific evidence for the urgent need to include ecotoxicity assessment tools in the management of surface water used for human activities in Madagascar. In addition, the present study shows that in vivo test systems combining fish and plants are efficient in low‐income countries where comprehensive water quality monitoring programs can be complex to achieve because of limited resources.
Acknowledgments
We are most grateful to M.‐C. Raivomanana and F. Andrianarimandimby (Centre National de Recherche Appliquée au Développement Rural, Madagascar), M. Lorcin (Institut national de recherce et de sécurité), M. Canonne (Centre de coopération internationale en recherche agronomique pour le développement [CIRAD]), and M. Lartaud (CIRAD) for their technical assistance and to H. de Verdal (CIRAD) for his advice on the experimental procedures implemented for animal welfare. We are also grateful to the nongovernmental organization APDRA Pisciculture Paysanne for technical and logistic assistance before or during fieldwork in Madagascar. We acknowledge the imaging facility Montpellier Ressources Imagerie, member of the national infrastructure France‐BioImaging, supported by the French National Research Agency (ANR‐10‐INBS‐04). We are grateful to the CIRAD Water, Soil and Plant Analysis Laboratory (US Analyses, CIRAD, Montpellier, France) for the analyses of trace elements. This is publication ISEM 2023‐048.
Author Contributions Statement
Elodie Pepey: Conceptualization; Methodology; Formal analysis; Investigation; Writing—original draft; Supervision; Writing—review & editing; Funding acquisition. Geneviève Conéjéro: Conceptualization; Methodology; Formal analysis; Investigation; Writing—original draft; Visualization; Writing—review & editing; Funding acquisition. Elia Njara Ndrianaivo: Investigation; Resources. Jean‐Luc Verdeil: Methodology; Formal analysis; Writing—review & editing. Jean‐Michel Mortillaro: Resources; Writing—review & editing. David Boggio: Software; Formal analysis. Modestine Raliniaina: Resources. Simon Pouil: Conceptualization; Formal analysis; Writing—original draft; Visualization; Writing—review & editing.
Data Availability Statement
The data and methodology supporting the results of the present study are available within the article. Regarding the cytogenotoxicity data, the nature of our study did not generate large data sets requiring the use of data repositories. However, the corresponding author (E. Pepey; [email protected]) may be contacted for further inquiries regarding the data.
