


Abstract
Plant uptake of pharmaceuticals and personal care products (PPCPs) has been recognized as a potential path to human exposure. Most existing regressions and uptake models are limited to neutral organic compounds, but 80% of pharmaceuticals and an unknown number of personal care products ionize under environmentally relevant conditions. A widely used generic plant uptake model was expanded step‐by‐step with processes relevant for weak and strong acids and bases, such as ionization, membrane permeability, ion trap, phloem transport, and sorption to proteins. The differential equation system was solved analytically, and the equations were implemented in a spreadsheet version. The changes in predicted plant uptake of neutral substances, acids, and bases were found for a range of key input data (log KOW, pKa, pH, sorption to proteins). For neutral compounds, sorption to proteins and phloem transport are of relevance only for the more polar compounds (low log KOW, ≤2). Weak acids (pKa ≤6) are trapped in phloem due to pH‐related effects, and in roots when pH in soil is low (pH 4–5). Cations sorb stronger and hence show less bioavailability and less translocation than anions. Sorption to proteins reduces translocation to leaves and fruits for all substances, but this is more evident for polar and ionic compounds that have negligible sorption to lipids. The new generic model considers additional processes that are of relevance for polar and ionizable substances. It might be used instead of existing standard approaches for chemical risk assessment and assessment of the environmental fate of PPCPs. Environ Toxicol Chem 2023;42:793–804. © 2023 The Authors. Environmental Toxicology and Chemistry published by Wiley Periodicals LLC on behalf of SETAC.
Abstract

INTRODUCTION
Pharmaceuticals and personal care products (PPCPs) have been found all over the world (aus der Beek et al., 2016; Tran et al., 2018) and reach agricultural fields in high amounts with sewage sludge or biosolids (Prosser et al., 2014) or by irrigation with reclaimed wastewater (Delli Compagni et al., 2020; González García et al., 2019; Polesel et al., 2015). In the latter case, sorption and plant uptake are competing processes, with little time for aging and biodegradation, and thus high bioavailability. Among the most pressing research questions for PPCPs is “How can the uptake of ionizable PPCPs into aquatic and terrestrial organisms and through food chains be predicted?” (Boxall et al., 2012). It was concluded that “improved models should be developed for estimating uptake of ionizable PPCPs into organisms and through food chains,” and major obstacles and key research questions to derive such models were addressed in Carter et al. (2022).
Plant uptake of chemicals has been recognized as an important path to human exposure (Paterson et al., 1990). Evaluative models for plant uptake have been developed for neutral compounds (Trapp & Matthies, 1995) and are routinely applied in chemical risk assessment (European Commission [EC], 2003) as well as in risk assessment of contaminated sites (Jeffries & Martin, 2009). At the time when these generic models were developed, the focus of environmental chemistry was on persistent organic pollutants with high partition coefficients, for example organo‐chlorine compounds. Novel analytical methods targeting polar and ionic compounds in environmental matrices such as high‐performance liquid chromatography and liquid chromatography‐mass spectrometry led to the discovery of numerous polar and ionized substances in the environment (Kolpin et al., 2002; Ternes, 1998), among them many PPCPs (Halling‐Sørensen et al., 1998). According to Manallack (2007), the vast majority of medical drugs (62%–95%) are ionizable substances, with pKa values in the environmentally relevant range from 2 to 12. Most of these are monovalent bases, but many are also acids or ampholytes (Newton & Kluza, 2016). Frequently, personal care products such as detergents are cationic or anionic. For example, permanently charged quaternary ammonium compounds are used as antimicrobials and disinfectants. Another frequent source of organic electrolytes and ions in the environment is early degradation products of xenobiotic compounds, which very often contain a charged group.
Terrestrial plants collect water and solutes from soils and gases from air and are thus by design wide open to their environment, therefore chemicals can enter plants both from soil and from air. Chemicals that pass the root cortex reach the vascular system and may be translocated with the transpiration stream to leaves. However, lipophilic compounds sorb to soil organic matter (Karickhoff, 1981) and to root tissue (Trapp, 2002) and hence are not efficiently translocated upwards within xylem (Trapp, 2007), while very polar compounds (log KOW ≤−2) have uptake limitations at the biomembranes (Kleier, 1988; Trapp, 2004). Xylem flow shows large diurnal fluctuations, while phloem flow remains almost constant (Windt et al., 2006). During the day, measured phloem to xylem flow ratios ranged from 0.02 to 0.1. Ratios during night were 0.19 for poplar, 0.37 for castor bean, 0.55 for tobacco (0.55), and only 0.04 for tomato (Windt et al., 2006; a constant phloem to xylem flux ratio of 0.1 was chosen for the simulations). Hence, phloem transport out of the leaves is inefficient for most neutral compounds because their concentration in phloem is similar to that in xylem, and xylem flow is stronger and with the opposite flow direction (Kleier, 1988).
Weak electrolytes are present in neutral and in ionic form, and the two molecule types show very different chemodynamics. Ions are always more polar than the corresponding neutral molecules, undergo electrical attraction or repulsion, have no measurable vapor pressure and are more easily attacked by enzymes (Trapp et al., 2010). Moreover, the membrane permeability of neutral and ionic molecules differs (1000–10 000 times slower for ions; Kleier, 1988; Trapp, 2004), hence ions can be trapped inside cells if the degree of ionization differs (Briggs et al., 1987; Bromilow & Chamberlain, 1995; Inoue et al., 1998; Rendal et al., 2011a, b). Plant compartments vary widely in pH: vacuoles of plant cells and xylem sap are acidic (pH 4.5–5.5), the cytosol is close to neutral pH (pH 7–7.4), while phloem sap and mitochondria are alkaline (pH 8). Thus, weak bases (pKa 8–10, “alkaloids” such as nicotine, fluoxetine, and morphine; Newton & Kluza, 2016) are retained in vacuoles (Hofstetter et al., 2018) and mitochondria (Horobin et al. 2007), while weak acids may be preferably translocated in the phloem (Briggs et al., 1987; Bromilow & Chamberlain, 1995; Kleier, 1988). It is likely but has not yet been shown experimentally that in a similar way, uptake into chloroplasts (pH 4.5 outside but pH 8 inside) is affected.
From this brief description of processes it becomes obvious that modeling and simulation of the uptake and transport of PPCPs into plants needs to take into account the ionizable nature of those compounds. In the present study, additional processes beyond those for purely neutral compounds have been formulated and parameterized. Comparison with the widely used standard approach for neutral chemicals with identical data sets allowed mathematical verification of the new implementation and showed for which range of chemical properties (log KOW, pKa, charge) the predictions differ.
The PPCP model is not intended to replace existing complex, fully dynamic models such as Rein et al. (2011), Prosser et al. (2014), and Brunetti et al. (2019) for neutral compounds and Polesel et al. (2015), Delli Compagni et al. (2020), and Brunetti et al. (2022) for ionizable compounds. Although these models were derived from the same basic processes and equations, they require site‐specific environmental input data in high spatial and timely resolution, and the underlying equations need to be solved numerically. The PPCP model can simulate the same processes as these earlier, complex model formulations (including ionization, ion trap, and phloem transport), but input parameters were kept constant over time and the mass balance equation were rearranged in a way that enabled a compact analytical solution of the underlying differential equations for the first time with phloem transport to roots and fruits. This considerably reduced the data effort and allowed implementation as a spreadsheet solution as a prerequisite for easy handling. It is expected that the new PPCP model for ionizable substances can be substituted for existing easy generic approaches used in chemical risk assessment and for contaminated site risk assessment (Jeffries & Martin, 2009; Legind & Trapp, 2008; Trapp & Matthies, 1995), which were designed for neutral compounds only.
MODELS AND METHODS
Model structure of the standard model for plant uptake of neutral compounds
The standard model for plant uptake of neutral substances was used as the starting point. It is based on the generic plant uptake model published in 1995 (Trapp & Matthies, 1995) but has been expanded for growing roots (Trapp, 2002), fruits (Trapp, 2007), and specific crop types (Legind & Trapp, 2008). The standard model considers partition processes and unidirectional flux with water from roots to leaves and fruits within the xylem. The differential equations were solved analytically for the steady state (roots) and for harvest time (leaves, grains/corn). Default plant data were taken from Trapp (2015), with modifications (Supporting Information, Table S2). The standard model and its extension to the PPCP model are described step by step.
Step 1: Concentration in soil and soil pore water, standard approach
The concentration of the freely dissolved (bioavailable) chemical in soil pore water is calculated from the total concentration in bulk soil using the KOC:
where CW (mg/L) is the concentration of chemical in soil water and CSoil (mg/kg) is the concentration of chemical in bulk soil. ρwet is the density of wet soil, OC is the fraction of organic carbon (default 0.02 g/g), ρdry is the density of dry soil (1.32 kg/L), PW is the volume fraction of water in soil (0.3 L/L), and KOC (L/kg) is the partition coefficient organic carbon to water.
Extensions for the PPCP model
Dissociation is described by the Henderson–Hasselbalch equation:
where ϕn is the fraction of neutral molecules and ϕi is the fraction of ions, with α = +1 for acids and −1 for bases. This equation has been derived for pure aqueous solutions (I ≤ 0.01 M). In organic phases such as biomembranes, ionization is depressed (Newton & Kluza, 2016) and a correction of 1 log unit is applied both for acids (pKa +1) and bases (pKa −1).
KOC regressions for acids and bases
Generally, anions have low sorption to organic carbon, while cations, due to electrical interactions, sorb strongly to both organic matter and clay (Franco & Trapp, 2008). The regressions between log KOW and log KOC derived by Sabljić et al. (1995) for the European Union Technical Guidance Document for risk assessment of chemicals (EC, 2003) are only valid for neutral compounds. Therefore, by default, the KOC (L/kg) in the PPCP model was calculated using the regression equations of Franco and Trapp (2008) for weak organic electrolytes. Equations together with a comparison of methods are shown in the Supporting Information.
Step 2: Concentration in roots
Roots develop a large surface area to facilitate uptake of water and nutrients. Thus, for most chemicals, the concentration in solution at the entry into roots (at the root hairs) will be in equilibrium with the soil solution. Then, the mass balance equation for roots is
where mR is the mass of chemical in the roots (mg), Q is the transpiration stream in the roots (default 1 L/day), and CXy is the concentration in xylem (mg/L) at the outflow from the roots. F is a correction factor for cases where the uptake of the chemical into root cells is slower than that of water and is described below. The concentration of chemical in the roots is derived by dividing by the mass of the root MR (default 1 kg):
Living roots grow. If growth is exponential and the ratio Q/M (transpiration to plant mass) is constant, dilution by growth can be considered by a first‐order growth rate (0.1 day−1). If first‐order metabolism occurs, growth rate and metabolism rate can be added to give an overall loss rate kR (day−1):
Moreover, if the xylem sap (water) is in equilibrium with the root, the concentration of chemical flowing out of the root in the xylem, CXy, is CR/KRW, where KRW is the equilibrium partition coefficient between roots and water. Then,
Setting this to steady state (dCR/dt = 0) and solving for the concentration in the root CR gives
Partition coefficient for roots to water
In the standard model, the partition coefficient for roots to water KRW (L/kg) is calculated from
where WR is the water content of the roots (default 0.89 L/L), LR is the lipid content (default 0.025 g/g), a = 1/ρ_octanol = 1.22 L/kg is required for unit conversion, and b is a correction exponent for differences between plant lipids and octanol, based on measurements by Briggs et al. (1982) for barley (default value b is 0.85; Trapp & Matthies, 1995, erratum). This equation was used for all plant compartments to derive partition coefficients between plant tissue and water.
Correction factor F
For very polar chemicals (in particular ions), uptake into the root is slower than for water; for all others, F equals 1. The correction factor, F, is calculated according to
with F ≤ 1 (advective uptake is never faster than with water), where PR,Chem (m/s) and PR,Water (m/s) describe the membrane permeability of the root cells toward chemical and water, respectively. PR,Chem is estimated from log KOW
A default value of 2.2 × 10⁻⁹ m/s was used for the permeability of the root toward water, PR,Water. Hence, the correction factor F is only relevant for chemicals with log KOW <−2.
Extensions for the PPCP model
Diffusion across cell membranes and apparent partition coefficients in the PPCP model
In the standard model, the partition coefficient (KRW) between root cells and water is the endpoint of the diffusive exchange, the state with the highest entropy. This is different for weak electrolytes, where the neutral molecule n (acid or base) and the electrically charged ion i (anion or cation) are present at the same time. The apparent partition coefficient is the steady state of the exchange of both molecules across the cell membrane. Diffusion of neutral molecules is described by Fick's law, while diffusion of ions in an electrical field by the Nernst–Planck equation. The total flux J (mg/m2/day) from outside (out) to inside (in) the cell is the sum of both:
where P is the membrane permeability (m/s), a is the chemical activity, N is the Nernst number N = zEF/(RT), z is the valency or charge number, F is the Faraday constant (96 485 C/mol), E is the membrane potential (V), R is the universal gas constant (8.314 J/mol/K), and T is the absolute temperature (K; Trapp & Horobin, 2005; Trapp, 2004).
Membrane permeability
The permeability P is calculated by the equation (Schönherr & Riederer, 1989)
where D is the diffusion coefficient in membranes, K is the partition coefficient membrane to water, and Δx is the membrane thickness. With D = 10−14 m2/s and Δx = 50 nm, and K = KOW follows (Trapp & Horobin, 2005; unit m/s):
For the outer membrane (plasmalemma, cytosol to outside), the resistance of the cell wall (permeability 2.5 × 10⁻⁴ m/s; Trapp, 2000) was added. This equation is principally only valid for neutral compounds. By default, the approach of Trapp and Horobin (2005) is implemented in the PPCP model. These authors assumed a 3.5 log units lowered log KOW for ions and hence a 3162‐times slower membrane permeation for ions than for neutral molecules. Alternatively, the liposome–water partition coefficient Klipw has been suggested as a predictor for membrane partitioning of organic compounds (Droge, 2019; Endo et al., 2011) and might replace the log KOW. Numerical values of KOW and Klipw of neutral compounds are similar, while the difference in log Klipw between ion and neutral molecules was found to be on average only 1.09 for anions (standard 0.63) and 0.87 for cations (standard 0.61; Bittermann et al., 2016). This is less difference than for KOW and would, if implemented, lead to less pronounced ion trapping.
Correction for activity
The chemical activity a of molecules in solution is the driving force for diffusive exchange (Trapp et al., 2010). In pure water, a = γCW, where γ is the activity coefficient. Intracellular solutions have a high ionic strength (default 0.3 M) and the effective active concentration of ions is smaller than in dilute solution, while that of neutral molecules is larger. The activity coefficient of ions γi (−) is calculated using the Davies approximation:
where A is 0.5 for 20 °C and 1 atm pressure, I in cell sap is 0.3 M, and a monovalent ion has an activity coefficient γi of 0.74. The activity coefficient γn of neutral molecules is
where k is the Setchenov coefficient. With 0.3 L/mol as the default value for k, γn is 1.23.
The total concentration Ct of the electrolyte is the sum of the neutral and ionic molecules, both of which can be sorbed to tissue or freely dissolved in the cell sap. The ratio between the activity of the neutral molecule an (freely dissolved in solution) and the total concentration Ct (sum of neutral and ionic, sorbed, and free) is described by the factor fn:
where W is the volumetric water fraction, and Kn and Ki are the sorption coefficients of neutral and ionic molecules, defined below. From the Henderson–Hasselbalch equation it follows that
hence
Sorption to plant tissue
For the calculation of Kn and Ki sorption to both lipids and proteins was considered:
where L is the lipid content (see above, KRW) and b is the same correction exponent as above. KOW,i is the octanol–water partition coefficient of the ion, either calculated by chemical property estimation tools like ACD/i‐Lab or obtained from log KOW,i = log KOW,n − 3.5 (Trapp & Horobin, 2005). Sorption to proteins was estimated from the partition coefficient to human serum albumin KHSA (L/mol), which can be obtained from measurements or estimated with ACD/i‐Lab. The default value of KHSA was set to 10 000 L/mol (log KHSA is 4), which corresponds to 167 L/kg (using a molar mass of 60 000 g/mol for human serum albumin). This multiplied with the amount of protein (0–0.3 g protein/g plant fresh weight, default 0.03 g/g) giving a partition coefficient for plant‐to‐water (0.03 g protein × 167 g/g) of 5 L/kg as the default value for both the neutral and ionic fractions if no chemical‐specific number for KHSA is available.
Apparent partition coefficient
In the steady state, the net flux in and out of the cell is 0, and the concentration ratio between inside and outside the membrane (the apparent partition coefficient, KPW plant to water) is
In the PPCP model, equilibrium partition coefficients between plant and water are replaced by this steady‐state concentration ratio (Trapp, 2009). Active transport across membranes (e.g., by transporter proteins) was not considered.
Intracellular distribution
The plant model considers four membrane crossings, namely from outside into cytosol, and from cytosol into vacuoles, xylem, and phloem. Each cell consists of cytosol (9.7% volume) and vacuole (87.3% volume) plus xylem (2% volume) and phloem (1% volume). The default pH of cytosol is 7.4, that of vacuoles 5, xylem 5.5, and phloem 8. The electrical charge for cytosol to outside is −120 mV, vacuole to cytosol +20 mV, xylem is uncharged (+120 mV to cytosol), and phloem has the same charge as cytosol (10−6 mV to cytosol).
Avoidance of violation of the Law of Mass Conservation
An ion trap with elevated chemical activities of weak acids inside plants at low external pH and of weak bases at high pH was experimentally confirmed (Briggs et al., 1987; Inoue et al., 1998). These experiments were conducted in hydroponic systems. However, it is hard to imagine that the effect would occur over prolonged time periods in nonmixed soils. There, the tip of the root (root hair) would take up water and chemical from the same soil pore, and if the chemical is taken up faster than water then the concentration of the chemical in the soil pore declines. Thus, both chemical and water overall are taken up maximally at the same velocity, hence the maximum concentration ratio between xylem and outside solution KXyW was set to 1,
Step 3: Translocation and mass balances of leaves and fruits
Transpiration water is translocated from roots through the xylem to the leaves, where the water is required to keep the interior of the leaf wet while the stomata open to allow uptake of CO2 from air. Chemicals can thus move with the water and volatilize (or not) from leaves. If present in air, chemicals can also deposit on leaves:
where mL (mg) is the mass of chemical in leaves, QL is the transpiration stream to leaves (default 0.9 L/day), CXy (mg/L) is the concentration in xylem and is CR/KRW, as described above, CAir (mg/m3) is the concentration in air (no difference is made between particulate and gas form), g is the conductivity of leaves (default 86.4 m/day), A is the leaf area (5 m2, up‐ and downside), CL is the concentration in leaves (mg/kg), ρ is the leaf density (default 1000 kg/m3), and KLA (m3 air/m3 leaf) is the partition coefficient for leaves to air = K*LW/KAW, where K*LW (m3 water/m3 leaf) is equivalent to KRW × ρ/1000 and KAW is the “dimensionless” Henry's Law constant (m3 water/m3 air).
In the standard model, the equation was solved analytically for t = 60 days, with the dynamic solution
where
and
The same equation is applied for uptake into fruits (corn or grains), but with fruit‐specific parameters:
where index F refers to fruits, QF is 0.1 L/day, MF is 1 kg, AF is 1 m2, kF is 0.1 day−1, ρF is 1 kg/L, and KFA is equivalent to KLA. QF is the transpiration of water from fruits (default 0.1 L/day, sum of QF and QL equals QR). Initial concentrations CL(0) and CF(0) were set to 0.
These mass balance equations do not explicitly consider phloem flux from leaves to roots or fruits, but it is implicitly assumed that for neutral compounds concentrations in phloem and in xylem do not differ. Phloem flow in the standard model can thus be considered by subtraction from xylem flow.
Extensions of the model for PPCPs
The dissociation, chemical activity, and partition coefficients of ionizable substances were calculated as described above. Furthermore, changes are necessary for volatilization from leaves and fruits, and phloem transport out of leaves was added.
Volatilization
“Ions have no measurable vapor pressure and do not tend to volatilize. If formed in atmosphere they thus partition irreversibly to aerosol particles, fog, rain, or snow” (Trapp et al., 2010). Wet and dry deposition to leaf surfaces can easily be considered by replacing conductivity g with deposition velocity vdep (default 86.4 m/day for all molecule species, i.e., no change). Volatilization from leaf surfaces can only occur for the neutral molecules, and conductivity is multiplied with the fraction of neutral molecules ϕn at pH 7.4 (cytosol). Thus, the mass balance equation for exchange between leaves and air of ionizable substances is (analog for fruits):
Phloem flow
From the steady‐state concentration ratios between cytosol, vacuole, phloem, and xylem, apparent partition coefficients can be defined. For leaves (and fruits), the partition coefficient to water is composed of those of cytosol (Cyt) and vacuole (Vac):
Partition coefficients for phloem to leaves or fruits follow from the ratio
The change of mass in leaves due to phloem flow is
Phloem flow occurs from leaves to fruits, and from leaves to roots (each by default 10% of the transpiration stream, averaged for day and night). The loss via phloem was added to the differential equation of leaves:
The gain for roots with phloem is
and it is the same for fruits
The sum of the phloem flux to roots, QPhlo,R, and to fruits, QPhlo,F, is QPhlo out of the leaves (L/day).
The model processes are summarized in Figure 1 for the standard model and in Figure 2 for the PPCP model.
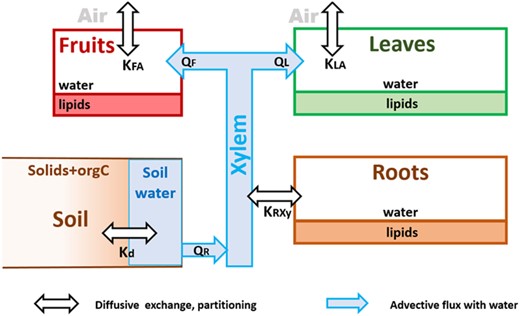
Systems graph of the standard model for plant uptake of neutral compounds, where K describes partition coefficients, Q is advective fluxes, index F is fruits, A is air, L is leaves, and R is roots. Kd is the distribution coefficient between the soil matrix and the soil pore water.
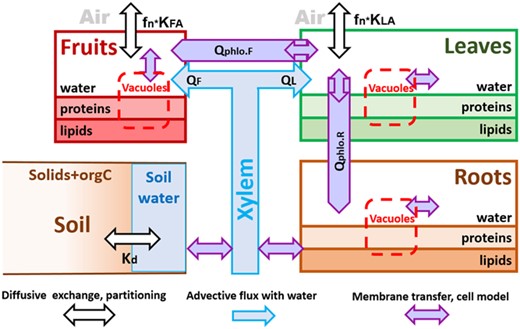
Systems graph of the pharmaceuticals and personal care product model for plant uptake of weak acids and bases, where K describes partition coefficients, Q is advective fluxes, Qphlo is phloem flux, index F is fruits, A is air, L is leaves, R is roots, Kd is the distribution coefficient between the soil matrix and the soil pore water, and fn is fraction of chemical present as neutral molecules in cytosol of leaves.
Step 4: Solution of differential equations
With constant concentrations in soil and air, the differential equations for roots and leaves of the PPCP model form a 2 × 2 matrix:
where C1(t) and C2(t) are the concentrations (mg/kg) in the root and leaves at time t (harvest time, default t = 60 days), a1 and a2 are loss rate constants from compartments 1 (roots) and 2 (leaves; day−1), a21 is the transfer rate from leaves to roots (with phloem flow), a12 is the transfer rate from roots to leaves (with xylem flow), and b1 and b2 are input terms (mg/kg/day) from soil or air. The analytical solution for this 2 × 2 linear ordinary differential equation system is found in Nazaroff and Alvarez‐Cohen (2001). With index 1 for roots and index 2, the matrix elements are:
After the concentrations of PPCP in roots and leaves are obtained, the differential equation for concentration in fruits can be solved analytically, either for steady state
where I is the sum of all input terms
and k is the sum of all loss terms
or for concentrations at t2 (t2 = 0 is t, end time for roots and leaves)
With default growth rate of fruits k is 0.1 day−1, concentrations are at 99.8% of steady state for a harvest time t2 of 60 days.
SIMULATION RESULTS
All calculations were made with a chemical concentration in bulk soil of 1 mg/kg. The calculated concentrations in roots, leaves, and fruits (corn) are thus equivalent to bioconcentration factors plant‐to‐soil, similar to root concentration factors (RCFs) and leaf concentration factors. All concentrations are given for fresh weight (mg/kg fresh wt).
Neutral compounds
Figure 3 shows the simulation result for a neutral compound with log KOW 0–6 done with the standard model and with the new PPCP model (to simulate a neutral compound, a base with pKa 0 was simulated, 100% neutral in all compartments). Both models predict the highest concentrations for polar neutral compounds and for leaves. Predicted concentrations in corn are the lowest. However, the PPCP model predicts higher concentrations in roots and lower ones in leaves than the standard approach: sorption to proteins reduces upwards translocation in xylem and addition of phloem flow leads to transport downwards. These processes most stringly affect polar compounds with low log KOW. The PPCP model and standard model give identical results if the extensions are turned off by setting ionic strength I in plant and soil to 0 M, and without sorption to proteins (KHSA = 0) and phloem flux (QP = 0). The changes due to the individual processes are displayed in Supporting Information, Figure S3.
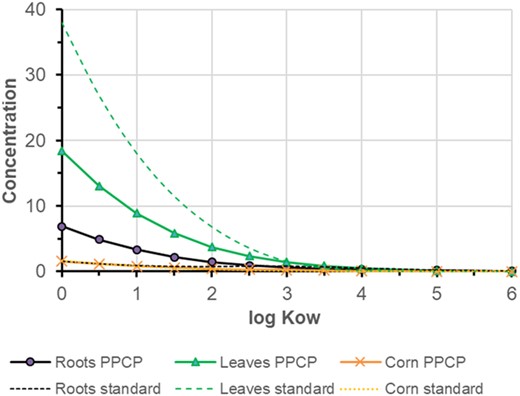
Comparison of the standard model with the pharmaceuticals and personal care product (PPCP) model for neutral, nonvolatile compounds with varying partition coefficient octanol to water log KOW. In the PPCP model, ionic strength was set to 0.3 M, phloem flow was 10% of xylem flow (both to roots and corn), and adsorption to proteins was considered with a protein content of 0.03 g/g and log KHSA = 4.
Weak acids
For acids, simulations were made for a constant log KOW at 2 and variable pKa ranging from 2 to 12 and pH in soil solution of 5 and 7 (Figure 4). The pKa affects the result of the standard model because the KOC of the anion is lower than that of the neutral acid (Franco et al., 2009). Thus, predicted concentrations in plants for weak acids are higher when pKa < pH soil. The 2 × 2 PPCP model shows a different pattern. Uptake into roots is high for acids with low pKa when the pH in soil is much lower than in cytosol (pH 7.4), at soil pH 5. This is due to the ion trap effect of acids, which is strongest in the pKa range 3–6. There is no such effect at soil pH 7; on the contrary, weak acids (pKa ≤7) are excluded from roots because they are more ionized outside the root. For acids with pKa > 8, soil pH has no influence.
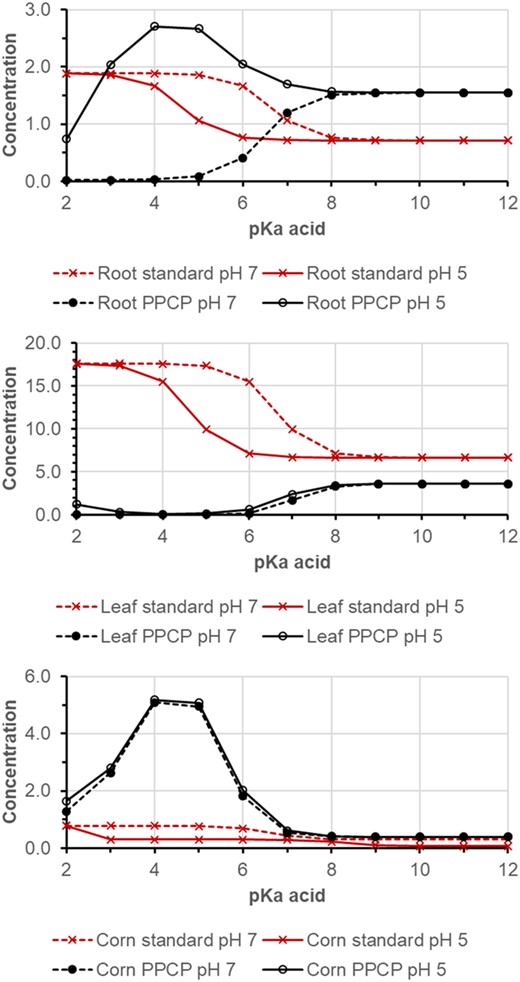
Simulation result for a weak acid with log KOW (neutral) 2 and pKa from 2 to 12 at soil pH 5 and 7. Top, roots; middle, leaves; bottom, corn. PPCP = pharmaceuticals and personal care product.
The pH in xylem (pH 5.5) is lower than in cytosol, and the concentration ratio xylem‐to‐root and hence translocation to leaves is small for weak acids with pKa < 7. On the contrary, an ion trap occurs in phloem (pH 8) and weak acids with pKa ≤ 7 are translocated in phloem from leaves to roots and corn. Predicted concentrations of weak acids in corn are elevated, compared with the standard model, with maximum at pKa 4–5.
The result of the PPCP model is very sensitive the toward pH and pKa of acids, but also to the flow of phloem and sorption to proteins, parameters and processes which were not considered in the traditional standard model. High accumulation in leaves of strong acids (pKa 2) is predicted by both models. In fact, Blaine et al. (2014) observed for short‐chain perfluorinated acids bioconcentration factor (BCF) shoots >10 kg/kg in radish, celery, pea, and tomato shoots. Nonetheless, further validation of the fate in plants of predominantly ionized acids is required (Carter et al., 2022).
Weak bases
Figure 5 shows simulation results for weak bases with log KOW (neutral) of 2 and pKa varying from 2 to 12 for soil pH 7 and 9. Cations sorb more strongly to organic carbon in soil than their neutral base counterpart (Franco & Trapp, 2008). Hence, with the standard model, calculated concentrations in roots, leaves, and corn are higher for bases with pKa < pH soil, where the neutral fraction dominates in soil. Overall, predicted concentrations for bases and cations in plants are lower than for acids and anions due to the higher KOC of bases. Several pH‐related effects modulate this pattern in the PPCP model. When soil pH is at 9 and thus above the pH of cytosol (pH 7.4), an ion trap leads to elevated concentrations of weak bases with pKa 6–9 in roots. Phloem translocation to corn is inhibited by an opposite ion trap effect: pH in phloem sap is 8, and bases with intermediate pKa from 6 to 9 are more neutral in phloem than in cytosol and vacuoles.
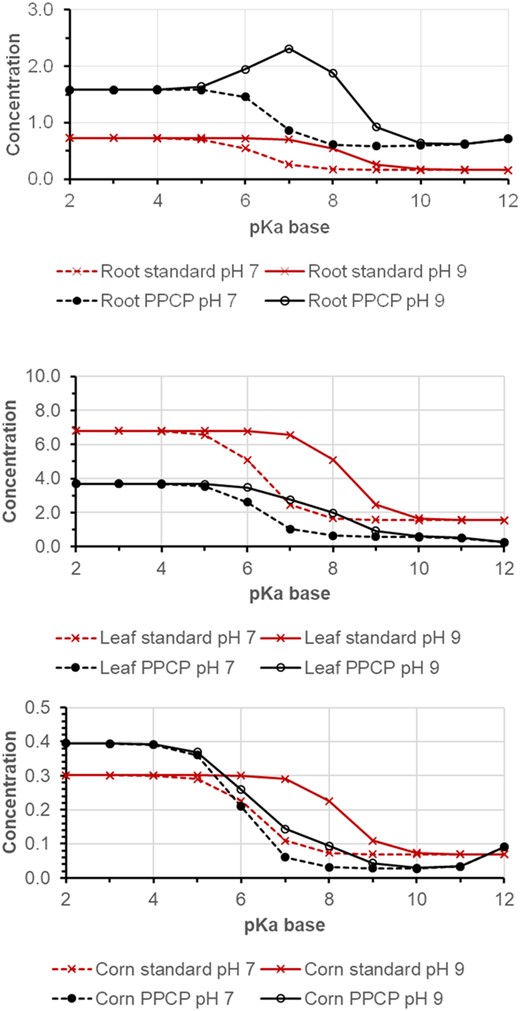
Simulation result for a weak base with log KOW (neutral) 2 and pKa from 2 to 12 at soil pH 7 and 9. Top, roots; middle, leaves; bottom, corn. PPCP, pharmaceuticals and personal care product.
Sorption to proteins
Sorption to proteins is of relevance for bioaccumulation of organic chemicals (Endo et al., 2011, 2012), and even more so for ions that show negligible lipophilic sorption (Henneberger et al., 2016a, 2016b). The weak acid ketoprofen (molar mass 254.28 g/mol, CAS 22071‐15‐4, pKa 4.1, log KOW neutral 3.1, KAW 10−9 L/L) had the highest KHSA (105.51 L/mol) of the test chemicals in González García et al. (2019). At soil pH 5, ketoprofen is mostly ionized. Without sorption to proteins, a very effective translocation to corn would be predicted, accelerated by the ion trap in phloem (Table 1), while the standard model without phloem transport and protein sorption would predict translocation to leaves (similar to Figure 4). With a default protein content of 0.03 g/g, ketoprofen is retained in roots, but predicted concentration increases also in leaves due to reduced phloem transport out of leaves, while the predicted concentration in corn is 50 times lower. With increasing protein content, most ketoprofen is retained in roots. This result is in accordance with experimental findings (Dodgen et al., 2013; González García et al., 2019; Tanoue et al., 2012).
Calculated concentration of the weak acid ketoprofen in roots, leaves, and corn (mg/kg) at soil concentration 1 mg/kg and soil pH 5 for varying content of protein in the plant tissue
| Standard model (no protein) | PPCP model 0 g/g protein | PPCP model 0.03 g/g protein | PPCP model 0.18 g/g protein | |
| Roots | 2.0 | 0.8 | 3.9 | 4.2 |
| Leaves | 5.2 | 0.3 | 0.6 | 0.2 |
| Corn | 0.23 | 10.0 | 0.2 | 0.03 |
| Standard model (no protein) | PPCP model 0 g/g protein | PPCP model 0.03 g/g protein | PPCP model 0.18 g/g protein | |
| Roots | 2.0 | 0.8 | 3.9 | 4.2 |
| Leaves | 5.2 | 0.3 | 0.6 | 0.2 |
| Corn | 0.23 | 10.0 | 0.2 | 0.03 |
PPCP = pharmaceuticals and personal care product.
DISCUSSION
Differences in predictions between the standard model and the PPCP model
The standard model and the new PPCP model show the same tendency (and in fact, the same outcome with the same input data) for the plant uptake of neutral compounds (Figure 3 and Supporting Information, Figure S3). Also for bases, the predictions are relatively similar in tendency (Figure 5). Large differences are, however, seen in the predictions of plant uptake of weak to moderate acids (pKa ≤ 6; Figure 4), where the PPCP model predicts strong dependency on soil pH for uptake into roots, loss from leaves via phloem transport, and more efficient translocation to corn. Many PPCPs are weak acids (e.g., pain killers like ketoprofen, ibuprofen, and diclofenac) and experimental studies could be conducted to verify these predictions.
Comparison with observed plant uptake of PPCPs
According to the model simulations (Figure 3), the ideal neutral organic compound for uptake from soil and accumulation in terrestrial plants is polar (−2 < log KOW ≤ 2.5), with low vapor pressure (to avoid loss to air) and persistent. An example for such a compound is sulfolane, a detergent with log KOW −0.77, which showed a 165‐fold accumulation in leaves (Doucette et al., 2005). Another example is carbamazepine, a pharmaceutical with log KOW of 2.22 and well‐documented plant uptake (Goldstein et al., 2014; González García et al., 2019; Malchi et al., 2014). Lamotrigine showed less uptake into vegetables than carbamazepine, despite similar lipophilicity and molar mass, which was explained by its alkaline nature (pKa base 5.34; Goldstein et al., 2014). Another polar and nonvolatile substance is the insecticide imidacloprid (log KOW 0.57, KAW 7 × 10⁻¹⁴ L/L, neutral, data from Ju et al., 2020), which showed efficient plant uptake and translocation in wheat plants, with highest concentrations in leaves. On the contrary, propiconazol, a far more lipophilic pesticide (log KOW 3.72, pKa 1.1, very weak base, neutral in experimental conditions) remained mostly in roots, with lower concentrations in leaves (Ju et al., 2020).
Hurtado et al. (2016a) measured the plant uptake of eight PPCPs, among them weak acids and bases. The highest concentrations in leaves were found for carbamazepine. The most relevant process determining accumulation in plants was degradation (Hurtado et al., 2016b). González García et al. (2019) conducted a study with greenhouse plants irrigated with wastewater which was spiked with the four pharmaceuticals carbamazepine (log KOW 2.30, log KHSA 3.74, neutral), ibuprofen (log KOW 3.50, log KHSA 4.42, pKa 4.3 acid), ketoprofen (log KOW 3.10, log KHSA 5.21, pKa 4.1 acid), and naproxen (log KOW 3.20, log KHSA 5.16, pKa 4.4 acid). Highest uptake into various salad plants showed carbamazepine (BCF shoot >10 kg/kg), followed by ketoprofen, naproxen, and ibuprofen (all had BCF shoot <0.5 kg/kg). As shown by Hurtado et al. (2016b), carbamazepine is degraded more slowly than ibuprofen. Ketoprofen, naproxen, and ibuprofen were mostly ionized under the experimental conditions (pH wastewater ~7) and the uptake of these weak acids was not related to log KOW.
Briggs et al. (1987) conducted a study with weakly acidic pesticides and variable pH in external hydroponic solution. RCFs as well as transpiration stream concentration factors (TSCFs) were up to 100 times higher in solutions at pH 4 than at pH 7. A similar study with weak organic bases was provided by Inoue et al. (1998). For weak bases (pKa 5.1–9.8), RCF and TSCF were far higher at high pH (pH 8 vs. 5.3).
Limitations and shortcomings
Multiple charge
In the formulation above, the cell model is limited to monovalent acids and bases (charge number z ± 1). An extension to bivalent electrolytes is described in Trapp et al. (2008). Similarly, an extension to amphophilic and zwitterionic compounds with the same formalism is possible.
Steady‐state versus kinetic solution of the cell model
The cell model can be solved with a time‐dynamic solution (Trapp & Horobin, 2005), but for the sake of less data needs and simplicity it was solved for the steady state. The comparison with the dynamic solution (see Supporting Information) reveals that kinetic limitation of translocation in phloem and xylem occurs for membrane permeabilities P < 6 × 10⁻⁸ m/s (log KOW < −0.5). For perfluoroalkyl acids, Gredelj et al. (2020) presented an extension of the standard model which considers retention at the soil–root surface.
Soil compartment
Transport and fate processes in soil were not considered in the present study, but coupling of the PPCP model to a complex soil model can be implemented as in previous approaches (Legind et al., 2012; Rein et al., 2011).
Degradation
Biodegradation is of particular importance for mostly ionized chemicals due to their slow uptake into organisms (Carter et al., 2022). Because of the lack of data, degradation rates in plants are often neglected (Jacobsen et al., 2015; Li & Fantke, 2022), which leads to bioconcentration predictions at the upper end of measured ones (Polesel et al., 2015). The average of dissipation half‐life of loss data from plants collected by Fantke and Juraske (2013) was 7 days, which corresponds to the default growth dilution rate used for roots and corn (0.1 day−1) in the PPCP model. Growth dilution is often the dominant dissipation process (An et al., 2022; Jacobsen et al., 2015).
Parameter sensitivity, variance of plant uptake of PPCPs, and uncertainty of predictions
The standard model needs eight chemical input data and 20 input data for plant and soil, the PPCP needs four additional chemical input data and seven more parameters for plants and soil plus 11 additional input data for the cell model (Supporting Information, Table S2). A sensitivity analysis of these input parameters (Shi, 2022) reveals that the distribution parameters log KOW (Figure 3), KAW (air to water), and, to a lesser extent, KHSA (protein to water) are the most relevant input data for calculated concentrations of neutral compounds in root, leaf, and grain or corn. However, for acids and bases in leaf and corn, the pKa is most sensitive (Supporting Information, Figure S4). The influence of environmental and plant physiological parameters on calculated concentrations differs with chemical class and plant part. For roots, soil organic carbon, growth rate, transpiration stream, and root mass are most relevant for neutral compounds. For acids and bases, soil pH also ranks highly. For leaves and corn, parameters describing exchange to air are in addition important, such as conductance and surface area. For acids in leaves, pH in xylem and the electrical potential of cytosol rank high. For corn, phloem flow to corn in addition impacts the concentrations of acids and bases.
Thus, the number of parameters required to adequately describe fate in plants is higher for acids and bases than for neutral compounds (Supporting Information, Table S2). This leads to higher uncertainty of the prediction and larger variance of the outcome. Delli Compagni et al. (2020) addressed model uncertainty by Monte‐Carlo analysis. Variance of calculated BCFs contributed to the uncertainty of degradation rates in soil, soil organic matter content, pH in plant saps, and uncertainty of sorption. However, measured BCFs from the literature showed higher variance than the model predictions. Polesel et al. (2015) concluded that “due to large variability of experimental data, accounting for typical input uncertainty and characterizing its propagation to risk indicators can be of added value.” It was recommended to standardize plant uptake test systems, and to record influential physiological and environmental parameters (Doucette et al., 2018), and it was found that plant‐specific parameters can have as much influence on chemical uptake as physicochemical parameters (Trapp, 2015).
Carter et al. (2022) addressed current obstacles in the model development for the prediction of accumulation of PPCPs in aquatic and terrestrial organisms, and concluded that further progress is hampered by a lack of mechanistic insights, mainly for ions. The authors stimulated research into partitioning and sorption behavior, membrane permeabilities, salts and complexes, and on biotransformation and elimination processes of ions. Our study contributes to this research by outlining additional processes occurring for ionizing substances and by quantifying their contribution to the bioaccumulation of PPCPs in terrestrial plants. Phloem transport, pH‐dependent ionization, and ion trap as well as sorption to nonlipophilic plant tissue were of high relevance in the PPCP model, while correction for the activity coefficient due to ionic strength had a negligible effect.
MODEL AVAILABILITY
An Excel version of the model is available on request from the first author.
Supporting Information
The Supporting Information is available on the Wiley Online Library, at https://doi.org/10.1002/etc.5582.
Acknowledgment
The authors declare no external assistance of individuals or organizations.
Conflict of Interest Statement
The authors declare no conflict of interest.
Author Contribution Statement
Stefan Trapp: Conceptualization; Model development; Calculations; Supervision; Writing. Junxuan Shi: Polishing; Finalizing; Discussion; Sensitivity analysis; Reviewing. Landi Zeng: Reviewing; Discussion; Final graphs.
Data Availability Statement
The manuscript does not contain measured data. It is based on model simulations. The model code is available as source code. This includes a mirror of the input data used to produce the results. To ensure that the latest (error‐free) code is always used, the code is provided from the first author for free. To receive the original and/or any later version of the code, please send an email to [email protected] to receive the original and/or latest version of the PPCP model.
