


Abstract
An environmental risk assessment for birds and mammals is an important part of any application package for potential registration of pesticides in Europe. A realistic estimation of the exposure of a certain species to the pesticide under field conditions is a refinement factor in long‐term higher‐tier risk assessments. Although guidance on how to collect specific exposure data is provided, there is not yet a harmonized view on how to use and assess existing and newly recorded field data. Exposure is defined as the portion of diet taken from a pesticide‐treated crop field over time (the PT factor), and it is set equal to the time a (tracked) individual is active (= foraging) in the crop of concern at the crop growth stage relevant to the pesticide application being assessed. While the PT factor is set to 1 in a first tier, it can be refined in higher tiers. Differences in the methodologies influencing the robustness of a data set and intraindividual variance in PT data are currently not considered. Our study, based on data recording in accordance with the European Food Safety Authority's recommendations, shows this variance for different species in different crops for both breeding and nonbreeding periods, with tracking sessions showing both interindividual as well as intraindividual variation across several days. We discuss PT data quality and how it can be used, considering intraindividual variance in a manner that is protective and conforms to current European guidance. The present study intends to support the planned revision of the current European guidance on how to conduct environmental bird and mammal risk assessments, and its further purpose is to open constructive discussions about how and which kind of PT data can be used. Environ Toxicol Chem 2022;41:1344–1354. © 2022 The Authors. Environmental Toxicology and Chemistry published by Wiley Periodicals LLC on behalf of SETAC.
INTRODUCTION
The European Food Safety Authority (EFSA) and European Union Member State Regulatory Authorities assess registration applications for pesticides and their active substances in Europe based on their potential environmental risk (among other factors). Environmental risk assessments (ERAs) for birds and mammals follow a tiered approach (EFSA, 2009). If the first‐tier risk assessment does not show acceptable risk, the risk assessment can be further refined by applying factors that give a more realistic estimation of the actual exposure of a certain species to the pesticide under field conditions. One of the refinement factors in long‐term higher‐tier ERA, is a crop‐, crop growth stage–, and species‐specific estimate of the portion of diet taken from a pesticide‐treated crop field (PT factor; for details, see EFSA, 2009). By default, this PT factor is set to 1 in the first‐tier ERA, meaning that the species of concern are assumed to obtain their entire diet from a pesticide‐treated crop field. For long‐term assessments this PT factor of 1 therefore implicitly assumes that this specific species feeds exclusively within the pesticide‐treated crop for a period of 21 consecutive days (following the standard EFSA [2009] long‐term period).
Data on PT factor refinement can be collected by conducting telemetry studies on relevant species, in relevant crops, and for the duration of the intended application of the product. These studies provide information on the time an animal is active in the “crop of concern.” For risk assessment purposes, this time is defined to be equivalent to the “proportion of diet obtained from treated area,” according to EFSA (2009). Therefore, nocturnal species need to be tracked at night, and others during daylight periods (if diurnal) or all day long, depending on the activity period of the species of interest. The radio‐tracking of animals aims to assess the actual amount of potential foraging time spent in the crop of concern within the agricultural landscape. The term “potentially foraging” is defined as the proportion of time a tracked animal is foraging or—in cases in which the tagged animal is not visible to the investigator and foraging cannot be excluded—might be foraging (i.e., being active based on tracking signal; for details, see Ludwigs et al. [2013]). By following single individuals for one complete activity period and recording single PT values and based on many such values from the same and different individuals, the PT factor for a specific crop and crop growth stage can be derived for the respective species and pesticide application in focus. The EFSA (2009) recommends for long‐term ERA recording such individual‐based PT values for 21 days to assess the long‐term PT of an individual animal. To obtain a robust PT factor for an ERA “scenario” (i.e., species‐, crop‐, and growth stage–related), several such individual‐based PT value data sets are needed. According to EFSA (2009), there are many of these “scenarios,” each of which consists of a species occurring at a crop field during a certain time during the crop's development. For each such scenario, the PT value is assumed to be different and would need to be provided, respectively, for the higher‐tier ERA. However, PT data for 21 consecutive days for individuals of any species for any species–crop–growth stage combination (=scenario) are currently not available. This is mainly due to constraints regarding the feasibility of obtaining such data in the field. To obtain an adequate estimate of the proportion of time animals from a population spent foraging inside a crop, multiple animals need to be tracked. However, neither in EFSA (2009) nor since its publication is the number of individuals to be tracked for a specific scenario clearly defined, but 10 is a minimum number mentioned in Wassenberg and Zorn (2012) and Northern Zone (2020). For 10 individuals with continuous tracking for 21 days, the tracking time would result in >5000 h (>600 working days of one person) for a single scenario to be recorded. Appendix A in EFSA (2009) lists 233 different scenarios for bird species and 290 scenarios for mammal species in farmland for which species‐, crop‐, and crop growth stage–specific PT factors for long‐term higher tier ERAs could be conducted. Therefore, roughly estimated, 300,000 “working days” (>800 years) would be needed for the telemetry fieldwork, assuming 10 individuals would be tracked for 21 days for each scenario.
Previous to EFSA (2009) and based on telemetry data, Finch et al. (2006) published many species‐, crop‐, and “season‐specific” (i.e., not crop growth stage–related) PT factors, referring to European Commission (2002), the relevant guidance document previous to EFSA (2009). These extensive data were based on noncontinuous tracking, and the authors concluded, “Ideally we would include only birds where we had a full day's contact data. Unfortunately our monitoring schedule precluded this: no birds were monitored all day in a single day.” Therefore, single PT values were recorded over a few days, following 2‐h slots, to cover longer periods. However, the lower limit for one single or daily PT value was 150 min tracking time and at least 30 min “active signal,” which indicates potentially foraging within the minimum of 151 min of tracking (i.e., many PT values covered no full daily activity period). The individuals were not tracked continuously and were not necessarily trapped in or close to the crop of interest (as recommended by EFSA [2009]) but just within farmland. Finch et al. (2006) mentioned that “birds often moved out of range so that they were ‘lost’ to the tracker for several hours at a time. This tends to exaggerate the extremes of the distribution of PT”; and finally, the tracker recording the birds tried to relocate the tagged individual within the crop of concern (i.e., the tracker awaited the bird in crop to continue tracking). Overall, the authors concluded that for a bird being active in crop at a single day, with “more contact time it is more likely that more habitats will be visited and PT will be less extreme.” Consequently, the authors introduced the term “consumer only.” By considering only PT values >0 for a specific crop for a tracked animal (= consumer only definition of Finch et al. [2006]) for PT factor estimation, it was intended to overcome methodological shortcomings (for more details, see Finch et al. [2006]). In cases where single PT values resulted from animals trapped far away from the crop of concern and/or there were data gaps owing to discontinuous tracking, it is reasonable to exclude these PT values from the data set used to calculate a respective PT factor. However, PT data that follow EFSA (2009) requirements and show a 0 value should not be deleted by referring to Finch et al. (2006) and not without considering the reason the consumer‐only definition was introduced. Altogether, neither Finch et al. (2006) nor Prosser (2010), using the same data, followed the quality standards on how to record PT data (as recommended by EFSA [2009]) and did not consider long‐term intraindividual variation of PT values.
Against this background and based on data robustness in terms of EFSA (2009) requirements and recommendations on how to record PT data, Ludwigs et al. (2017) proposed revisiting common PT refinement factor estimates by considering intraindividual variance in long‐term assessments, using Monte Carlo simulations. In addition, the UK Health and Safety Executive (UK HSE) published a position paper on the proposed use of Monte Carlo simulated PT factors (UK HSE, 2019), which stated that the concept of generating a long‐term PT value “appears a reasonable approach for characterizing long‐term bird or mammal behaviour.” However, the question of how to use PT data, if available from multiple individuals and/or tracking sessions in ERAs, requires a case‐by‐case consideration of available data and scenarios (UK HSE, 2019). We agree with this position and that it is important to understand how and which PT data can be used to derive conforming to guidance and realistic higher‐tier PT factors by using Monte Carlo simulations. Crocker and Langton (2019) also responded to the proposal, which was published together with a reply by the authors of the original publication (Ludwigs, Ebeling, Fredricks, et al., 2019). Crocker and Langton (2019) stated, regarding the intraindividual variance, that in “datasets with a single PT per bird and no repeated measures, the individual‐focused method must assume that each bird shows the same foraging preferences on all subsequent days, and so the 90th centile will also remain unchanged. This is unrealistic but, arguably, not more unrealistic than assuming that birds and their daily foraging preferences are essentially fungible.” However, publicly available data sets (see Ludwigs et al., 2017; Ludwigs, Ebeling, Foudoulakis, et al., 2019) give clear evidence that intraindividual variance of daily PT values for crops is common in farmland species that have larger activity ranges. However, it should be noted that such data are not available for every relevant species and scenario. Furthermore, for species exhibiting small daily activity ranges, for example, vole species in grassland, intraindividual variance in terms of crop use might be small and respective PT values close to 1. On the other hand, it is unrealistic to assume that PT values are static; and one could challenge the assertion that such data are rare or unavailable, as stated by Crocker and Langton (2019). The critical review of the proposal of 21‐day Monte Carlo simulated PT values by Crocker and Langton (2019) stated that the Monte Carlo method as described in Ludwigs et al. (2017) is “unsuited to most radio‐tracking datasets and could lead to misleading and even unprotective” ERAs, being at the same time “statistically not valid.” A detailed reply by Ludwigs, Ebeling, Fredricks, et al. (2019) discussed that some data sets are unsuitable for such an approach. The requirements of, and options for, the pooling of data from one specific PT data set for Monte Carlo simulations both need to be considered case by case or adapted to the specific characteristics of a particular data set.
To further illustrate how pooling of data and Monte Carlo simulations can be applied to generate higher‐tier PT factors, we present this approach for two exemplary telemetry data sets: The first data set is on yellow wagtails (Motacilla flava) in strawberry fields, and the second data set is on skylarks (Alauda arvensis) in spring cereal fields. The PT data for both data sets are based on multiple, continuous, and full‐day tracking sessions of the same individuals. We intend to provide data to contribute to the discussion on how to use empirical PT values of high quality following EFSA (2009) requirements for representative long‐term higher‐tier ERAs. Our aims are (1) to raise awareness about PT data quality differences, and (2) to contribute to the discussion on how to derive long‐term PT factors fit in EFSA (2009), its revision, and other follow‐up guidance documents for vertebrate ERAs.
METHODS
Case studies
The methods applied and the general conduct of the studies presented follow EFSA (2009) and Northern Zone (2020) recommendations, and their primary objective was to generate empirical, continuously tracked, and full‐day PT values in relation to the crop and growth stage in focus (= a scenario listed in EFSA [2009, Appendix A]). The data on yellow wagtails are relevant for risk assessment for “small insectivorous birds” in strawberries, while the data on skylarks in freshly drilled summer cereals are relevant for the risk assessment for “small omnivorous birds” for pesticide applications at this stage of spring cereals.
In all studies, birds were trapped in or very close (<10 m) to the crop of concern and equipped with radio tags (Biotrack). The individuals were captured via mist netting (they are crop‐representative and crop‐related subpopulations of all individuals of these species utilizing the farmland investigation areas). Radio tags were attached to the back of the birds using a Rappole harness (Rappole & Tipton, 1991). During each session per bird, the activity of individual birds in all habitats was continuously monitored to generate individual and continuous recorded daily PT values. Each bird was followed primarily by foot (or car), and every change of behavior or change of habitat (exact positions according to a map) was recorded to calculate an individual daily PT value. For more details about the general telemetry study, see Ludwigs et al. (2013, 2017). Very high‐frequency radio telemetry was used to record continuous tracking (no data fixes per time period; see tracking data requirements in EFSA [2009] and Northern Zone [2020]). Keeping in mind errors in accuracy of fixes, particularly at field borders (see Katzschner et al., 2019), and that no data can be recorded in tall crops, dense habitats, or during bad weather conditions, global positioning system devices are not an option, particularly for small passerines and for animal welfare reasons (>5% of body weight; see Kenward [2001]).
The wagtail study was conducted in two main strawberry growing regions in Germany. One was located in the federal state North‐Rhine Westphalia and one in Baden‐Wuerttemberg. The selected study sites (in total ∼500 ha) were characterized by a high abundance of strawberry fields (i.e., 66 strawberry fields with a total area of 148 ha), which increases the likelihood that free‐ranging and radio‐tracked individuals will use strawberry fields for foraging. Please note that all birds were trapped in or very close to the crop of concern within the study sites. The Biologische Bundesanstalt, Bundessortenamt und Chemical industry (BBCH) growth stage (Meier, 2018) of the strawberry fields at the time of radio‐tracking was 60‐89, which is one relevant crop scenario for the small insectivorous wagtail according to EFSA (2009). Thirteen yellow wagtails were radio‐tracked from May 3 to 31, 2006. Two more wagtails trapped and tagged could not be relocated after tagging and most likely left the study area. Ten of 13 individual birds were continuously radio‐tracked and visually observed for two nonconsecutive whole daylight periods, and three yellow wagtails were tracked only for one daylight period. Overall, we evaluated 23 continuous full‐day telemetry sessions conducted over a total period of approximately 4 weeks in a representative area for strawberry cultivation during the breeding season of yellow wagtails (cf. Kragten, 2011). Total daily activity range size differed significantly between tracking sessions (minimum 1.8 ha, maximum 124.7 ha). Daily activity ranges of individual birds also differed widely between the two tracking sessions (for all data, see Supporting Information).
The skylark data set consists of telemetry data recorded from two different studies following the same methodology and conducted on freshly drilled spring cereal fields near the Hochscheid and Sohrschied communities in the Hunsruck region in Germany. The exact numbers and sizes of spring cereal fields within the overall study area are not available, but the region is a traditional and typical area for spring‐sown cereal in the federal state of Rhineland‐Palatinate. All birds were trapped at spring cereal fields. In one study, five skylarks were followed continuously for full‐day radio‐tracking once or twice (within a maximum interval of 14 days) between March 29 and April 24, 2006. Two skylarks disappeared after tagging and could not be radio‐tracked. In the other study, eight individuals were followed continuously by full‐day radio‐tracking, of which six were tracked up to seven times within a period of 14 days. All tracking sessions within the present study took place within less than 3 weeks from March 25 to April 10, 2016. In the present study, for six more tagged individuals no signal could be detected afterward, and it was assumed that they had left the study area and could not be tracked. Altogether, in both studies, one to seven measured full‐day PT values are available per individual, representing 41 tracking sessions of 13 different individuals. The sessions were recorded predominantly in the prebreeding phase of the species in the study region until early April (cf. Robinson, 2005). Based on the field observations, none of the tracked skylarks was in their individual breeding phase, and some left the area during the study, indicating single individual skylarks on spring migration. In addition, tracking sessions of skylarks exhibited considerably different daily activity ranges (minimum 1.0 ha, maximum 50.5 ha), as was the case for single individuals within a few days (for all data, see Supporting Information).
An overview of the empirical daily PT data of yellow wagtails in strawberry fields and skylarks in spring cereal fields is provided in Tables 1 and 2.
Single “portion of time in treated area” value per session and mean for each yellow wagtail tracked in May 2006 in a strawberry cultivation area in Germany (daily activity range sizes are available in the Supporting Information)
| Daily PT value at session | |||
| Individual | 1 | 2 | Mean PT |
| W1 | 0.000 | 0.000 | 0.000 |
| W2 | 0.130 | – | 0.130 |
| W3 | 0.230 | 0.070 | 0.150 |
| W4 | 0.340 | 0.280 | 0.310 |
| W5 | 0.580 | 0.240 | 0.410 |
| W6 | 0.910 | 0.250 | 0.580 |
| W7 | 0.800 | 0.480 | 0.640 |
| W8 | 0.770 | 0.600 | 0.685 |
| W9 | 0.580 | 0.870 | 0.725 |
| W10 | 0.910 | 0.630 | 0.770 |
| W11 | 0.900 | – | 0.900 |
| W12 | 0.950 | – | 0.950 |
| W13 | 0.950 | 0.960 | 0.955 |
PT = Portion of time in treated area.
Single “portion of time in treated area” value per session and mean for each skylark tracked in March–April 2006 and 2016 in one of the main spring cereal growing areas in Germany (daily activity range sizes are available in the Supporting Information)
| Daily PT value at session | ||||||||
| Individual | 1 | 2 | 3 | 4 | 5 | 6 | 7 | Mean PT |
| S1 | 0.000 | – | – | – | – | – | – | 0.000 |
| S2 | 0.000 | – | – | – | – | – | – | 0.000 |
| S3 | 0.000 | 0.000 | 0.000 | – | – | – | – | 0.000 |
| S4 | 0.000 | 0.000 | – | – | – | – | – | 0.000 |
| S5 | 0.000 | 0.093 | 0.013 | 0.000 | 0.000 | – | – | 0.021 |
| S6 | 0.049 | 0.014 | 0.000 | 0.041 | 0.000 | – | – | 0.021 |
| S7 | 0.052 | 0.0002 | – | – | – | – | – | 0.026 |
| S8 | 0.086 | 0.336 | – | – | – | – | – | 0.211 |
| S9 | 0.283 | – | – | – | – | – | – | 0.283 |
| S10 | 0.237 | 0.448 | 0.755 | 0.332 | 0.449 | 0.304 | – | 0.421 |
| S11 | 0.696 | 0.585 | 0.327 | 0.299 | 0.558 | – | – | 0.493 |
| S12 | 0.611 | – | – | – | – | – | – | 0.611 |
| S13 | 0.975 | 0.943 | 0.967 | 0.959 | 0.937 | 0.264 | 0.186 | 0.747 |
PT = Portion of time in treated area.
PT data preselection
As stated in Appendix P of EFSA (2009), it is reasonable to use all individuals that were caught in or at the “crop of concern”—whether they use the crop or not—to estimate a PT factor of continuously tracked individuals. However, a more conservative approach is to include only those PT values for individuals that actually foraged in the crop of concern. This consumer only approach, which was previously proposed by Finch et al. (2006) and by Prosser (2010) for their data (for animals not trapped in or close to the crop of concern and not tracked continuously), is reasonable because it accounts for the stated shortcomings of such PT values presented in their publications. The standard registration‐relevant telemetry studies presented do follow the EFSA (2009) recommendations for gathering continuously recorded daily PT values, covering full daily activity periods of animals trapped in or close to the crop of concern. Therefore, these individuals can be used for PT factor calculation according to EFSA (2009) as “potential consumers.” However, for comparison and later discussion of results in the context of PT factor use in ERAs as requested by EFSA (2009), different approaches are exemplified. By following EFSA (2009) and Northern Zone (2020), daily PT values from all individuals captured in or close to the crop of concern were used to calculate the PT factor (potential and confirmed consumer). As a second, more conservative approach, only data for birds actually foraging in the crop during at least one tracking session were used to calculate the PT factor. For completeness, the consumer only approach proposed by Finch et al. (2006) is also presented.
Monte Carlo PT simulations
The Monte Carlo simulation method as proposed in Ludwigs et al. (2017) and applied to the data sets evaluated in the present study estimates the mean daily PT over a long‐term period in the crop of concern by an individual bird, in this case a yellow wagtail or skylark. Each empirical PT value (Tables 1 and 2) exhibits a full‐day coverage (giving clear records of full‐day activity of the tracked individual at the crop of concern). The Monte Carlo simulation allows extrapolation of the available data to cover a specific time period, but the data quality and the empirical basis of the data are crucial (Ludwigs, Ebeling, Fredricks, et al., 2019) for informing the value of the Monte Carlo results. The default period for assessing the long‐term exposure is 21 days (EFSA, 2009). Accordingly, the aim of these simulations is to generate a 21‐day radio‐tracking data set for a large number of virtual individuals based on empirical data. This can be viewed as akin to a bootstrapping approach, and further details of this method are given in Ludwigs et al. (2017). For each virtual individual to be generated, a random selection of 21 values is drawn from the pool of empirically measured PT values. These 21 values per individual reflect the variability in potential foraging time in crop of interest and extrapolate it to a 21‐day sample. For this purpose, the empirical radio‐tracking data need to be evaluated and pooled. Pooling data is an important and crucial aspect, which needs careful consideration (Ludwigs et al., 2017; and see Results and Discussion). This bootstrapping approach is conducted for a large number of virtual individuals (n = 10,000; for more details, see Supporting Information). This large sample of virtual individuals intends to represent the common behavior of a population, which is the target unit of the protection goal in the long‐term risk assessment, based on the behavior of the investigated individuals. Because of the latter, data representativeness (see Case Studies) and data robustness (see Introduction) are of fundamental importance. For each virtual individual the arithmetic mean PT value of 21 days was calculated, representing the average daily PT value of each individual over a 21‐day period. These 21‐day PT values reflect the average “potentially foraging” time of individuals in the sampled population. To obtain a PT factor that covers 90% of the population, the means for every virtual individual were calculated, followed by the 90th percentile of these means. For comparison, 90th percentile PT factors according to the consumer only approach of Finch et al. (2006) and Prosser (2010) as well as 90th percentile PT factors of the individual mean PT values, both based on the empirical data only, are presented. In addition, mean values of the individual mean PT values are presented for completeness. All Monte Carlo simulations were performed using the statistical computing language R, Ver 3.6.3 (R Core Team, 2020).
RESULTS
To investigate whether or not the empirical data can be considered to be representative, the data should be visually inspected (Ludwigs et al., 2017). Based on how the data were recorded (study site, crop of concern, trapping in or at crop, full‐day telemetry, focus scenario), empirical data distribution (Figure 1), and biological and ecological knowledge of the species, pooling options can be derived.
![Visualization of data sets showing “active time in crop” = potential foraging of each continuously tracked yellow wagtail and skylark followed from dawn until dusk for a full activity period each (gray dots indicate single daily portion of time in treated field [PT] values, and X indicates the mean PT value per individual).](https://oup.silverchair-cdn.com/oup/backfile/Content_public/Journal/etc/41/5/10.1002_etc.5311/4/m_etc5311-fig-0001-m.jpeg?Expires=1749097825&Signature=axhCScvB4ETIkiZtGPv60v1geLUf1i-2UP-v6oyGIfS57WBr41qB8vco5bFJuie3x~2Ju~19rN8dfsW5bMtgXfIHJ~dYk4qtRwItmyebxihTk5I~zbDtTrf6~MYm6VZxV9ZvDYHZTf4COonMRV4vdjkHP1tBdBiGGQQuIbE9pVnj8tu3sD5tw7GuSw9JGM0~a8iHRs0WZ~6Fiin75tJGJ4SMhrL--idcEN6-a4e5QkDu8rm~jctnkscPQT5UkTwrmxwQbbIlc93TiS4Bw8fAkMOOntaGrZLKEU2v-fWBgLYT6bejh4XN-9nP0vG6m4JZ2Y8strp4CbN5HzS7uJuNVg__&Key-Pair-Id=APKAIE5G5CRDK6RD3PGA)
Visualization of data sets showing “active time in crop” = potential foraging of each continuously tracked yellow wagtail and skylark followed from dawn until dusk for a full activity period each (gray dots indicate single daily portion of time in treated field [PT] values, and X indicates the mean PT value per individual).
Yellow wagtail
The daily PT values of yellow wagtails in strawberry fields show one individual twice exhibiting no foraging in strawberries and one individual with two very high proportions of active time in strawberries (Figure 1, right, and Table 1). All other individuals tracked twice exhibit one lower and one up to 4‐fold higher daily PT value. Wagtails tracked only once showed high or low values. Five of 13 individuals used strawberry fields to very varying extents, with individual mean PT values <0.5, whereas seven individuals with notable variance in use of strawberries exhibited mean PT values >0.5 (Figure 1). The remaining individual showed the highest variability between the two PT values recorded within <21 days, exhibiting a mean PT of 0.58 (Table 1). It should be noted that between all of the birds that were trapped in or at strawberry fields in a strawberry cultivation area during the breeding period, all potential uses of this habitat element were covered (rather low, rather high, and both in the same individual). This reflects an expected and characteristic distribution of PT values in a strawberry landscape with territorial yellow wagtails, suggesting that each individual could potentially realize each of the measured daily PT values. Therefore, the Monte Carlo simulated PT values presented are based on the single daily PT values of all individuals pooled. The Monte Carlo simulation resulted in a 90th percentile 21‐day PT factor of 0.63 using means of all individuals and 0.68 using only means of those individuals that used strawberry fields for foraging. The 90th percentile PT factors following the consumer only approach and not considering its reasoning or intraindividual variance exhibited by the empirical data were 0.94 and 0.95, respectively (see Figure 2 and Table 3).
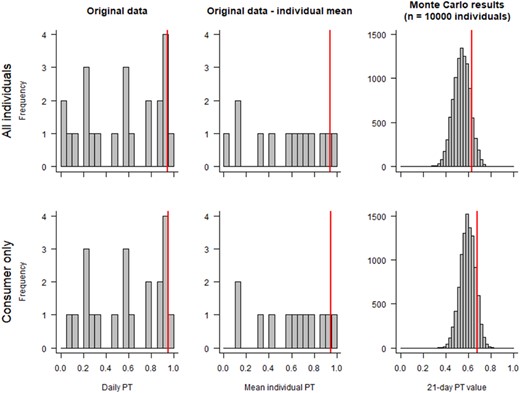
Yellow wagtail individuals—measured daily portion of time in treated field (PT) values in the original study (left; n = 23; one or two sessions per individual), mean measured daily PT values per individual (middle; n = 12 individuals), and mean PT values per “virtual” individual over 21 days from Monte Carlo simulations (right; n = 10,000) for wagtail in strawberry fields. The vertical red line denotes the 90th percentile per data distribution.
Overview of different “portion of time in treated field” factor calculations for the two data sets investigated
| Daily empirical PT values | Mean individual daily empirical PT values | Mean simulated PT values (21 days for 10,000 MC individuals) | |||||
| Species | Crop | 90th percentile | Mean | 90th percentile | Mean | 90th percentile | Mean |
| Skylarka | Spring cereal | 0.94 | 0.29 | 0.59 | 0.22 | 0.38 | 0.29 |
| (n = 41) | (n = 13) | ||||||
| Skylarkb | 0.94 | 0.35 | 0.64 | 0.32 | 0.44 | 0.35 | |
| (n = 34) | (n = 9) | ||||||
| Wagtaila | Strawberry | 0.94 | 0.54 | 0.94 | 0.55 | 0.63 | 0.54 |
| (n = 23) | (n = 13) | ||||||
| Wagtailb | 0.95 | 0.59 | 0.95 | 0.60 | 0.68 | 0.59 | |
| (n = 21) | (n = 12) | ||||||
Data set according to EFSA (2009) recommendations (i.e., including all potential consumer individuals/all data due to the data quality).
Conservative selection excluding individuals with only PT values of 0.
PT = portion of time in treated field; MC = Monte Carlo.
Skylark
The daily PT values of skylarks in spring cereal fields (Figure 1, left, and Table 2) show a different distribution from the yellow wagtail data (Figure 1, right, and Table 1). Both data sets include the same number of individuals, but most of the repeatedly tracked skylarks were tracked more than only twice. All birds were trapped in or at the crop of concern in a common spring cereal cultivation area but shortly before the start of the breeding season when territoriality is not fully established because bare soil fields in spring are one of many potential foraging habitats in farmland for skylarks (see Donald, 2004). It should be further noted that several individuals, after being trapped in or at spring cereal fields and tracked in (e.g., S9 or S12 in Table 2) or away from (e.g., S1 or S2 in Table 2) spring cereal fields, left the study area and could not be tracked more than once. This is most likely a result of some of the tracked skylarks migrating through the study area because no breeding territories were established yet at the time of tracking. In contrast to the wagtail data, the skylark data show that fewer individuals used the crop of concern. Individuals exhibiting the highest single PT values on one day (S10, S11, and S13 in Figure 1 and Table 2) used spring cereal to a much lower extent as foraging habitat during another day. The resulting individual mean PT value of these individuals was at the higher end of the individual PT distribution (S13), <0.5 (S10), or in between (S11 in Figure 1). The distribution of PT values of skylarks in a prebreeding phase in a spring cereal landscape, when all or the majority of birds were not territorial, reflects an early season local population. Therefore, the Monte Carlo simulated PT values presented for this data set are based again on the pooled single daily PT values of all individuals tracked. The 21‐day PT values as a result of the Monte Carlo simulations resulted in a 90th percentile 21‐day PT factor of 0.38 using all individuals and 0.44 using only those individuals that used spring cereal fields for foraging during at least one of the radio‐tracking sessions in the original study. The consumer only approach 90th percentile PT factor according to Finch et al. (2006) and Prosser (2010) was 0.94 and, therefore, identical to the factor from the wagtail data set (see Figure 3 and Table 3).
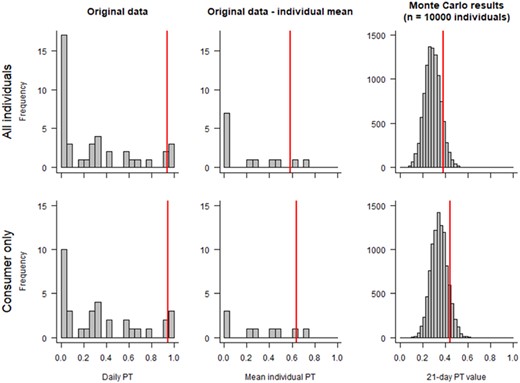
Skylark data excluding zero daily portion of time in treated field (PT) values—measured daily PT values in the original study (left; n = 41; one to seven sessions per individual), mean measured daily PT values per individual (middle; n = 13 individuals), and mean PT values per “virtual” individual over 21 days from Monte Carlo simulations (right; n = 10,000). The vertical red line denotes the 90th percentile per data distribution.
DISCUSSION
A simple mathematical effect of the 90th percentile PT calculation from single values, as proposed by Finch et al. (2006) and Prosser (2010) and suggested as appropriate by Crocker and Langton (2019), is demonstrated with the two data sets in the present study. Following this approach, both data sets resulted in a PT factor of nearly 1. However, prerequisites for appropriate PT data recording following EFSA (2009) recommendations (i.e., study site selection, how data were recorded, how individuals were chosen, or the evidence for intraindividual variance within a few days) are not considered. Both data sets demonstrate that a single PT value close to 1 in any data set of approximately 10 values (which can be the case in an individual foraging behavior in the course of a few days) results in a 90th percentile PT factor of single PT values close or equal to 1. Arguing that intraindividual variance, as shown in any data set containing multiple tracking sessions of the same individual and as demonstrated in the present study (see also Ludwigs et al., 2017; Ludwigs, Ebeling, Foudoulakis, et al., 2019) not considered, will lead to PT factors predominantly being close to 1 (see Finch et al., 2006; Prosser, 2010). This is the result of using a 90th percentile of data distributions of rather small sample sizes. However, this means that the PT factor calculated this way can be overestimated and thus may not reflect the realistic long‐term foraging behavior of a population of a given species linked to a specific crop and time as suggested by EFSA (2009).
Unquestionably, because of data shortcomings regarding site selection, trapping of animals, duration of tracking sessions, relation to crop and BBCH growth stages, as well as the conservative assumption that PT will stay static over the long term, the approach of Finch et al. (2006) is conservative overall, whereas other study designs using more appropriate methodologies might allow a more realistic evaluation of PT factors. However, EFSA (2009) lists a realistic PT factor as a particular option for higher‐tier refinement and provides guidance on how to gather respective data and what traits the recorded data must have to be appropriate for PT factor calculations and long‐term refinements.
The two data sets used in the present study fully comply with recommendations as given by EFSA (2009) and Northern Zone (2020) to conduct PT studies. The studies can be considered representative in terms of (1) relevant species for the respective risk assessment scenario, (2) individual birds being trapped in or very close to the crop of concern, (3) the landscape in which the data were collected being representative of the cultivation of the specific crop, and (4) individual birds being radio‐tracked continuously for a full activity period per PT value or session. The data clearly show that daily PT values are variable for the same individual between different days. This was even the case for a species (yellow wagtail) which had established breeding territories at the time of radio‐tracking. Differences in daily home ranges and foraging site selection are also reported for other farmland birds (see Krupiński et al., 2021) and can be caused, besides many other factors, by changes affecting food availability and food accessibility (Butler & Gillings, 2004; for skylark, see, e.g., Fuchs & Sacke, 2006; Kuiper et al., 2013; Ottens et al., 2014; Piha et al., 2003; and for yellow wagtail, see, e.g. Gilroy et al., 2009). Consequently, assuming that daily PT factors are static is unrealistic, and therefore intraindividual variation in daily PT factors should be taken into account when assessing a population‐ and scenario‐relevant PT factor. The yellow wagtail data were recorded during the breeding period, and the data set shows clear evidence of intraindividual variance of foraging habitat use within a few days. The study covers best‐selected individuals in terms of crop relation within a crop of concern–dominated farmland. Strawberries are an attractive crop for a small insectivorous passerine as breeding and foraging habitat. Overall, the data in combination with the species knowledge suggest that each individual can have any PT factor on any given day, and consequently a pooling of all individuals seems reasonable. Because of the recommendation of EFSA (2009) to trap and tag animals in the crop of concern, the choice of animals tracked in such telemetry studies is representative (i.e., other individuals of the species in the landscape would occur and settle in other areas of the farmland landscape).
The skylark data were recorded during prebreeding with multiple (i.e., up to seven sessions or as long as available in the study area) tracked individuals. The scale of intraindividual variance in the long term is even more distinct in the present study, probably because of more available data. Moreover, this is also more likely, because of the fact that the data were collected before breeding territories have been established. Similarly to the wagtail data, it can be assumed that PT data are most relevant in terms of selected individuals and crop within the overall landscape. Pooling of all sessions seems justified; however, single skylarks exhibiting no use of spring cereal in the course of a complete day (one tracking session) and being highly likely to have left the area during the study (cannot be found again after the first session) can be excluded. They are likely not part of the resident early season skylark population in the investigated spring cereal landscape. However, such birds can make a stopover on migration in another area where spring cereals are cultivated or not. In the present study, it becomes obvious that data sets need to be evaluated case by case, that scenario‐specific PT values are not static, and that intraindividual variance is important.
In case Monte Carlo simulations could be conducted, a risk assessor or evaluator should be conscious of the data quality and quantity, species, and time of the year. Pooling of data to derive Monte Carlo simulated PT factors needs to consider species ecology, the risk assessment scenario to cover, and the PT data at hand (Ludwigs et al., 2017; Ludwigs, Ebeling, Foudoulakis, et al., 2019). Following Northern Zone (2020, Table 4.5), the number of individuals continuously tracked should be >10, and multiple tracking per tagged individual is needed. Therefore, it is clear that not all available data sets will be suitable for Monte Carlo simulations in general and that not necessarily all data can be pooled, or additional radio‐tracking data may be necessary to get a better picture.
Finch et al. (2006) and Prosser (2010) suggest that a PT of 1 is a realistic higher‐tier long‐term PT factor for many scenarios because of the single independent PT value per “individual” approach, combined with the application of a 90th percentile. Applying data selection, use, and calculation methods as done by Finch et al. (2006) on study designs using more appropriate methods can lead to overconservative PT factors close to 1, although the more robust data sets in the present study allow a more suitable evaluation, which can lead to a more realistic long‐term PT factor. All of these aspects are missing in Finch et al. (2006) and Prosser (2010). However, because the data of Finch et al. (2006) were not recorded following EFSA (2009) recommendations and they used a shorter tracking time and did not exclusively trap and tag individuals in or at the crop of concern, the consumer only approach has been proposed. Therefore, we argue that the assessment rules (i.e., selection of tracking “units” or split of “consumer only” and “all” birds) possibly needed for data sets like those in Finch et al. (2006) may not be needed for data sets like the two in the present study. Such data sets allow for a more elaborate evaluation thanks to the detailed reporting and the inclusion of multiple full‐day tracking sessions for the same individuals.
The yellow wagtail data cover territorial individuals in a crop of concern–dominated farmland area. The respective Monte Carlo simulated 90th percentile PT factor is lower than the default proposed by South Member States (2018) of 0.8 and similar to what is proposed by Bundesamt für Verbraucherschutz und Lebensmittelsicherheit (BVL; 2016). The PT following the consumer only approach ignoring intraindividual variance is close to the Tier 1 default. Because of the focus of the present studies, covering specific sites and individuals in or at the crop of concern, it should be noted that we obtained the highest realistically possible quality level of PT data on yellow wagtail individuals for this specific scenario.
Similar to the wagtail data, the skylark PT data are based on a robust data set in terms of individuals and crop of concern for the respective EFSA (2009) scenario, but data have been collected from the species in the prebreeding period in an even shorter period available for tracking to cover the scenario. The resulting Monte Carlo simulated 90th percentile PT factors in this case are lower than the default proposed by South Member States (2018) and BVL (2016). Even when Monte Carlo simulations were not applied to this robust data set and the individual mean of the empirical data was used before calculating a 90th percentile, PT factors of approximately 0.6 were found using all individuals or “confirmed consumer,” respectively (Table 3). However, the consumer only approach by Finch et al. (2006) ignoring data quality and clear evidence of intraindividual variation for this specific scenario resulted in the exact PT factor as in the wagtail data set and close to the Tier 1 default.
Our data show that the intraindividual variance is well demonstrated empirically and that it is highly relevant. Case‐ or scenario‐specific intraindividual variability in daily PT values is evident, and this brings more relevance to higher‐tier long‐term ERAs. This is one of the key differences compared to acute risk assessment and its 1‐day perspective. The long‐term PT data presented in Finch et al. (2006) and Prosser (2010) may refer in part also to the same individual, and a reevaluation of that data would likely show intraindividual variance also in their data set.
The statement by Crocker and Langton (2019) “that pooling data between individuals will lead to less protective risk assessments” is not correct per se. The idea of pooling is to enlarge the pool of daily PT values from individuals that are assumed to have similar PT values based on empirical data. If this is not possible, an Monte Carlo simulated PT factor should not be the way forward, though this does not mean that it is not possible to conduct it at all. As mentioned, there will be cases where the approach would not be justified because of the available data or species‐ or crop‐specific factors, but the potential of the approach and the resulting relevance for long‐term PT factors should certainly be discussed.
If the PT factor becomes a higher‐tier long‐term refinement option in the revised EFSA guidance (2021), and as it is actually presented in the current EFSA (2009) document, the common paradigm of a “single and independent PT value per individual approach” combined with 90th percentile application should be revisited. In addition to data recording (cf. Northern Zone, 2020, Table 4.5), an Monte Carlo approach option could be implemented in the guidance as well and can be a step forward for respective and available data sets as shown in the present study. We have attempted to show that PT factor calculation with more detailed and nuanced views on data quality and including intraindividual variance can be done without becoming underprotective (cf. Crocker & Langton, 2019). A properly derived long‐term PT factor can provide an appropriate level of protection, which does not necessarily mean underprotection.
Overall, this can be condensed to the question of whether pooling is reasonable and what data can be pooled for each data set. We believe that for many specific scenarios and data sets available, the Monte Carlo approach is closer to what EFSA (2009) requires than the application of the consumer only principle to any data as postulated by Finch et al. (2006). In our opinion, the presented Monte Carlo simulation approach itself should not be judged as being incorrect, invalid, or “wrong” in general. It is neither the only way forward nor applicable to every data set, but the present study hopefully shows that discussion is necessary about long‐term PT factor calculation approaches, their applicability, and which options are reasonable for which specific data sets.
CONCLUSION AND OUTLOOK
Intraindividual variance is not considered in the calculation of PT factors, neither before nor since EFSA (2009) came into effect. Ludwigs et al. (2017) initiated the discussion including intraindividual variance in PT factor calculation, and follow‐up discussion took place (Crocker & Langton, 2019; Ludwigs, Ebelings, Foudoulakis, et al., 2019; Ludwigs, Ebelings, Fredricks, et al., 2019; UK HSE, 2019).
The data of the present study show that the higher‐tier and long‐term risk assessments could be improved by taking into account intraindividual variance in daily PT factors. The authors hope that the present study will contribute to a next step in assessing long‐term PT factors for higher‐tier risk assessments and that the approach presented will be critically reviewed and elaborated in more detail during the current revision of EFSA (2009, 2021).
Supporting Information
The Supporting Information is available on the Wiley Online Library at https://doi.org/10.1002/etc.5311.
Acknowledgment
We are indebted to O. Jakoby (Rifcon), who supported data curation and formal analysis and commented on an earlier version of the manuscript. We thank CropLife Europe for funding this project. The present study would not have been possible without the support of the many ornithologists in the field conducting the tremendous telemetry work: O. Aldeguer, M. Andres, J. A. Barba, S. Bauer, R. Blöcher, D. Engelen, J. Esser, C. Fischer, H. Flinks, D. Gladbach, J. Görlitz, P. R. Haas, G. Hanebeck, J. Hernandez, A. Krienke, S. Laucht, T. H. Lenhart, J. Martinez, P. Moosmayer, T. Nack, R. Neumann, A. Nick, F. Normann, M. Peris Cabré, A. Quellmalz, C. Roland, A. Sallent, I. San Martin, M. Schwarz, A. Stosch, A. Strauss, M. Suanjak, R. Vohwinkel, F. von Blanckenhagen, and S. Weiel. We also thank the many ecotoxicologists from consultancies, regulatory authorities, and industry for discussions about PT data recording, processing, and application in higher‐tier long‐term risk assessments in Europe. Many thanks to J. Fage (Syngenta) for the English editing of the paper and two anonymous reviewers for their valuable comments on an earlier version of the manuscript.
Disclaimer
The authors have no conflict of interest to declare.
Author Contributions Statement
Jan‐Dieter Ludwigs: Conceptualization; Data curation; Formal analysis; Methodology; Writing–original draft. Markus Ebeling: Conceptualization; Resources; Writing–review and editing. Sonja Haaf: Resources; Writing–review and editing. Steven Kragten: Conceptualization; Resources; Writing–review and editing.
Data Availability Statement
Data, associated metadata, and calculation tools are available from the corresponding author ([email protected]).
