


Abstract
There are currently few suitable test systems for the chronic toxicity testing of aquatic macroinvertebrates under stream conditions. Therefore, a new test system mimicking running water conditions was developed for testing with lotic insects. This system uses small test cages, with 10 of these suspended inside each 25‐L container and rotating at 0.1 m/s, to create a water flow for the individual organism inside each cage. To test the performance of the new exposure system, chronic effects (21 d) of the neonicotinoid imidacloprid were investigated with field‐collected larvae of the stonefly Protonemura sp. Endpoints were survival, growth, and/or emergence (depending on the developmental stage of the larvae at the start of the exposure). Two experiments conducted 1 yr apart showed good reproducibility: growth 10% effect concentration (EC10) values were 15.3 and 18.5 μg/L and no‐observed‐effect concentration (NOEC) values were 30.3 and 21.5 μg/L. A third experiment, performed with further‐developed larval instars, showed a significant effect of imidacloprid on emergence (with EC10 of 5.97 μg/L and NOEC of 2.89 μg/L) and a significant effect on survival (with median lethal concentration of 44.7 µg/L). The results of the present study show that the newly developed test system provides a suitable approach for toxicity testing with stonefly larvae and potentially for other lotic macroinvertebrate species. Environ Toxicol Chem 2021;40:2229–2239. © 2021 The Authors. Environmental Toxicology and Chemistry published by Wiley Periodicals LLC on behalf of SETAC.
INTRODUCTION
Lentic test systems like ponds are typically used in the risk assessment of pesticides, even though lotic water bodies like creeks and small streams are more typical for agricultural landscapes (Kreuger 1998; Mohr et al. 2012). Pesticides entering lotic water bodies can have significant effects on nontarget arthropods (Tisler et al. 2009). Particularly, standard laboratory tests performed in still‐water bodies may not be sufficient to assess ecological risks because it is difficult to extrapolate these results to ecosystems with different natural conditions. Testing of lotic species under stream conditions is therefore important for predictions of risks for nontarget species in realistic settings and to detect possible indirect effects at the population and ecosystem levels. For this, the test system must emulate the physical characteristics of the system in question as closely as possible (Belanger 1997). Almost all of the studies that have investigated the chronic effects of pesticides on macroinvertebrates were performed in glass beakers of various sizes, without flow conditions (Pestana et al. 2009a; Azevedo‐Pereira et al. 2011; Bottger et al. 2012; Roessink et al. 2013; Van den Brink et al. 2016). In some studies, movement of water in test systems is achieved by aeration or using magnetic stirring bars (Lacey and Mulla 1977; Colbo and Thompson 1978; Alexander et al. 2007). Studies performed in artificial indoor (Mohr et al. 2012) and outdoor stream mesocosms under flow conditions are usually performed for investigations of whole macroinvertebrate communities (Alexander et al. 2008; Beketov et al. 2008; Pestana et al. 2009a). For example, Canedo‐Arguelles et al. (2014), Wieczorek et al. (2018), and Zubrod et al. (2017) used indoor flow channels for investigations on abundance, drift, and emergence of macroinvertebrate communities exposed to different toxicants.
Only a few studies have used test systems simulating conditions of running water in a laboratory‐scale test design. For example, Rodrigues and Kaushik (1984) used a small laboratory‐scale test system, in which lotic test organisms were placed in glass troughs receiving running water from a tank. Other laboratory‐scale test systems generated flow conditions by using a paddlewheel (Jamnback and Frempong‐Boadu 1966; Gaugler et al. 1980; Pontasch and Cairns 1989). Kraus et al. (2014), Schmidt et al. (2018), and Balistrieri et al. (2020) used small experimental units (∼19‐L volume) in which a recirculating system was used to generate the water flow. Different recirculating systems were used by Raby et al. (2018a) and Sardiña et al. (2017) for testing of lotic species, demonstrating the ongoing development of test systems that mimic stream conditions. However, there is still a lack of suitable test systems for testing of lotic organisms under stream conditions, in particular regarding investigation of single organisms. Thus, the aim of the present study was to develop a new test system for the chronic testing of different lotic insect larvae which 1) provides a particular flow, 2) is sufficiently small for investigations under laboratory conditions, 3) enables testing and evaluation of effects on single organisms, and 4) reduces the use of adsorptive materials, thereby diminishing test substance losses.
Stonefly larvae were used as the test organisms in the present study because Ephemeroptera, Plecoptera, and Trichoptera (EPT) taxa are considered to be the aquatic insects most sensitive to organic pollutants (Wogram and Liess 2001; Raby et al. 2018b; Sibley et al. 2020). Species belonging to the EPT taxa play an important role in freshwater ecosystems but can be affected by pesticides, particularly by insecticides entering the water phase (Roessink et al. 2013; Morrissey et al. 2015; Camp and Buchwalter 2016; Cavallaro et al. 2017; Raby et al. 2018a). Recently, there has been some progress in the development of test systems and culturing methods for testing of EPT taxa, though mainly for mayflies from lentic systems (Sibley et al. 2020). Although in North America suitable test and culturing methods are available for Neocloeon triangulifer and Hexagenia spp. (Soucek and Dickinson 2015; Struewing et al. 2015; Soucek et al. 2018, 2020), in Europe, progress was made in testing and culturing of Cloeon sp. (Almudi et al. 2019). However, there is still only limited information on the effects of pesticides on these organisms, especially for sublethal long‐term effects like growth and emergence.
The neonicotinoid imidacloprid was chosen as the representative test substance because there are toxicity data available for this insecticide in multiple insect species. Imidacloprid (1‐[6‐chloro‐3‐pyridylmethyl]‐2‐nitroimino‐imidazolidine) is a neonicotinoid which is used for insect control in crops and for parasite control on cats and dogs (Dryden et al. 2000; Tomizawa and Casida 2005; Pisa et al. 2015). Globally, neonicotinoids are the most sold insecticides (Jeschke et al. 2011). Imidacloprid was introduced commercially in the early 1990s (Tisler et al. 2009; Roessink et al. 2013; Morrissey et al. 2015), and thereafter its use has steadily increased. It acts as an agonist of the nicotinic acetylcholine receptors, competing with the neurotransmitter acetylcholine and disrupting normal nerve functions in insects. After agricultural application, the insecticide can reach water bodies via spray drift or runoff (Tisler et al. 2009). The substance has been detected in streams and rivers and is known to be bioavailable to aquatic organisms (Alexander et al. 2007). Concentrations of imidacloprid in European surface waters of agricultural ecosystems range from 0.1 ng/L to 320 µg/L, though concentrations >100 µg/L are extremely rare (Morrissey et al. 2015). In the United States, concentrations of imidacloprid in surface waters were found to be between <2.0 and 42.7 ng/L (Hladik et al. 2014). Studies have indicated that especially nontarget lotic invertebrate species are extremely sensitive to imidacloprid (Alexander et al. 2008; Beketov et al. 2008; Pestana et al. 2009a; Roessink et al. 2013). Chronic exposures with mayfly larvae yielded 28‐d 10% effect concentrations (EC10s) of 0.024 to 0.033 µg/L and EC50s of 0.12 to 0.68 µg/L for mortality (Roessink et al. 2013; Van den Brink et al. 2016). Chronic exposures with stonefly larvae yielded 14‐d EC10 and EC50 values of 20.8 and 70.1 µg/L for mortality, respectively (Kreutzweiser et al. 2008).
By performing 3 experiments with stonefly larvae, Protonemura sp., exposed to 5 imidacloprid concentrations, the suitability of the new test system and the reproducibility of the test results were investigated.
MATERIALS AND METHODS
Test organisms and husbandry conditions
Test organisms
Stonefly larvae, Protonemura sp., are members of the Nemouridae family and belong to the order Plecoptera. The larvae of Protonemura are typical inhabitants of cold, clear streams and springs, where they are found at the bottom of the water column, on stones, or on fallen leaves. The larvae are shredders, feeding on biofilm, detritus, algae, diatoms, fungi, and bacteria, which they remove from the substrate (Feeley and Kelly‐Quinn 2015). The larval development of the stonefly larvae is univoltine, which means that a one‐generation cycle lasts 1 yr (Ludwig 1993).
The stonefly larvae used in the present study were collected at several times during the year from the Wester, a small stream in Schmallenberg, North Rhine Westphalia, Germany. The test organism was chosen on the basis of its year‐round availability at the collection site (Supplemental Data, Table S1). It was assumed that the different sizes of the larvae collected throughout the year represent different larval instars. The lengths of the full body and of the wing pads were used as criteria for defining larval instar and were determined with ImageTool (Ver 3.0; University of Texas Health Science Center 2002) using photos of representative larvae. Larvae of the same size and wing pad length were considered to be in the same larval instar and were used in the test.
The first experiment was performed with larvae collected in autumn (November 2016). One year later an experiment was performed at the same time to assess the reproducibility of the test. In addition, one experiment was performed in spring (February 2017). Larvae found in autumn were smaller and therefore assumed to be in an earlier larval instar than those collected in spring (Supplemental Data, Table S1). However, we were unable to assign a precise larval instar number to the collected larvae.
Acclimatization and husbandry conditions
After collection in the field, organisms were transferred to buckets containing original stream water and then transported to the laboratory, where they were identified and separated from other species. The organisms were held in a small artificial indoor stream system, which was placed in a water bath with an overhead light source for temperature and light control. The organisms were acclimatized to laboratory conditions for 10 to 14 d. During acclimatization, the original stream water was partly replaced by dechlorinated (filtered with active charcoal and aerated) tap water. After approximately 7 d, stream water was completely replaced by dechlorinated tap water. The water temperature during the acclimatization period was the same as the original temperature in the stream. The temperature was gradually raised to 13 ± 2 °C in the first experiment and 10 ± 2 °C in the following 2 experiments. The water was aerated to achieve an oxygen concentration near 100%. The photoperiod was a 16:8‐h light:dark cycle. The organisms were fed ad libitum with leaves from the original stream and ground fish food flakes (Tetramin®; Tetra).
Chronic testing
Test substance imidacloprid
The neonicotinoid imidacloprid (≤100% pure) was used as the test substance (Chemical Abstracts Service no. 138261‐41‐3) for the chronic toxicity testing of the stonefly larvae. Imidacloprid was purchased from Sigma‐Aldrich, Merck (Imidacloprid PestanalTM, analytical standard; batch no. BCBT2267).
Test conditions
For testing of stonefly larvae, dechlorinated tap water was used. Test conditions were comparable to those applied during the acclimation period. A semistatic test design was used with renewal of test media once per week. The temperature during the test was kept at 15.0 ± 2 °C in the first experiment and at 12.0 ± 2 °C in the following experiments. The photoperiod was a 16:8‐h light:dark cycle. Oxygen saturation was >95% during all tests. Water parameters (O2, pH, conductivity, NO3 –, NO2 –, NH4 +) were recorded in fresh and aged test media once per week at the time of medium renewal. Oxygen, pH, and conductivity were measured using the multiparameter device WTW Multi 1970i. For measurements of nitrate, nitrite, and ammonium, specific measurement kits purchased from Merchery and Nagel were used. All measured water parameters were in the same range in all tests (see Supplemental Data, Table S5). Temperature was slightly higher in the test performed in winter 2016 but was comparable in the following tests. To feed the larvae, 12.5 mg of fish flakes (finely ground Tetramin) was suspended in distilled water, filtered onto a glass fiber filter, and allowed to air‐dry. One filter was placed in each test cage, allowing the larvae to feed on the food on the filter. Filters were replaced weekly.
The test system consists of 6 containers, each representing a test unit with 10 small cages serving as replicates (Figure 1). Both containers and test cages were made of stainless steel. The cages had inside dimensions of 9.0 × 6.5 cm (length × width) and 5.6 cm (height). Each cage is at a distance of approximately 10 cm (inner edge) to 14 cm (outer edge) from the next cage. The test units (80 × 80 cm) are filled with 25 L purified tap water, which is aerated and temperature‐controlled. Aeration of the test solutions was provided by aeration pumps via glass pipettes, which are connected to the pump through flexible tubes. One aeration pump supplies 3 test units with oxygen. For temperature control, cooling coils made of stainless steel are introduced in the water body of each test container. The spirals are connected to a cooling system (Multiplex Python 125 2/3 BHP, type 01‐2295‐0001; Welbilt), which enables temperature control at ±2 °C in the 10 to 15 °C range. Rather than moving the water body, the small cages circulate inside the test unit, driven by a central propeller (Mädler; Asynchr. Mot., type M356A/4, 0.09–0.10 kW, 1340–1610 rpm). We used a flow rate of 0.1 m/s, on the basis of flow velocities used in earlier studies (Lowell et al. 1995; Berghahn et al. 2012; Bottger et al. 2012; Mohr et al. 2012) and the limitations of our test system. This flow rate is relatively minimal but sufficient to supply enough oxygen; at the same time, it avoids any influence from physical centrifugal forces, which could be caused by the circulation of the test system. Flow was measured using a flowmeter (Dostmann Electronic; MiniWater). Light sources were placed above each container to maintain the photoperiod. Because of the design of the apparatus, replicates (a cage holding one individual organism) are not fully independent, though do allow evaluation of individual‐based endpoints. The pseudoreplicate effect was minimized by spatial separation of the cages inside each container and by the fact that containers had a large water volume (25 L), thus limiting the potential influence of organisms on each other. The cages have stainless steel meshes in the front and back to allow the water to pass through. To avoid escape of any test organism, the mesh size in the back is 0.75 mm, whereas it is 1.0 mm in the front, to facilitate water inflow. To reduce the stress level for the test organisms, the natural habitat conditions of the stonefly larvae were simulated by placing a sand‐colored gravel mat (Aquagart®; Aquastone Stone Foil) on the bottom of each test cage. These mats have a material thickness of 5 mm maximum. Two black, flat, glass stones with a diameter of 30 to 45 mm, under which the organisms can hide, were introduced to each cage. The flat, glass stones were roughened before insertion, to provide a better grip for the organisms.
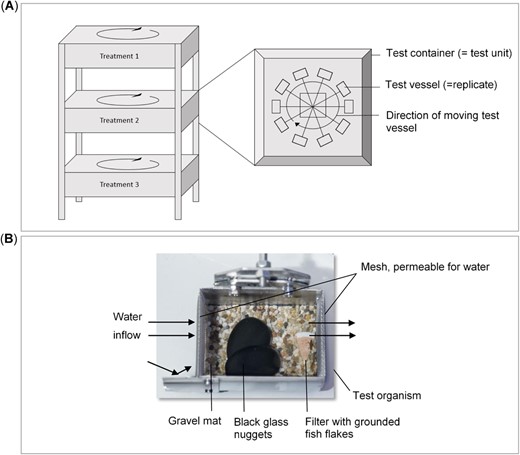
Schematical description of the developed test system. Test cages circulate inside a test container to create a target flow (A). Photo of a single test cage; arrows show the direction of the water flow (B).
Chronic endpoints
The observed endpoint differed depending on the larval instar, which was mainly determined on the basis of the length of the introduced test organisms. For this, photos were taken and length was recorded for each individual test organism using the software program Image Tool 3.0® (ImageTool, Ver 3.0; University of Texas Health Science Center 2002). In the first experiment performed in winter 2016, the lengths of the introduced test organisms at test start ranged from 0.295 to 0.558 cm over all treatments, with a coefficient of variation between 5.34 and 16.4%. In the experiment performed 1 yr after the first winter experiment, the lengths of larvae at test start ranged from 0.405 to 0.667 cm over all treatments (coefficient of variation = 7.61–15.7%). In the experiment performed in spring 2017, the lengths of introduced larvae at test start were between 0.601 and 0.883 cm over the treatments (coefficient of variation = 8.88–12.6%). In the experiments performed in winter, growth was used as an endpoint. The total length of each test organism was recorded at the beginning and at the end of the test. Data on organisms which died during the test were excluded from the evaluation of growth. Length of control organisms and respective coefficient of variations determined at test start and test end of the experiments are shown in Table 1. In the experiment performed in spring, test organisms were larger and, thus, in a later instar compared to the winter experiments. Because of the later developed state, the larvae emerged during the test. Thus, emergence was the only endpoint. In all experiments, larval emergence and any mortality were assessed once per week.
Length of test organisms in controls at test start and test end
| Length (cm), test start (CV) | Length (cm), test end (CV) | |
| Experiment 1 (Nov/Dec 2016) | 0.351–0.444 | 0.426–0.492 |
| (9.23%) | (5.01%) | |
| Experiment 2 (Nov 2017) | 0.452–0.631 | 0.498–0.723 |
| (9.78%) | (11.5%) | |
| Experiment 3 (Feb 2017) | 0.656–0.853 | n.d. |
| (8.91%) |
| Length (cm), test start (CV) | Length (cm), test end (CV) | |
| Experiment 1 (Nov/Dec 2016) | 0.351–0.444 | 0.426–0.492 |
| (9.23%) | (5.01%) | |
| Experiment 2 (Nov 2017) | 0.452–0.631 | 0.498–0.723 |
| (9.78%) | (11.5%) | |
| Experiment 3 (Feb 2017) | 0.656–0.853 | n.d. |
| (8.91%) |
CV = coefficient of variation; n.d. = not determined because organisms emerged during the test.
Test concentrations
All experiments were performed with 5 test concentrations and one control. Applied nominal concentrations in the experiments performed in winter were 1, 3, 9, 27, and 81 µg imidacloprid/L. Because of the lack of effects in the low concentrations in the winter experiments, the concentrations used in the experiment in spring 2017 were changed to 3, 9, 27, 81, and 243 µg imidacloprid/L. For preparation of test concentrations, a stock solution in acetone (10 mL) was made for each test concentration. This acetone solution was then diluted for each test concentration, resulting in one acetone application solution for each test concentration. Before test start and at each media renewal, 1 mL of each acetone solution was transferred and distributed along the glass wall of an empty 1‐L glass bottle. After complete evaporation of acetone, the glass bottle was filled with 1 L of purified tap water and stirred for approximately 2 h at room temperature. After stirring, the solution was added to the corresponding test container, which already contained 24 L of dilution water. After gentle agitation of the test medium, the test cages containing the test organisms were introduced to the test containers. This procedure enabled a better rate of dissolution of the test item in the water phase. Any traces of remaining acetone were shown to be without effect by demonstrating comparable results of the control and lower‐concentration treatments. Under the worst‐case scenario (none of the acetone had evaporated), the concentration of acetone in the test medium would have been 0.04 mL/L, still well below the typical limit of 0.1 mL/L.
Quantitative determination of imidacloprid in aqueous test media
Concentrations of imidacloprid in the water phase were measured by chemical analysis. Samples for chemical analysis were taken at test start from freshly prepared test media, at each media renewal from aged and fresh media, and at test termination from aged test media. For sampling, 5 mL of the exposure solutions were transferred to glass vials containing 1 mL of methanol for stabilizing and shaken thoroughly. Samples that could not be analyzed immediately were frozen at –20 °C until analysis. The quantitative determination of imidacloprid in aqueous test media was performed by direct liquid chromatography coupled with tandem mass spectrometry using positive electrospray ionization. Data were collected on a Waters 2695 liquid chromatography system coupled to a triple‐quadrupole Waters Quattro‐Micro tandem mass spectrometer. The liquid chromatography used a Phenomenex Gemini® C18 high performance liquid chromatography column (150 × 3 mm, 5 µm particle size) at a flow rate of 0.5 mL/min and a column temperature of 30 °C. The mobile phase consisted of solvent mixtures of water and methanol with 1 M ammonium acetate solution. The mass transition used for the quantification was m/z 256.00 > m/z 209.04, and the qualitative confirmation of the substance identity was carried out via the mass transition m/z 256.00 > m/z 175.10.
Matrix calibrations with the water/methanol solvent mixture (5+1, v+v) were performed on each measuring day using 8 calibration samples in a concentration range from 0.2 to 100 µg imidacloprid/L; the coefficients of determination (r 2) of the quadratic calibration functions were ≥0.999. The analytical method was successfully validated for the matrix test media/methanol (5+1, v+v) at 3 fortification levels (0.30, 3.00, and 90.0 µg imidacloprid/L) according to the European Union guideline SANCO/3029/99 (European Commission 2000) at a limit of quantitation of 0.3 µg/L. High accuracy was shown by mean recoveries of 98.4, 107.5, and 96.6%, averaging 100.8%. The precision of the method was shown by the repeatability values of 4.39, 1.74, and 0.94 and the overall mean relative standard deviation of 5.51%. Matrix‐charged procedural blanks and controls were run to assess possible cross‐contamination during laboratory work.
Data analysis/statistics
The following endpoints observed in the chronic test with stonefly larvae were evaluated quantitatively: growth, based on the difference in the length of each test organism measured at test start and test end; emergence; and mortality at test end. The evaluation of effects was based on the arithmetic mean measured imidacloprid concentrations. For each endpoint, the no‐observed‐effect concentration (NOEC), the lowest‐observed‐effect concentration (LOEC), and, if possible, the EC50 and EC10 were determined. Where possible, confidence limits were added. The NOEC and LOEC values were determined by analysis of variance. The Shapiro‐Wilks test and the Levene test were used to check for deviations from normality and homogeneity of variances. For data sets with normal distribution and variance homogeneity, the linear trend was examined by analysis of contrasts, followed by the parametric Williams multiple t test procedure. For data sets with normally distributed data with variance heterogeneity, the Welch t test for nonhomogenous variances with Bonferroni‐Holm correction was applied. The Bonferroni U test was applied for data which were not normally distributed but showed variance homogeneity. When the test results showed a concentration‐dependent relationship, the EC10 and EC50 (with 95% confidence interval) were determined by Probit analysis assuming a log‐normal distribution of the values. Statistical calculations were performed with the computer program ToxRat® Professional, Ver 3.2.1 (2015), a statistical software package for ecotoxicity response analysis.
RESULTS
Chemical analysis of imidacloprid
In all tests, imidacloprid concentrations remained relatively stable during the 1‐wk medium renewal intervals. For the experiment conducted in winter 2016, mean measured concentrations were 1.4, 6.3, 14.4, 30.3, and 86.5 µg/L for the nominal concentrations of 1, 3, 9, 27, and 81 µg/L, respectively (Supplemental Data, Table S2). For the experiment performed in winter 2017, mean measured concentrations were 1.0, 2.6, 7.6, 21.5, and 57.0 µg/L for the nominal concentrations of 1, 3, 9, 27, and 81 µg/L, respectively (Supplemental Data, Table S3). For the experiment performed in spring 2017, mean measured concentrations were 2.9, 9.1, 25.4, 75.1, and 226 µg/L for the nominal concentrations of 3, 9, 27, 81, and 243 µg/L, respectively (Supplemental Data, Table S4).
Effect assessment
In the first experiment performed in winter 2016, the mean increase in length over the test period was between 0.024 and 0.057 cm, with a clear concentration–dependent decrease of growth at higher test concentrations (Figure 2A). Probit analysis revealed an EC10 for growth of 15.3 µg/L (confidence interval 0.08–29.8 µg/L) and an EC50 of 62.2 µg/L (confidence interval 33.8–316 µg/L). The NOEC was 30.3 µg/L (determined with the parametric Williams test). None of the larvae emerged during the test. All organisms in the control group survived the 21‐d experiment, and statistically significant mortality was limited to the larvae in the highest concentration (Figure 2B). The 10% lethal concentration (LC10) was 39.5 µg/L (confidence interval not determined). The NOEC was 30.3 µg/L (determined by Welch's t test for nonhomogenous variances with Bonferroni‐Holm adjustment).
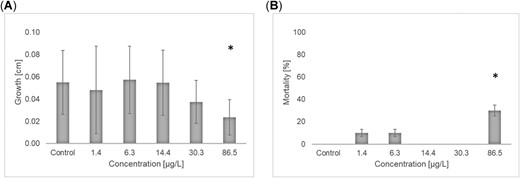
Effects of imidacloprid on growth (A) and mortality (B) in a 21‐d exposure of stonefly larvae, Protonemura sp., during winter 2016. Values are mean ± standard deviation. *Statistically significant effect (A, p < 0.05 one‐sided smaller, Williams t test; B, p < 0.1 one‐sided smaller, Bonferroni‐Welch t test).
In the experiment performed 1 yr after the first winter experiment, the mean increase in length was between 0.02 and 0.27 cm and differed among treatments in a concentration–dependent manner (Figure 3A). The EC10 and EC50 for growth were 18.5 and 55.3 µg/L, respectively (the data did not allow for the calculation of confidence limits). Using the nonparametric Bonferroni U test, the NOEC was determined to be 21.5 µg/L. Mortality was not statistically significantly affected (Figure 3B). In the experiment performed in spring 2017, emergence was used as the endpoint instead of growth because all control larvae emerged during the test. There was a significant and concentration‐dependent effect on the emergence of the test organisms over the tested concentrations. The EC10 for emergence was 5.97 µg/L (confidence interval 0.56–13.5 µg/L), and the EC50 was 35.1 µg/L (confidence interval 6.36–232 µg/L; Figure 4A). There was no indication that the larval size at the start of the experiment had any influence on the time of emergence. The NOEC was determined to be 2.90 µg/L using the parametric Williams test. There was a significant effect on survival at the 3 highest test concentrations (Figure 4B). The calculated LC10 and LC50 were 6.0 and 44.7 µg/L (confidence interval 0.56–13.5 and 23.9–88.3 µg/L), respectively. The NOEC for mortality was determined to be 2.89 µg/L using the Welch t test with Bonferroni‐Holm adjustment.
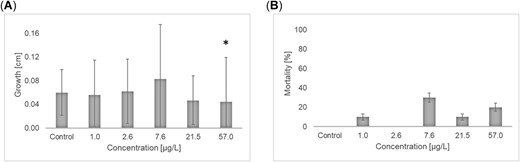
Effects of imidacloprid on growth (A) and mortality (B) in a 21‐d exposure of stonefly larvae, Protonemura sp., during winter 2017. Values are mean ± standard deviation. *Statistically significant effect (A, p < 0.1 one‐sided smaller, U test after Bonferroni‐Holm; B, p < 0.1 one‐sided smaller, Dunnett test).
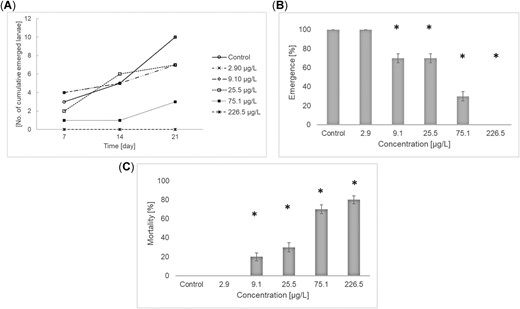
Effects of imidacloprid on emergence (A,B) and mortality (C) in a 21‐d exposure of stonefly larvae, Protonemura sp., during spring 2017. Values are mean ± standard deviation. *Statistically significant effect (B, p < 0.05 one‐sided smaller, Williams t test; C, p < 0.1 one‐sided smaller, Bonferroni‐Welch t test).
DISCUSSION
Test system—Importance of flow
There are several studies with stream insect larvae not performed under stream conditions but in conditions of a standing water body, for example, studies with stream insects performed by Kreutzweiser et al. (2008). Water flow ensures a continuous renewal of the water coming into contact with the gills, which is necessary for lotic larvae to obtain oxygen from the passing water (Lowell et al. 1995; Genkai‐Kato et al. 2000). Consequently, a test performed without flow could result in oxygen stress, which might influence the sensitivity of the test organisms. A few studies have used test systems designed to provide flow for tests with lotic invertebrates, often EPT fauna and including stone flies. A review by Belanger (1997) gives an overview of different model stream ecosystems and underlines the importance of providing water flow when testing lotic species to obtain realistic, relevant, and interpretable results for use in the risk assessment.
The measured flow velocity in the present study's test system was approximately 0.1 m/s and comparable to stream velocities used in several other indoor stream mesocosms (Alexander et al. 2008; Berghahn et al. 2012; Bottger et al. 2012; Mohr et al. 2012). Pontasch and Cairns (1989) used small artificial streams and showed that abundance for a lotic mayfly species was maintained over a 30‐d period at a flow of 0.3 m/s. This could not be shown in a parallel study performed without flow. Lowell et al. (1995) indicated that testing of lotic insect larvae required some flow, but there was no positive impact of increasing flow velocities.
In contrast to the stream systems typically used in field or laboratory studies, the test system used in the present study has the advantage of being much smaller. This makes it more practical and requires much less test solution. Indoor stream mesocosms used by Mohr et al. (2012), Berghahn et al. (2012), and Bottger et al. (2012) were approximately 75 m long and 1 m wide and were filled up to a height of 0.2 m, resulting in a volume of 15 000 L test medium. Smaller indoor stream systems were used by Jamnback and Frempong‐Boadu (1966), but these still require approximately 41 L of test medium. The present study's testing system has similarities with that described by Rodrigues and Kaushik (1984) for testing with blackfly larvae. That system is also small, permits easy access to individual organism, and is also made of an inert material (glass). However, the new system does not require tubes or filters, minimizing the potential for contamination and loss of the test substance by adsorption. A more recent small indoor stream system by Kraus et al. (2014), Schmidt et al. (2018), and Balistrieri et al. (2020), consisting of up to 36 experimental units with a volume of 18.9 L each, was developed for investigations on different lotic invertebrate taxa within whole insect communities. Invertebrate communities held in the experimental units were compared with those in river samples and showed consistent observations within 3 seasons and years (Schmidt et al. 2018).
In the present test system, environmental conditions with respect to flow, oxygen levels, temperature, light regime, and food supply are easily controlled. This allows for the use of conditions that reflect those in the field. The literature review by Belanger (1997) highlights the importance of providing realistic exposure conditions to reflect the complexity of the conditions found in the field and places this in its importance above the disadvantages of having pseudoreplicates.
The repeatability of the newly developed test system was demonstrated by performing 2 comparable studies in 2 successive calendar years in the same season (winter 2016 and 2017). Organisms were obtained from the same source and test conditions, and endpoints were identical. The evaluation of both winter experiments yielded similar effective concentrations, thereby proving the reproducibility and functionality of the test system.
Seasonality of effects
The present study conducted bioassays in 2 different seasons (winter and spring). Because of differences in age (and thus larval instar) of the larvae collected during the 2 seasons, different endpoints were used. The difference between the corresponding EC values of the experiments performed in winter (growth) compared to the experiment performed in spring (emergence) was lower than a factor of 3. Thus, results were in the same order of magnitude independent of the observed effect. A slightly higher sensitivity was observed in spring compared to winter. The sensitivity of field‐collected test organisms might depend on external effects caused by influences of natural or chemical stressors, for example, temperature, food limitation, increased predation pressure, or intraspecific competition (Mohr et al. 2012), resulting in highly variable ECx values even within the same species (Bottger et al. 2012). Season‐dependent differences in the sensitivity of lotic insect larvae during the course of the year were also observed in studies by Camp and Buchwalter (2016), Mohr et al. (2012), and Van den Brink et al. (2016). Seasonal effects are often unavoidable when organisms are collected from the field but could be avoided if the test organisms can be cultured in the laboratory. This would also minimize influences of environmental conditions at the time and place of field collection on the health and sensitivity of test organisms because it has been documented that these factors can influence test results (Mohr et al. 2012; Camp and Buchwalter 2016; Van den Brink et al. 2016). There have been recent advances in culturing of lentic macroinvertebrates. Almudi et al. (2019) describe the establishment of a continuous culture system for the mayfly laboratory model Cloeon dipterum (Baetidae family), giving access to all development stages and providing high numbers of synchronized larvae for usage in chronic toxicity testing. In North America, greater progress has already been made in the field of development of culturing methods and test protocols for the mayfly larvae Neocloeon triangulifer (Soucek and Dickinson 2015; Soucek et al. 2018, 2020; Sibley et al. 2020).
Implication of study results
Growth or emergence was chosen as the endpoint based on the larval development of the introduced stonefly larvae. After the 21‐d exposure to imidacloprid, a clear decrease in growth or emergence of test organisms was observed. Reduced body size is correlated with reduced reproductive success of insect populations. This correlation of adult and larvae size with fecundity is particularly described for larvae of different mayfly species (Peckarsky et al. 1993, 2001; Giberson and Rosenberg 1994; McPeek and Peckarsky 1998) but was also found for several other species (Honěk 1993). Alexander et al. (2008) demonstrated that imidacloprid exposure leads to less developed organisms with a smaller adult body size as well as reduced emergence in mayfly larvae of Epeorus spp. and Baetis spp. Imidacloprid acts on the organisms via ingestion or direct contact, thereby blocking the nicotinergic neuronal pathway and affecting growth and feeding behavior (Matsuda et al. 2001; Tomizawa and Casida 2005; Alexander et al. 2008; Pestana et al. 2009a; Nyman et al. 2013). In the present study, a possible effect caused by accumulated imidacloprid in the food provided was not investigated. Therefore, it cannot be distinguished whether the observed effects were caused by the water exposure directly or if the uptake of imidacloprid via food may have contributed to the observed effects. The influence of imidacloprid by food uptake was investigated in a chronic 14‐d microcosm study with stonefly larvae (Pteronarcys dorsata) by Kreutzweiser et al. (2009). Providing imidacloprid‐treated leaves for feeding resulted in significantly inhibited feeding and increased mortality.
Comparison of observed sensitivity with that of other insects and invertebrates
Most of the data regarding chronic toxicity of imidacloprid in insects refer to mortality (or immobilization as a proxy for mortality). Only a few studies used sublethal endpoints such as feeding inhibition or growth reduction. A review of imidacloprid toxicity data in insects and other aquatic invertebrates showed high sensitivities with respect to mortality and immobilization (Roessink et al. 2013; Van den Brink et al. 2016; Table 2). Ephemeropteran species, which are generally considered to be very sensitive toward organic compounds (Wogram and Liess 2001; Raby et al. 2018b), were affected by imidacloprid more than stoneflies. Crustaceans such as Asellus aquaticus and Gammarus pulex were more sensitive, whereas Daphnia magna was shown to be less sensitive compared to stonefly larvae. In addition, aquatic insects such as flies (Chaoborus abscuripes, Chironomus riparius), moths (Sialis lutaria), bugs (Plea minutissima), and caddis flies (Sericostoma vittatum) were more strongly affected, whereas effects on crane fly (Tipula sp.) were comparable to those on stoneflies. Only a few data on investigations of stonefly larvae could be found in the literature. Kreutzweiser et al. (2008) performed a lentic microcosm study with imidacloprid. Evaluation of stonefly larvae (Pteronarcys dorsata) after 14‐d exposure to imidacloprid showed comparable results to the present study with stonefly larvae (Table 2). However, more studies with stoneflies are needed to confirm similarities in the findings.
Results of chronic toxicity studies performed with invertebrates exposed to imidacloprid
| EC10 (µg/L) | EC50 (µg/L) | NOEC | LOEC | ||||
| Species | Endpoint | Test system | (95% CI) | (95% CI) | (µg/L) | (µg/L) | Ref. |
| Crustaceans | |||||||
| Asellus aquaticus | Immobilization 28 d | 1.5‐L jar | 1.13 (0.386–7.55) | 11.9 (5.94–23.7) | — | — | Roessink et al. 2013 |
| Gammarus pulex | Immobilization 28 d | 1.5‐L jar | 2.95 (1.15–7.59) | 15.4 (9.80–24.1) | — | — | Roessink et al. 2013 |
| Daphnia magna | Immobilization 48 h | Glass beakers | 22 500 (n.d.) | 56 600 (34.4–77.2) | — | — | Tisler et al. 2009 |
| Daphnia magna | Immobilization 21 d | Glass beakers | — | — | 1250 | 2500 | Tisler et al. 2009 |
| Insects | |||||||
| Chaoborus obscuripes | Immobilization 28 d | 1.5‐L jar | 4.57 (2.05–10.2) | 11.8 (8.17–17.1) | — | — | Roessink et al. 2013 |
| Sialis lutaria | Immobilization 28 d | 0.5‐L jar | 1.28 (0.382–4.31) | 3.46 (1.86–6.44) | — | — | Roessink et al. 2013 |
| Ple minutissima | Immobilization 28 d | 1.5‐L jar | 2.03 (1.26–3.28) | 6.45 (4.81–8.64) | — | — | Roessink et al. 2013 |
| Tipula sp. | Mortality 14 d | Aquatic microcosm | 16.2 (–0.3 to 32.7) | 139 (103–175) | — | — | Kreutzweiser et al. 2008 |
| Sericostoma vittatum | Feeding inhibition 10 d | Glass beakers | — | — | 1.9 | 3.9 | Pestana et al. 2009b |
| Chironomus riparius | Growth reduction 10 d | Glass beakers | — | — | 0.4 | 1.2 | Pestana et al. 2009b |
| Mayflies | |||||||
| Cloeon dipterum | Immobilization 28 d | 1.5‐L jar | 0.033 (0.012–0.090) | 0.123 (0.075–0.201) | — | — | Roessink et al. 2013 |
| Cloeon dipterum | Immobilization 28 d (summer) | 1.5‐L jar | — | 0.68 (0.45–1.0) | — | — | Van den Brink et al. 2016 |
| Cloeon dipterum | Immobilization 28 d (winter) | 1.5‐L jar | — | 0.13 (0.070–0.23) | — | — | Van den Brink et al. 2016 |
| Caenis horaria | Immobilization 28 d | 0.5‐L jar | 0.024 (0.006–0.091) | 0.126 (0.070–0.228) | — | — | Roessink et al. 2013 |
| Epeorus longimanus | Mortality 96 h | Glass beakers | — | 0.65 (0.5–0.8) | — | — | Alexander et al. 2008 |
| Stoneflies | |||||||
| Pteronarcys dorsata | Mortality 14 d | Aquatic microcosm | 20.8 (13.9–27.7) | 70.1 (63.8–76.4) | — | — | Kreutzweiser et al. 2008 |
| Protonemura sp. | Growth 21 d | Rotating indoor test system | 15.3 (0.08–29.8) | 62.2 (33.8–316) | 30.3 | 86.5 | Present study |
| Growth 21 d | 18.5 | 55.3 | 21.5 | 57.0 | Present study | ||
| n.d. | n.d. | ||||||
| Emergence 21 d | 5.97 (0.56–13.5) | 35.1 (6.36–232) | 2.89 | 9.01 | Present study |
CI = confidence interval; EC10/EC50 = 10/50% effect concentration; LOEC = lowest‐observed‐effect concentration; NOEC = no‐observed‐effect concentration; — = no information available; n.d. = not determined.
CONCLUSIONS
For testing of lotic insect larvae under laboratory conditions, a new test system was developed to simulate more of the conditions found in the field to provide a more realistic system for ecotoxicological testing. Using the test substance imidacloprid, the functionality and suitability of the new test system were demonstrated. In addition, the relative neonicotinoid sensitivity was determined for the lotic stonefly Protonemura sp. The test results showed that it is feasible to use different endpoints (growth or emergence) as a function of the season, thus providing broader information for effect assessments. Comparison of the results of the present study with results from the literature search emphasizes that there is a great need for chronic toxicity tests, particularly with lotic insect larvae.
Supplemental Data
The Supplemental Data are available on the Wiley Online Library at https://doi.org/10.1002/etc.5070.
Acknowledgement
We thank P. Greve for support with the design and construction of the test system. We also thank K. Schlich for support and T. Clark for proofreading the manuscript.
Data Availability Statement
Data, associated metadata, and calculation tools are available from the corresponding author ([email protected]).
REFERENCES
