


Abstract
Waterborne contaminants were monitored in 69 tributaries of the Laurentian Great Lakes in 2010 and 2014 using semipermeable membrane devices (SPMDs) and polar organic chemical integrative samplers (POCIS). A risk‐based screening approach was used to prioritize chemicals and chemical mixtures, identify sites at greatest risk for biological impacts, and identify potential hazards to monitor at those sites. Analyses included 185 chemicals (143 detected) including polycyclic aromatic hydrocarbons (PAHs), legacy and current‐use pesticides, fire retardants, pharmaceuticals, and fragrances. Hazard quotients were calculated by dividing detected concentrations by biological effect concentrations reported in the ECOTOX Knowledgebase (toxicity quotients) or ToxCast database (exposure–activity ratios [EARs]). Mixture effects were estimated by summation of EAR values for chemicals that influence ToxCast assays with common gene targets. Nineteen chemicals—atrazine, N,N‐diethyltoluamide, di(2‐ethylhexyl)phthalate, dl‐menthol, galaxolide, p‐tert‐octylphenol, 3 organochlorine pesticides, 3 PAHs, 4 pharmaceuticals, and 3 phosphate flame retardants—had toxicity quotients >0.1 or EARs for individual chemicals >10–3 at 10% or more of the sites monitored. An additional 4 chemicals (tributyl phosphate, triethyl citrate, benz[a]anthracene, and benzo[b]fluoranthene) were present in mixtures with EARs >10–3. To evaluate potential apical effects and biological endpoints to monitor in exposed wildlife, in vitro bioactivity data were compared to adverse outcome pathway gene ontology information. Endpoints and effects associated with endocrine disruption, alterations in xenobiotic metabolism, and potentially neuronal development would be relevant to monitor at the priority sites. The EAR threshold exceedance for many chemical classes was correlated with urban land cover and wastewater effluent influence, whereas herbicides and fire retardants were also correlated to agricultural land cover. Environ Toxicol Chem 2021;40:2165–2182. Published 2021. This article is a U.S. Government work and is in the public domain in the USA. Environmental Toxicology and Chemistry published by Wiley Periodicals LLC on behalf of SETAC.
Abstract

INTRODUCTION
The Laurentian Great Lakes basin and associated tributaries include watersheds that range from relatively pristine forests and wetlands to agricultural areas, industrial centers, and urban environments. Sources within each of these land‐use areas can contribute a suite of chemical contaminants to streams, posing a potential threat to aquatic biota and other wildlife. Research on tributaries of the Great Lakes has confirmed that contaminants are present in water samples (Baldwin et al. 2016; Elliot et al. 2017), fish tissues (Choy et al. 2017), freshwater mussels (Kimbrough et al. 2018), and tissues of terrestrial and avian wildlife that reside nearby (Custer et al. 2016; Kraus et al. 2017; Walters et al. 2018).
Understanding the potential impacts of these contaminants on exposed Great Lakes fish and wildlife and the ecosystem services they provide is a significant challenge. Reliable information (e.g., water quality benchmarks from the US Environmental Protection Agency [USEPA] or Canadian Council of Ministers of the Environment) to identify concentrations that pose a potential ecological hazard is available for only a fraction of the chemicals that are included in the monitoring programs (Tang et al. 2013; Baldwin et al. 2016). Where established water quality benchmarks are lacking, the peer‐reviewed literature can be a source of toxicity information. However, it can be very time‐intensive to conduct detailed chemical‐specific literature searches and compile the results considering such factors as the different species tested, endpoints examined, and durations of exposure. The USEPA's ECOTOX Knowledgebase (US Environmental Protection Agency n.d.) offers a tractable alternative to de novo literature search and assembly. As of June 2020, the ECOTOX knowledgebase had captured information on over 12 000 chemicals from over 50 000 peer‐reviewed studies and 13 000 species (US Environmental Protection Agency n.d.). As such, ECOTOX can be a useful and efficient source for gathering toxicity information that can help put detected levels of chemical concentrations into context for prioritization purposes.
Another emerging source of toxicity information comes from high‐throughput screening (HTS) programs like the ToxCast and Tox21 programs, hereafter referred to as ToxCast (Dix et al. 2007; Kavlock et al. 2012; Tice et al. 2013). The ToxCast program includes information on biological activities for several hundred HTS assays that characterize a range of cell responses and approximately 300 signaling pathways (Kavlock et al. 2012; Tice et al. 2013) for >9000 chemicals. Summary metrics, such as the activity concentration at cutoff (ACC), that estimate consistent measures of bioactivity among the different chemicals have been used as estimates of toxicological potency in relation to specific biological targets or pathways. Consequently, consideration of a ratio between exposure concentrations detected in the environment and ACCs in various ToxCast assays (exposure–activity ratios [EARs]) provides a means for prioritizing chemicals based on both their concentration and relative potency to interact with specific biological targets (Blackwell et al. 2017, 2019; Elliott et al. 2018; Bradley et al. 2019, 2020; Corsi et al. 2019).
Although EARs can be calculated for any measured chemical concentration, prioritization can be improved by obtaining samples that are more representative of an organism's exposure over time. Traditional discrete (i.e., grab) sampling methods are well established but only provide information on a single point in time. A rigorous discrete sampling scheme capable of capturing some of the inherent variability in the occurrence and concentration of chemicals in the water can be both logistically and financially prohibitive. Other techniques such as autosamplers can address some of the temporal aspects of sample collection, but these instruments are expensive and can have specific infrastructural needs, limiting their applicability in monitoring programs with numerous study locations. Passive sampling technologies can overcome the limitations of these methods. Passive samplers sample chemicals from the dissolved phase in the water column continuously over a period of weeks to months (Huckins et al. 2006). Often, samples from passive samplers represent much larger volumes of water sampled (tens to hundreds of liters of water) than could be obtained by traditional methods (Huckins et al. 2006; Alvarez 2010). This can result in the measurement of chemicals at considerably lower but still biologically relevant concentrations than would be possible with a common water sample of 1 L or less (Kolpin et al. 2013; Van Metre et al. 2017). However, the practical volume passive samplers can also be limited by the size (sorptive volume) of device that can be deployed (Kahl et al. 2014).
Obtaining samples which are relevant to the exposure of organisms is a challenge for ecotoxicologists (Huckins et al. 2006). Samplers such as the semipermeable membrane device (SPMD) and the polar organic chemical integrative sampler (POCIS) can provide data on the time‐weighted average concentration of select chemicals in the water column, which can be a reasonable estimate of an organism's exposure to dissolved chemicals (Huckins et al. 2006). Extracts from SPMDs and POCIS have frequently been screened by in vitro (e.g., estrogen assays, ethoxyresorufin‐O‐deethylase (EROD), Microtox, vitellogenin induction, Ames, and effects‐directed analysis studies) and in vivo (e.g., tadpole development, fish injections) tests to identify biological effects related to exposure to a chemical or mixture of chemicals (Parrott and Tillitt 1997; Petty et al. 2000; Bridges et al. 2004; Johnson et al. 2004; Rastall et al. 2004; Vermeirssen et al. 2005; Alvarez et al. 2008, 2013; Brennan et al. 2020).
The present study utilized SPMDs and POCIS deployed at 69 Great Lakes tributary sites in 2010 and 2014 to estimate long‐term biologically relevant concentrations of waterborne contaminants. Exposure data from targeted chemical analyses were compared with effect concentrations derived from toxicity data from the ECOTOX knowledgebase and/or HTS results from ToxCast through the toxEval R package to prioritize individual chemicals and chemical mixtures, identify sites with a higher risk for biological impact, and identify apical adverse effects that are plausibly linked to the biological pathways likely to be impacted.
MATERIALS AND METHODS
Site selection and field sampling
The SPMDs and POCIS were codeployed for 26 to 36 d between September and November of 2010 and for 26 to 60 d between April and July of 2014 to provide a time‐weighted average of dissolved concentrations of select organic contaminants. Sixty‐nine sites encompassing tributaries along the US side of each of the Great Lakes across the states of Indiana, Michigan, Minnesota, New York, Ohio, and Wisconsin, which account for >70% of the flow from the US side of the Great Lakes, were selected (Baldwin et al. 2016). Sites were colocated with existing National Monitoring Network for US Coastal Waters sites and included watersheds with at least one wastewater‐treatment plant (Baldwin et al. 2016). Sites were selected to represent a wide range of land cover attributes, including 0.4 to 99% urban land cover, 0 to 91% agricultural land cover, and 0.1 to 66.6% forested land cover (Figure 1; Supplemental Data, Table SI‐1). Fifty‐five sites were sampled in 2010, and 37 sites were sampled in 2014. Of the 69 sites sampled across both periods, 32 were unique to 2010 and 14 were unique to 2014 (23 sites in common between years).
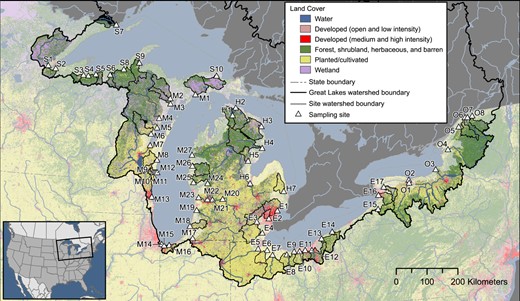
Map of sample sites and associated land cover. Identification of site codes is presented in Figure 4 and in Supplemental Data, Table SI‐1. Map base layers derived from Department of Agriculture and Agri‐Food Canada 2020; Homer et al. 2015; Instituto Nacional de Estadística Geografia e Informática et al. 2006a, 2006b; Steeves and Nebert 1994; US Department of Agriculture–Natural Resources Conservation Service et al. 2009.
Passive samplers
Passive sampler construction
For each deployment, SPMD and POCIS passive samplers were constructed at the US Geological Survey, Columbia Environmental Research Center (CERC), according to established protocols (Alvarez et al. 2008). For each site, a protective deployment canister was prepared containing 2 SPMDs and 3 POCIS. The SPMDs were spiked with a mixture of performance reference compounds (PRCs) including phenanthrene‐d 10, pyrene‐d 10, and polychlorinated biphenyl (PCB) congeners 14, 29, and 50. Dibenz[a,h]anthracene‐d 14 was included in the PRC mixture as a photolysis marker to measure the potential photodegradation of sequestered polycyclic aromatic hydrocarbons (PAHs) during the field deployment. For deployment, the passive samplers were removed from their sealed shipping containers, secured to a post at approximately 1 foot above the streambed, and left in place for 26 to 60 d. Passive samplers were removed after deployment and shipped overnight to CERC for processing.
Sampler processing and analysis
Following the field deployment, the SPMDs were processed and analyzed for organochlorine pesticides, total PCBs, polybrominated diphenyl ether (PBDE) flame retardants, and PAHs. The POCIS were analyzed for a suite of organic wastewater‐related chemicals (OWCs) including herbicides, insecticides, pharmaceuticals, fragrances, plasticizers, surfactants, antimicrobial disinfectants, and flame retardants. In total, 185 chemicals were targeted for analysis between the SPMD and POCIS (Supplemental Data, Table SI‐2).
Methods for processing and analyzing SPMDs and POCIS have been previously reported (Alvarez et al. 2008, 2009, 2014, 2021; Supplemental Data). Briefly, analytes of interest were recovered from the SPMDs using a dialysis process and then fractionated to isolate the chemicals from potential interferences using a combination of size exclusion chromatography and various gravity flow adsorptive column separations. The organochlorine pesticides, PCBs, and PBDEs were analyzed using gas chromatography with electron capture; and the PAHs were analyzed using gas chromatography/mass spectrometry (GC/MS; Alvarez et al. 2008, 2009). The OWCs were extracted from the POCIS sorbent prior to analysis using GC/MS (Alvarez et al. 2009, 2014). Time‐weighted average water concentrations of chemicals were estimated from residues measured in the SPMD and POCIS using uptake models (Huckins et al. 2006; Alvarez 2010) and either experimentally or theoretically derived sampling rates (R s; Supplemental Data, Table SI‐2).
Quality control
For each deployment, a series of field blanks, representing a minimum of 10% of the study sites, were prepared and shipped with the samplers. Fabrication blanks for both SPMD and POCIS were stored at <–20 °C in the laboratory. All blanks were processed concurrently with the field‐deployed samplers. To the extent possible, matrix spikes were used to determine method performance for the targeted chemicals. The PRC data from the fabrication and field blank SPMDs were used in the calculation of the estimated water concentrations to reduce bias due to recoveries of PRCs during processing (Alvarez 2010).
With a few exceptions, detections of analytes in the blanks were sporadic, generally not detected at all or below the lowest instrumental calibration level. The most common chemicals measured in blanks included phthalates, phenanthrene, fluoranthene, and pyrene. Detection of chemicals in the blanks was accounted for in the determination of method detection (MDL) and quantitation levels (MQL), where the MDL is equal to the mean plus 3 times the standard deviation (SD) of the blank concentrations, and the MQL is the mean plus 10 times the SD of the blank concentrations (Keith 1991; Supplemental Data). This approach adjusted the data for any potential blank contamination and analytical sensitivities. A field replicate was deployed at one site in 2010 and 3 sites in 2014. The mean relative percent differences between replicates at each site ranged from 26 to 107%. Differences between replicate values were not unexpected because each replicate was an individual sampler deployed within the same general vicinity within a site but potentially experienced different environmental conditions which could have affected chemical availability and uptake. In some cases, the larger percentage differences could be attributed to increased error of measurements very close to the analytical detection limits.
ToxCast screening values
Results from Ver 3.2 of the ToxCast database (US Environmental Protection Agency 2020) were used to identify biological activities associated with chemicals detected from the passive samplers and estimate their relative potencies on an assay‐specific basis. The ToxCast program evaluates individual chemicals for interactions with, or effects on, cells, proteins, DNA, RNA, mitochondria, receptors, enzymes, and so on (Judson et al. 2009). Methods for the use of ToxCast data and choice of appropriate ToxCast assays for evaluating potential biological effects of chemicals measured in water quality samples followed previously published techniques (Blackwell et al. 2017; Corsi et al. 2019) and are described briefly in the present study. Assays used in this analysis were chosen from the original list of ToxCast assays based on consideration of data quality remarks, examination of dose–assay response curves, redundancy of ToxCast information, and the nature of the assays and the associated reliability/quality for detecting gain or loss of signal. This process reduced the original 740 assays available for measured chemicals to 321 assays considered to be appropriate and used in this analysis. Additional details on the rationale for assay inclusion or exclusion and a list of the final assays are provided in the Supplemental Data, text and Tables SI‐3 and SI‐4.
The ToxCast data analysis pipeline computes several summary metrics modeled from chemical dose–assay response curves. For the present study, the ACC was chosen for comparison with estimated water concentrations, similar to previous efforts (Blackwell et al. 2017; Fay et al. 2018; Corsi et al. 2019). More thorough descriptions of its derivation are provided elsewhere (Judson et al. 2009; Filer et al. 2016) and summarized in the Supplemental Data.
Of the 143 chemicals detected in the tributary passive samplers, 112 (78%) were represented in ToxCast (i.e., tested in at least one ToxCast assay), and 100 had measurable effects (i.e., at least one active “hit call”) within the range of concentrations tested and met the inclusion criteria (Figure 2). The number of assays with measurable effects per chemical varied from 1 to 94 (Supplemental Data, Table SI‐2).
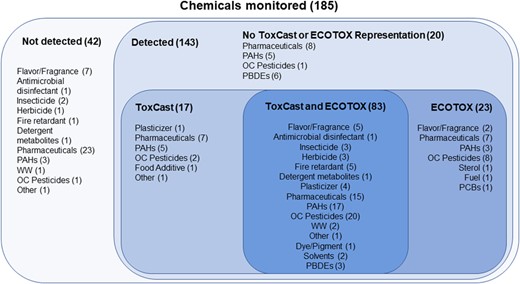
Chemicals with information from ToxCast and ECOTOX used in the present study from passive samplers deployed at 69 sites within 62 tributaries of the Great Lakes, in 2010 and 2014. Number of chemicals represented in each category is shown in parentheses. PAH = polycyclic aromatic hydrocarbon; WW = wastewater; OC = organochlorine; PBDE = polybrominated diphenyl ether; PCB = polychlorinated biphenyl.
Response endpoints archived in the ECOTOX Knowledgebase were also used for comparison to concentrations of measured contaminants. The Chemical Abstract Service number was entered on the search page for each of the chemicals that were detected, and aquatic endpoints were retrieved. Endpoints that were reported as “exposure type” aquatic, static, flow‐through, renewal, lentic, and lotic were considered. Data were further reduced by selecting relevant endpoints that excluded accumulation studies, excluded tests on formulations rather than the active ingredient, included only values reported as aquatic concentrations for freshwater assays, and excluded results that were reported as not statistically significant. The remaining endpoints were categorized into 2 groups based on the reported “effects” attribute: group 1 included apical or ecologically relevant endpoints that are most commonly used in formal hazard assessment (effect = reproduction, mortality, growth, development, population, and behavior), and group 2 included other measures of bioactivity (effect = avoidance, biochemistry, cell[s], ecosystem process, enzymes, feeding behavior, genetic[s], histology, hormone[s], immunological, injury, intoxication, morphology, multiple, or physiology). Several endpoints were excluded because results were anomalously low (several orders of magnitude lower than other endpoints). These included studies with the ECOTOX Knowledgebase reference numbers 11628, 11170, 168095, 171681, 67566, and 157699. Information on references for individual studies is available from the data retrieval process described and review of the columns titled “Reference Number,” “Author,” “Title,” “Source,” and “Publication Year.”
Of the 143 chemicals detected in the tributary passive samplers, 106 (74%) were represented in ECOTOX, 89 of which were also represented in ToxCast and 23 that were not (Figure 2). A total of 20 777 endpoints were represented after applying the inclusion criteria described (Supplemental Data, Table SI‐5). The number of endpoints per chemical varied from 1 to 941 (Supplemental Data, Table SI‐6).
Data analysis procedures
Screening for potential pathway‐based effects
Techniques used in this analysis follow those used in previous research (Blackwell et al. 2017; Corsi et al. 2019). An abbreviated description of these techniques is as follows. The potential biological relevance of detected chemicals was screened by comparing effect concentrations in ToxCast to measured chemical concentrations using EAR values as the quotient of the measured concentration and the ACC for each chemical–assay combination (Equation 1).
The EAR is analogous to a hazard quotient, but rather than relying on a concentration at which adverse health effects like impaired survival, growth, or reproduction are detected, the concentration required to elicit a response in a pathway‐based assay is used. An EAR >1 indicates that the measured concentration in a water sample was greater than the ACC in the assay medium. Results were examined using several different EAR summations that represented individual chemicals and chemical mixtures. Each summation was used to address a different question. For example, multiple assays may have relevant information for individual chemicals. In these cases, the sum of EAR values from all assays for an individual chemical in a given sample (EARchem) was used to help screen and prioritize chemicals by potential for biological effect (Equation 2).
When there was more than one sample per site (23 of the 69 monitoring sites), EARSiteChem was determined as the maximum EARchem per site and used to compare among sites (Equation 3). Both EARchem and EARSiteChem were used for ranking and prioritizing among chemicals for a given sample with regard to their potential to elicit a biological effect.
In Equations 2 and 3, i represents assays relevant for each individual chemical and j represents samples collected at the selected site.
As an indication of the potential for effects from prescribed chemical classes (e.g., pesticides, pharmaceuticals, and PAHs) and to compare among different classes at individual sites, EARClass was computed as the sum of EARchem values for all chemicals within a given class for each sample (Equation 4).
In Equation 4, i represents chemicals within a class for each sample.
The EARchem, EARSiteChem, and EARClass values do not discriminate by biological pathways but provide a summation of all potential effects evaluated in ToxCast. This approach provided a conservative estimate of the cumulative EAR for chemicals that influence multiple pathways that may or may not act in an additive fashion. An alternate approach focused on effects to individual biological pathways and included the evaluation of chemical mixtures: the sum of EAR values for each assay endpoint across all chemicals (EARMixture) for a given sample was computed (Equation 5). The EARMixture value provided an estimate of potential cumulative bioactivity for an individual assay from a mixture of chemicals, assuming additivity of effects. This was consistent with previous use of EARMixture for individual assays (Blackwell et al. 2017; Corsi et al. 2019) and is analogous to a “toxic unit” approach for summing adverse effects for similar‐acting chemicals present in complex mixtures (Nirmalakhandan et al. 1994). When there was more than one sample per site, EARSiteMixture was determined as the maximum EARMixture per site and used to compare among sites (Equation 6).
In Equations 5 and 6, i represents chemicals associated with individual assays and j represents samples collected at the selected site.
The frequency of occurrence of chemicals among sites and the exceedance of EAR thresholds were then used to help prioritize chemicals, ToxCast assays, and chemical mixtures to identify a manageable number of situations for which there is potential for adverse impacts.
Previous evaluations of chemicals that may be of concern biologically by using EAR values as well as toxicity quotients (TQ; Equation 7) were conducted based on water quality benchmarks established by agencies such as the USEPA and the Canadian Council of Ministers of the Environment (Corsi et al. 2019).
In that previous study, an EAR value of 10–3 resulted in a similar list of chemicals of concern when using a toxicity quotient threshold of 0.1 (measured concentration = 10% of the water quality benchmark). A toxicity quotient threshold of 0.1 is also used for the present study as a conservative approach considering that the measured concentrations do not represent the full variability in concentrations that are present in monitored streams. In the present study, there were 83 chemicals where information was available for both ToxCast and ECOTOX. Comparing the threshold concentrations for these 2 methods (ACC values × 10–3 and ECOTOX benchmark concentrations × 0.1) indicated that the EAR method was more conservative for 34 of these chemicals and that the toxicity quotient method was more conservative for 49 chemicals. There was wide variability between these 2 benchmark sources: the 95th and 5th percentiles of the ratio of EAR to toxicity quotient threshold concentrations were 9.6 × 10⁻⁴ and 4.9 × 10², respectively. This variability is not unexpected: ToxCast is based on in vitro assay results, whereas many of the ECOTOX results are based on apical results from in vivo testing. This comparison did not result in information that warranted a change in ToxCast threshold values, so the previously established EAR threshold of 10–3 was used as a threshold in the present study as well. Exceedance of this EAR threshold was used to identify sites that had potential for monitored chemicals to have a biological impact, and the number of sites with EAR threshold exceedance was used for ranking and prioritization of chemicals. Individual chemicals were identified as a priority when EARSiteChem exceeded 10–3 at 10% or more of the monitored sites, and chemical mixtures were identified as a priority when EARSiteMixture exceeded 10–3 at 10% or more of sites.
For chemical concentrations reported as below the level of detection, EAR values were assumed to be zero. To test the potential impact of this, EAR values were computed as a ratio of the detection limit for each compound and all available ACC values (Supplemental Data, Figure SI‐1). The EAR values from the minimum ACC for each compound varied from <10–8 to 0.257 and were >10–3 for 17 compounds. This suggests that concentrations below the analytical detection limits could still elicit a significant biological effect and that EAR values may be underestimated in these instances. Hence, chemical analyses with lower detection levels would be needed to evaluate whether presence of these chemicals may be of concern. The addition of passive samplers helps address analytical detection limit issues because the sample collected is integrated over time, resulting in an increased mass of chemical available for detection than may be possible with a traditional grab sample.
Water chemistry data were also screened to assess their potential for adverse effects by comparing endpoint‐specific effect concentrations from the ECOTOX Knowledgebase to measured chemical concentrations using toxicity quotient values as the quotient of the measured concentration and the biological effect concentrations estimated for the various endpoints (Equation 7). The lowest effect concentration for each of the ECOTOX groups for each chemical was used in the final toxicity quotient determination. Individual chemicals were identified as a priority when toxicity quotient exceeded 0.1 at 10% or more of the monitored sites. Results from ECOTOX group 1 were summarized separately from those of ECOTOX group 2.
The Wilcoxon rank sum test was used to compute correlations between major land uses within the watersheds and EAR values for chemicals and chemical classes, with the significance level evaluated at p = 0.05. Computations and analyses were primarily carried out using the functionality of the R package toxEval (De Cicco et al. 2018) with additional custom calculations and visualizations developed using R packages within the tidyverse family of packages (Wickham et al. 2019) and base R functionality (R Development Core Team 2019).
Potential for adverse effects
Most biochemical responses associated with assays represented in ToxCast do not directly translate to endpoints commonly considered in ecological risk assessments (i.e., impacts on survival, growth, reproduction, etc.). Two approaches were used to gain insight into potential adverse outcomes and biological pathways: the adverse outcome pathway (AOP) and functional annotations associated with ToxCast assay gene targets. The AOP framework has previously been used in assessment of water quality data to help interpret the significance of EAR results for estimation of potential ecological impact (Corsi et al. 2019; Ankley et al. 2021) and is briefly described in the present study. The ToxCast assays have been mapped to corresponding key events and molecular initiating events in AOPs defined in the AOP‐Wiki (Fay et al. 2018; Pittman et al. 2018; Society for the Advancement of Adverse Outcome Pathways 2018; Corsi et al. 2019). The complete ToxCast‐AOP mapping has been published (Corsi et al. 2019). The subset of ToxCast assays associated with chemicals and chemical mixtures for the present study was associated with AOPs using the ToxCast‐AOP mapping to provide insight into potential adverse outcomes from exposure to the monitored chemicals, and a list of these AOPs is provided in Supplemental Data, Table SI‐7.
Where relevant, gene targets associated with each ToxCast target are identified as part of the assay annotations (US Environmental Protection Agency 2020). Functional annotations for gene targets of interest were obtained from the Database for Annotation, Visualization, and Integrated Discovery (DAVID), Ver 6.8 (Huang et al. 2009a, 2009b). Official gene symbols were entered, and a functional annotation search was performed for each gene. Because our primary aim was to draw inference regarding potential apical effects associated with perturbation of the molecular target or pathway probed in each assay, we focused on select annotation fields considered most informative for this purpose. First, given that ToxCast gene targets are intended to be human‐relevant, we considered Kyoto Encyclopedia of Genes Genomes (KEGG) pathways and Online Mendelian Inheritance in Man (OMIM) disease annotations for Homo sapiens. In cases where KEGG and OMIM annotations were not available, biological process gene ontology terms for fish species were considered. This functional annotation‐based approach was applied to genes associated with ToxCast assays for which chemical mixtures (EARMixture) or individual chemicals (EARchem/SiteChem) yielded EARs >10–3 at 10% or more of monitored sites.
RESULTS AND DISCUSSION
Chemical occurrence
A total of 185 individual chemicals, grouped into 19 classes by their primary use, were analyzed in extracts from the passive samplers deployed in 2010 and 2014 (Supplemental Data, Table SI‐2; Alvarez et al. 2021). These chemicals included legacy (organochlorine) and current‐use pesticides, PAHs, PCBs, fire retardants, pharmaceuticals, and other chemicals related to rural, urban, and industrial waste discharges.
Of the 185 chemicals measured, 143 were detected at least once (Figure 3; Supplemental Data, Table SI‐2). These chemicals were widely distributed, with 111 (60%) present in at least 10% of the sites. Forty‐six chemicals (25%) were detected at >50% of the sites. The most frequently detected class was PAH, with a mean of 17 of the 33 PAHs detected (maximum of 29) at any given site. Chrysene, fluoranthene, phenanthrene, and pyrene were the most prevalent of the PAHs, with mean time‐weighted average concentrations of 10, 20, 6.1, and 19 ng/L, respectively. Total PCBs were detected at 48% of the sites, with a mean concentration of 25 ng/L (range < 0.19–750 ng/L). Organochlorine pesticides were measured with a mean of 7 of 32 chemicals detected (23%) across the sites. Endosulfan‐II, lindane, p,p′‐dichlorodiphenyldichloroethylene (p,p′‐DDE), and pentachloroanisole had some of the highest mean concentrations at 1.1, 0.54, 0.43, and 0.42 ng/L, respectively. Pentachloroanisole was detected at 81% of the sites. Atrazine was detected at 57% of the sites at a mean concentration of 350 ng/L. Organophosphate‐based alternative fire retardants (OPFRs) and PBDEs were widely distributed across the sites, with detection of up to 5 of the 6 OPFRs and 7 of the 9 PBDEs. Tris(1‐chloro‐2‐propyl)phosphate (TCPP) and PBDE‐47 (2,2′,4,4′‐tetrabromodiphenyl ether) were the most widely detected fire retardants, with mean concentrations of 360 and 0.46 ng/L, respectively. A 2015 study observed a similar distribution of PBDEs and OPFRs in whole water samples collected in 5 tributaries of Lake Michigan (Guo et al. 2017). Pharmaceutical compounds were detected with less frequency, with a mean of 8 out of 59 chemicals detected at any given site. Carbamazepine (anticonvulsant, 75%), venlafaxine (antidepressant, 55%), citalopram (antidepressant, 49%), and sulfamethoxazole (antibiotic, 48%) were the most commonly detected pharmaceutical compounds (Supplemental Data, Table SI‐2). A concurrent sampling effort was performed that included collection of discrete samples at the passive sampling sites in 2010 (Baldwin et al. 2016). Commonalities exist between frequency of chemicals detected in passive and discrete samples. In both cases, several PAHs, including fluoranthene, phenanthrene, and pyrene, and the insect repellant N,N‐diethyltoluamide (DEET) were detected in >57% of the samples collected.
![Concentrations and potential for biological effects of organic compounds analyzed in passive samplers deployed at 69 sites within 62 tributaries of the Great Lakes, in 2010 and 2014. (A) Exposure–activity ratios (EARs) using ToxCast activity concentration at cutoff for screening of potential pathway‐based bioactivity from detected chemicals. (B–D) Toxicity quotients computed using effect concentrations from the ECOTOX knowledgebase for effects commonly used in hazard assessment (B, group 1) and other effects (C, group 2) and (D) concentrations of monitored chemicals. Compounds are grouped by chemical class and ordered by largest to smallest median EAR. Boxplots represent only sites where chemicals were detected. Compounds that were not detected are not included. Sites, number of sampling locations with detections of each chemical. Boxes, 25th to 75th percentiles; dark line, median; whiskers, data within 1.5 × the interquartile range (IQR); circles, values outside 1.5 × the IQR; vertical dashed lines indicate EAR threshold value of 10–3 (A) or toxicity quotient of 10–1 (B,C). HHCB = 1,3,4,6,7,8‐hexahydro‐4,6,6,7,8,8‐hexamethylcyclopenta [g]‐2‐benzopyran; AHTN = 7‐acetyl‐1,1,3,4,4,6‐hexamethyltetrahydronaphthalene; PCB = polychlorinated biphenyl; DDT = dichlorodiphenyltrichloroethane; DDE = dichlorodiphenyldichloroethylene; DDD = dichlorodiphenyldichlorethane; PBDE = polybrominated diphenyl ether; OC = organochlorine; PAH = polycyclic aromatic hydrocarbon; WW = wastewater.](https://oup.silverchair-cdn.com/oup/backfile/Content_public/Journal/etc/40/8/10.1002_etc.5118/4/m_etc5118-fig-0003-m.jpeg?Expires=1750238792&Signature=fz1Q~rFQWIZKoWaul0ga7H4q-k66PCHi7Z7w56vMfhXPOKDsvxEu4fnMqlGDZSVP~bOhmZyESoi5kxGqv43L~-90yOzDaKT50NdgW1AtZPQzqpMO-Ka4LLORPalIvdLtsrmhs5IiDt7Ytiyiu9qkE7-rnV0a2LCnISiSDhSnmssN1QYmbPHMsbvHH~-XP4kocRviDvhoZofJNSAd-ZRTvOQl2GICJ4363fmMxewvQDKCJnZA0e-a6EtHn-KTsap~q0x5Dgx-PHsMjOw2vimOVqsWvsJT1Qg6na6iMZFQG~YdyE3oT5UFWH7h938i8QR2c3b06Oa07q~9u8vZ46oYTw__&Key-Pair-Id=APKAIE5G5CRDK6RD3PGA)
Concentrations and potential for biological effects of organic compounds analyzed in passive samplers deployed at 69 sites within 62 tributaries of the Great Lakes, in 2010 and 2014. (A) Exposure–activity ratios (EARs) using ToxCast activity concentration at cutoff for screening of potential pathway‐based bioactivity from detected chemicals. (B–D) Toxicity quotients computed using effect concentrations from the ECOTOX knowledgebase for effects commonly used in hazard assessment (B, group 1) and other effects (C, group 2) and (D) concentrations of monitored chemicals. Compounds are grouped by chemical class and ordered by largest to smallest median EAR. Boxplots represent only sites where chemicals were detected. Compounds that were not detected are not included. Sites, number of sampling locations with detections of each chemical. Boxes, 25th to 75th percentiles; dark line, median; whiskers, data within 1.5 × the interquartile range (IQR); circles, values outside 1.5 × the IQR; vertical dashed lines indicate EAR threshold value of 10–3 (A) or toxicity quotient of 10–1 (B,C). HHCB = 1,3,4,6,7,8‐hexahydro‐4,6,6,7,8,8‐hexamethylcyclopenta [g]‐2‐benzopyran; AHTN = 7‐acetyl‐1,1,3,4,4,6‐hexamethyltetrahydronaphthalene; PCB = polychlorinated biphenyl; DDT = dichlorodiphenyltrichloroethane; DDE = dichlorodiphenyldichloroethylene; DDD = dichlorodiphenyldichlorethane; PBDE = polybrominated diphenyl ether; OC = organochlorine; PAH = polycyclic aromatic hydrocarbon; WW = wastewater.
Previously, POCIS have been used to sample along the Canadian side of Lake Ontario during the summer of 2006 and the summer and fall of 2008 at sites near wastewater‐treatment outfalls (Li et al. 2010; Helm et al. 2012). There were several pharmaceuticals in common between the present study and work by Helm et al. (2012) and Li et al. (2010). A comparison of the estimated water concentrations between the 3 studies revealed similar to lower concentrations reported by Helm et al. and Li et al. compared to the present study (Supplemental Data, Table SI‐2). For example, carbamazepine concentrations were estimated from not detected to 5.4 ng/L and from 0.84 to 16.3 ng/L by Helm et al. (2012) and Li et al. (2010), respectively, compared to the estimated range of 0.12 to 150 ng/L in the present study. This result is expected considering that the Lake Ontario sampling sites were typically in open water, where dilution would be expected to reduce concentrations, in comparison to tributary samples in the present study. Metcalfe et al. (2019) used POCIS in May to June of 2016 to sample for pesticides in 18 watersheds within the Great Lakes basin of Ontario, Canada; and atrazine was detected in 100% of the samples at concentrations >500 ng/L, which is within the range (4.1–4100 ng/L) detected in the present study (Supplemental Data, Table SI‐2).
Complex mixtures of organic contaminants are entering the Great Lakes as evident by an average of 41 chemical detections per site (range 0–89 detections across all sites). For watersheds with >15% urban land cover (10 sites), there was an average of 82 chemicals detected. For watersheds with >40% agricultural land cover, there was an average of 63 chemicals detected (25 sites); and for sites with <15% urban and <40% agricultural land cover (34 sites), there was an average of 20 chemicals detected.
Risk‐based prioritization
Comparison of chemical concentrations detected with various sources of toxicological point of departure data were used to incorporate consideration of biological potency into the prioritization and interpretation of results (Table 1 and Figure 3). The EAR values were computed to consider the chemicals with regard to their established pathway‐based bioactivity (Figure 3). Summations by chemical (EARchem) exceeded 10–3 at 45 sites. Twenty‐nine chemicals had EARchem > 10–3 in at least one sample, and 10 chemicals had EARchem > 10–3 at 10% or more of sites monitored. These 10 chemicals were atrazine, benzo[k]fluoranthene, indeno[1,2,3‐cd]pyrene, p‐tert‐octylphenol, tris(2‐butoxyethyl) phosphate (TBEP), TCPP, tris(1,3‐dichloro‐2‐propyl) phosphate (TDCPP), di(2‐ethylhexyl)phthalate (DEHP), caffeine, and dl‐menthol. It should be noted that an EAR > 10–3 does not necessarily indicate that an adverse effect is likely, only that the chemical has some demonstrated capacity to elicit a pathway‐based biological response at a similar concentration, in vitro.
Chemicals detected in passive samplers from Great Lakes tributaries that were identified to have potential for ecological hazard by exposure–activity ratios from ToxCast endpoints as individual chemicals or as components of chemical mixtures or by toxicity quotients from ECOTOX endpoints as individual chemicals
| Number of sites exceeding | ||||||
| EAR or TQ threshold | ||||||
| Sites | ToxCast | ECOTOX | ||||
| Chemical use class | Chemical name | Monitored | Individual | Mixtures | Group 1 | Group 2 |
| Detergent metabolites | p‐tert‐Octylphenol | 69 | 11 | 7 | 2 | 1 |
| Fire retardant | TBEP | 69 | 18 | 10 | 0 | 0 |
| Fire retardant | TCPP | 69 | 19 | 10 | 0 | 0 |
| Fire retardant | TDCPP | 69 | 19 | 10 | 1 | 1 |
| Fire retardant | Tributyl phosphate | 69 | 4 | 10 | 0 | 0 |
| Flavor/fragrance | Galaxolide (HHCB) | 69 | — | — | 1 | 34 |
| Food Additive/plasticizer | Triethyl citrate | 69 | 0 | 7 | — | — |
| Herbicide | Atrazine | 69 | 27 | 23 | 39 | 39 |
| Insecticide | DEET | 69 | 6 | 18 | 18 | 18 |
| OC pesticides | Chlorpyrifos | 69 | 0 | 0 | 24 | 24 |
| OC pesticides | Dieldrin | 69 | 0 | 0 | 15 | 0 |
| OC pesticides | p,p′‐DDE | 69 | 0 | 0 | 13 | 1 |
| PAHs | Benz[a]anthracene | 69 | 1 | 15 | 0 | — |
| PAHs | Benzo[b]fluoranthene | 69 | 2 | 17 | 0 | 0 |
| PAHs | Benzo[k]fluoranthene | 69 | 19 | 17 | 0 | — |
| PAHs | Indeno[1,2,3‐cd]pyrene | 69 | 16 | 15 | — | — |
| PAHs | Pyrene | 69 | 1 | 1 | 29 | 0 |
| Pharmaceuticals | Caffeine | 69 | 10 | 9 | 0 | 0 |
| Pharmaceuticals | Carbamazepine | 69 | 1 | 1 | 14 | 28 |
| Pharmaceuticals | Tramadol | 36 | — | — | 10 | 10 |
| Pharmaceuticals | Venlafaxine | 69 | — | — | 11 | 11 |
| Plasticizer | DEHP | 69 | 26 | 10 | 38 | 38 |
| WW | dl‐Menthol | 69 | 9 | 9 | 0 | — |
EAR = exposure–activity ratio; TQ = toxicity quotient; OC = organochlorine; PAH = polycyclic aromatic hydrocarbon; TBEP = tris(2‐butoxyethyl) phosphate; TCPP = tris(2‐chloroisopropyl)phosphate; TDCPP = tris(1,3‐dichloro‐2‐propyl)phosphate; HHCB = 1,3,4,6,7,8‐hexahydro‐4,6,6,7,8,8‐hexamethylcyclopenta [g]‐2‐benzopyran; DEET = N,N‐diethyltoluamide; DDE = dichlorodiphenyldichloroethylene; DEHP = di(2‐ethylhexyl)phthalate; WW = wastewater.
Literature‐derived toxicity data for 106 of the detected chemicals were represented in ECOTOX and used in the computation of toxicity quotient values. Eleven chemicals had toxicity quotient >0.1 at 10% or more of the monitored sites. Ten of these were represented by group 1 endpoints with clear regulatory/ecological relevance, whereas 8 were represented by group 2 endpoints, with 7 common among the 2 groups (Table 1 and Figure 3). Chemicals with toxicity quotient >0.1 at 10% or more of the monitored sites were atrazine, DEET, chlorpyrifos, carbamazepine, tramadol, venlafaxine, and DEHP for both groups; dieldrin, p,p′‐DDE, and pyrene for only group 1; and galaxolide for only group 2.
Two of the group 1 and group 2 priority chemicals also had EARchem > 10–3 at 10% or more of sites monitored (atrazine, DEHP), 6 did not have EARchem > 10–3 at 10% or more of sites monitored (pyrene, carbamazepine, chlorpyrifos, DEET, dieldrin, and p,p′‐DDE), and 3 were not represented with ToxCast EAR values (galaxolide, tramadol, and venlafaxine).
The ECOTOX Knowledgebase includes endpoints for testing of chemical formulations as well as the active ingredients. Endpoints from formulation testing were not included in the analysis because only the active ingredient was measured for the present study without other formulation components. In addition, fate and transport properties may vary among formulation components, introducing uncertainty to an assumption of co‐occurrence of all formulation components in stream samples. The inclusion of formulation endpoints in this analysis would have added 3 chemicals with toxicity quotient >0.1 at >10% of sites, including benzo[a]pyrene, p‐tert‐octylphenol, sulfamethoxazole, and total PCBs. Of these chemicals, sulfamethoxazole is the only one that has not historically been widely recognized to be of potential concern to ecological systems. Sulfamethoxazole is a commonly used antibiotic that is typically administered in combination with trimethoprim (Jick and Derby 1995). Manufacture and use of PCBs are banned in the United States, but PCBs remain present in water and sediment within the Great Lakes (Hornbuckle et al. 2006; Kannan et al. 2006). Para‐tert‐octylphenol is a degradation product of octylphenol ethoxylate surfactants that are banned for many applications in Europe. Benzo[a]pyrene is one of a suite of PAHs commonly detected in Great Lakes tributaries at concentrations of concern for aquatic life (Simcik and Offenberg 2006; Baldwin et al. 2016).
Consideration of EAR and toxicity quotient values rather than concentrations alone provided substantial insight into potential biological effects among chemicals within like chemical classes. For example, ranking of chemicals within the pharmaceutical class by concentration would result in a very different order than when ranked by EAR values (e.g., diphenhydramine, albuterol, methadone, and thiabendazole; Figure 3A and B). Likewise, median individual PAH concentrations tended to be within an order of magnitude of other PAHs, as did median individual organochlorine pesticide concentrations; but EAR values varied more than 3 orders of magnitude within these chemical classes.
Cumulative EAR values by chemical category (EARClass) were used to provide an indication of the spatial distribution, relative magnitude, and chemical diversity of potential influence from the combination of chemicals at individual sites (Figure 4; Supplemental Data, Figure SI‐2). Elevated EARClass values were present most commonly from samples collected in tributaries located in the southern portion of Lake Michigan (M6–M23) and the tributaries from southern Lake Huron (Saginaw River, H6) through western Lake Erie (E1–E13). There was a wide diversity in the different chemical classes that contributed EARs and their relative contributions at any given site. For example, detergent metabolites, flavors and fragrances, PAHs, herbicides, fire retardants, insecticides, and pharmaceutical compounds all had substantial contributions at multiple sites; but the relative contribution among chemical classes varied considerably among sites (Figure 4). Positive correlations were present between the number of sites with EARClass > 10–3 and major land cover categories (as percentage of watershed) for 7 classes of contaminants (Figure 4, embedded table). All 7 chemical classes were correlated with the percentage of urban land cover in the watershed. Herbicides, fire retardants, and pharmaceutical compounds had additional correlations with agricultural land cover.
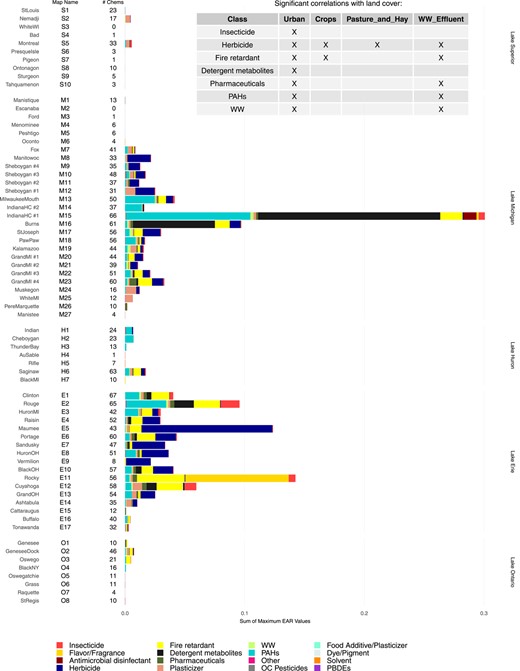
Maximum exposure–activity ratios (EARs) by chemical class computed from passive sampler chemistry data from 69 Great Lakes tributary sites collected in 2010 and 2014 for chemicals included in the ToxCast database. An “X” in the embedded table indicates major land cover within the watersheds that were significantly correlated with exceedance of an EAR threshold of 10–3 for chemical classes. Chemical classes not represented in the table did not have significant correlations. “Map Name” shows reference locations included on the map in Figure 1; “# Chems” shows number of chemicals with computed EAR values.
The EARClass values for some chemical classes were primarily influenced by contributions from only one individual chemical, and multiple chemicals contributed for other chemical classes (Supplemental Data, Figure SI‐2A–D). For example, a single compound was responsible for the majority of EARClass contributions in chemical classes, including herbicides, detergent metabolites, pharmaceutical compounds, plasticizers, and wastewater compounds (atrazine, 4‐tert‐octylphenol, carbamazepine, and DEHP, respectively). Multiple chemicals in a given chemical class contributed substantially to EARs for other sites, including insecticides, fire retardants, and PAHs (Supplemental Data, Figure SI‐2A–D).
Of the 10 individual chemicals that exceeded an EAR threshold of 10–3 at 10% or more of the sites (Table 1), the EAR threshold exceedance was found to be significantly correlated with urban land cover and with distance‐weighted wastewater effluent as a fraction of annual streamflow. Significant correlations with land used for crops were also present for atrazine, DEHP, TDCPP, TBEP, and TCPP; and an additional significant correlation with land used for pasture/hay was present for atrazine and DEHP (Figure 4). Although a correlation between atrazine and land used for crops is a logical result, it is not as obvious why DEHP, TDCPP, TBEP, and TCPP are correlated to land used for crops. Possible sources of these contaminants could be treated wastewater or sludge applications as fertilizer (Pedersen et al. 2005; Lamastra et al. 2018) or, in the case of DEHP, plastic films used in agricultural applications (Zhao et al. 2017). Also, DEHP is susceptible to atmospheric transport in both gaseous and particulate‐bound forms (Xie et al. 2007; Zhen et al. 2019). Zeng et al. (2008) reported elevated concentrations of phthalates in agricultural soils outside urban centers, with concentrations decreasing with distance from urban centers.
Relationships of chemical and chemical class concentrations in water samples with land cover attributes are not uncommon given that the location of many sources is typically associated with specific land uses. These types of relationships have been demonstrated in previous studies of Great Lakes tributaries where regression relationships were developed for contaminants such as PAHs, flavors/fragrances, dyes/pigments, and pharmaceutical compounds using different types of urban land use prevalence such as impervious surface, wastewater effluent, population density, or general urban land cover as predictors (Baldwin et al. 2016; Kiesling et al. 2019). Regression relationships for herbicides commonly had the strongest relationships with agricultural land use attributes. In addition, measures of ecological integrity of streams (e.g., fish and macroinvertebrate indices) have been related to watershed land cover (Moore and Palmer 2005; Scott 2006; Clapcott et al. 2012). The present study attempts to provide a link between these 2 types of studies by considering both relative biological potency of detected contaminants and subsequent relation to land cover characteristics.
Biological outcomes of concern
Chemical– and chemical mixture–ToxCast assay pairs that contributed >1% to the total EARmixture at sites that exceeded the EAR threshold of 10–3 were identified to gain insights into the types of biological effects that may be of concern at prioritized locations (Table 2). Only one chemical was included as part of a mixture that was not included as an individual chemical (triethyl citrate; Table 1). Where available, ToxCast assays were mapped to AOPs that would be relevant for chemicals acting via the pathway or mechanism considered in the assay. Among the 14 prioritized assay responses, AOPs were available for 8 (Table 2). Pathway or disease annotations were available for 10 of the relevant gene targets (Table 2). Overall, considering AOPs and the 3 types of functional annotations, at least some indication of the biological context/relevance of the assay target was obtained for all 14 prioritized assay responses. Sites where these mixtures occur were primarily located in the southern half of Lake Michigan and from Lake St. Clair to western Lake Erie (Supplemental Data, Figure SI‐3). The predominant land cover category at these sites was urban or agriculture or a combination of the 2.
Adverse outcome pathways (AOPs) and functional gene annotations relevant to ToxCast assays associated with chemical mixtures and individual chemicals with exposure activity ratios >10–3 at 10% or more of monitored sitesa
| Gene: assay: chemical/mixture | AOPs: overview | Functional annotationsb | No. sites |
| AR: ACEA_AR_antagonist_80hr: dl‐Menthol | Five AOPs under developmentc; developmental and reproductive toxicity; mammals | [1: Oocyte meiosis, pathways in cancer, prostate cancer]; [2: prostate cancer, susceptibility to; androgen insensitivity; hypospadias 1, X‐linked; androgen insensitivity, partial, with or without breast cancer; spinal and bulbar muscular atrophy of Kennedy]; [3: Danio rerio: transcription, DNA‐templated; regulation of transcription, DNA‐templated; steroid hormone–mediated signaling pathway]. | 9 |
| AHR: ATG_Ahr_CIS_up: Benz[a]anthracene, indeno[1,2,3‐cd] pyrene | Three OECD‐endorsed AOPsd; 3 AOPs open for citatione; 2 AOPs under developmentc; early–life stage mortality; hepatic steatosis; liver tumors; uroporphyria; developmental toxicity | [1: Response to xenobiotic stimulus]; [3: Oryzias latipes: transcription, DNA‐templated; regulation of transcription, DNA‐templated] | 17 |
| AHR: TOX21_AhR_LUC_Agonist: Benzo[b]fluoranthene, benzo[k] fluoranthene | Three OECD‐endorsed AOPsd; 3 AOPs open for citatione; 2 AOPs under developmentc; early–life stage mortality; hepatic steatosis; liver tumors; uroporphyria; developmental toxicity | [1: Response to xenobiotic stimulus]; [3: Oryzias latipes: transcription, DNA‐templated; regulation of transcription, DNA‐templated] | 17 |
| CYP1A2: CLD_CYP1A2_24hr: Atrazine | Two OECD‐endorsed AOPsf; one AOP open for citationg; early–life stage mortality; liver tumors; uroporphyria | [1: Steroid hormone biosynthesis, caffeine metabolism, tryptophan metabolism, linoleic acid metabolism, retinol metabolism, metabolism of xenobiotics by cytochrome P450, drug metabolism by cytochrome P450, metabolic pathways, chemical carcinogenesis] | 11 |
| CYP19A1: NVS_ADME_hCYP19A1: DEHP | One OECD‐endorsed AOPh; one AOP open for citationi; 2 AOPs under developmentc; impaired fertility, reproductive dysfunction, male‐biased sexual differentiation | [1: Steroid hormone biosynthesis, metabolic pathways, ovarian steroidogenesis]; [2: aromatase excess syndrome, aromatase deficiency] | 10 |
| CYP2B6: CLD_CYP2B6_24hr: Atrazine; CLD_CYP2B6_6hr: Atrazine, DEET | Not applicable | [1: Arachidonic acid metabolism, retinol metabolism, metabolism of xenobiotics by cytochrome P450, drug metabolism by cytochrome P450, metabolic pathways]; [2: efavirenz central nervous system toxicity, susceptibility to and poor metabolism of] | 10; 18 |
| ESR1: ACEA_ER_80hr: TBEP, p‐tert‐octylphenol, triethyl citrate | Six AOPs under developmentc, j; developmental and reproductive toxicity; increased cancer risk | [1: Estrogen signaling pathway, prolactin signaling pathway, thyroid hormone signaling pathway, endocrine and other factor–regulated calcium reabsorption, proteoglycans in cancer]; [2: breast cancer; migraine, susceptibility to; myocardial infarction, susceptibility to; estrogen resistance; atherosclerosis, susceptibility to; HDL response to hormone replacement, augmented]; [3: Danio rerio: transcription, DNA‐templated; regulation of transcription, DNA‐templated; response to xenobiotic stimulus; response to estradiol; steroid hormone–mediated signaling pathway; response to estrogen; posterior lateral line neuromast primordium migration; cellular response to estrogen stimulus] | 7 |
| ESR1, ESR2: CEETOX_H295R_ESTRONE_up: Atrazine | Not applicable | [1: Estrogen signaling pathway, prolactin signaling pathway, thyroid hormone signaling pathway, endocrine and other factor–regulated calcium reabsorption, proteoglycans in cancer]; [2: breast cancer; migraine, susceptibility to; myocardial infarction, susceptibility to; estrogen resistance; atherosclerosis, susceptibility to; HDL response to hormone replacement, augmented]; [3: Danio rerio: transcription, DNA‐templated; regulation of transcription, DNA‐templated; response to xenobiotic stimulus; response to estradiol; steroid hormone–mediated signaling pathway; response to estrogen; posterior lateral line neuromast primordium migration; cellular response to estrogen stimulus] | 16 |
| NR1I2: ATG_PXR_TRANS_up: Atrazine, TCPP, TDCPP; ATG_PXRE_CIS_up: Atrazine, DEHP, TBEP, TCPP TDCPP | One AOPj; hepatic steatosis | [3: Danio rerio: transcription, DNA‐templated; regulation of transcription, DNA‐templated; transcription from RNA polymerase II promoter; response to toxic substance; steroid hormone–mediated signaling pathway] | 7; 8 |
| PDE4A: NVS_ENZ_hPDE4A1: Atrazine | Not applicable | [1: Purine metabolism, cAMP signaling pathway, morphine addiction]; [3: Danio rerio: signal transduction] | 23 |
| SOX1: ATG_Sox_CIS_up: Caffeine | Not applicable | [3: Oryzias latipes: regulation of transcription, DNA‐templated; nervous system development; positive regulation of sequence‐specific DNA binding transcription factor activity] | 9 |
| TSPO: NVS_MP_hPBR: DEHP, TBEP, tributyl phosphate, TCPP, TDCPP | Not applicable | [1: Neuroactive ligand–receptor interaction, HTLV‐I infection]; [3: Danio rerio: primitive erythrocyte differentiation] | 10 |
ToxCast assay name; AOP overview provides a listing of relevant AOPs from the AOP‐Wiki and an overview of associated apical outcomes; official gene symbol for gene target associated with ToxCast assays; functional gene annotations from DAVID 6.8.
Annotation sources [1: Kyoto Encyclopedia of Genes and Genomes pathways (Homo sapiens)]; [2: Online Mendelian Inheritance in Man Disease (Homo sapiens)]; [3: GO Biological Process for a representative fish species]. If not listed for a given annotation source, no annotations were available for that source.
https://aopwiki.org; https://aopwiki.org/aops/167; https://aopwiki.org/aops/146; https://aopwiki.org/aops/200; https://aopwiki.org/aops/29.
DEHP = di(2‐ethylhexyl)phthalate; DEET = N,N‐diethyltoluamide; TBEP = tris(2‐butoxyethyl) phosphate; TCPP = tris(2‐chloroisopropyl)phosphate; TDCPP = tris(1,3‐dichloro‐2‐propyl)phosphate; OECD = Organisation for Economic Co‐operation and Development; HTLV‐I human T‐cell lymphotropic virus type 1.
Several of the prioritized assay responses relate to endocrine disruption including antagonism of the androgen receptor (ACEA_AR_antagonist_80hr); agonism of the estrogen receptor (ACEA_ER_80hr); inhibition of cyp19a1 (aromatase; NVS_ENZ_hPDE19A1), a key enzyme in the steroid biosynthesis pathway; and increased in vitro production of estrone (CEETOX_H295R_ESTRONE_up; Table 2). Multiple AOPs outlining plausible connections between these activities and potential to cause reproductive and developmental toxicity in vertebrates have been established. Although some of the AOPs are in early stages of development and lack a full assembly of supporting evidence, concern over chemicals that may interact with estrogen signaling, androgen signaling, and/or steroid biosynthesis is well established, as reflected by chemical safety legislation that provides special consideration to chemicals that exhibit these types of activities (e.g., US Food Quality Protection Act 1996; European 7th Environmental Action Program; Plant Protection Products Regulation [EC 1107/2009]; Biocidal Products Legislation [EU 528/2012]; Registration, Evaluation, Authorisation and Chemicals [EC 1907/2006]; Canada Chemicals Management Plan). The majority of these AOPs are focused on human health outcomes; but based on key events included in several of these AOPs, measurements of AR‐dependent (e.g., spiggin; Jolly et al. 2006; Pottinger et al. 2013) and ER‐dependent (e.g., vitellogenin) gene expression, steroid hormone concentrations, and/or circulating vitellogenin protein concentrations could be useful for determining if activities associated with these AOPs are being observed at the study sites.
A second group of prioritized assay responses relates to responses to xenobiotic stimulus and xenobiotic metabolism. Both the aryl hydrocarbon receptor (AhR; ATG_Ahr_CIS_up; TOX21_AhR_LUC_Agonist) and pregnane X receptor (PXR; ATG_PXR_TRANS_up; ATG_PXRE_CIS_up) are transcription factors that bind a wide range of organic contaminants and activate transcription of phase 1 metabolizing enzymes (Waxman 1999; Xu et al. 2005). Cytochrome P450s 1 A (CLD_CYP1A2_24hr) and 2B6 (CLD_CYP2B6_24hr; CLD_CYP2B6_6hr) are 2 examples of inducible phase 1 enzymes. Thus, not surprisingly, a robust response of the xenobiotic metabolism machinery to exposures to several of the chemicals detected via passive sampling can be expected. Although in principle this can be viewed as an adaptive response that aids removal of contaminants from the exposed organisms, persistent activation of such systems can lead to a range of adverse outcomes. There are multiple well‐developed AOPs linking AhR activation to adverse effects like early–life stage mortality in fish, developmental toxicity, and a variety of adverse effects on the liver including fat accumulation and/or tumor formation (Table 2). Activation of the AhR is known to cause induction of CYP1A isoforms; consequently, many of the AOPs established for AhR activation are also relevant to CYP1A activity (Table 2). Based on key events described for these AOPs, increased expression of cyclooxygenase 2, decreased expression of vascular endothelial growth factor in larval fish, as well as liver histopathology are potential biomarkers of effect that could be used to probe whether AhR active compounds are likely eliciting adverse effects in field‐exposed organisms. In the case of PXR activation, the links to adversity are not as well established. Although there is one AOP suggesting a link to hepatic steatosis, the weight of evidence supporting this proposed AOP has not yet been provided, and gene annotations provided little additional insight beyond the known role of PXR as a transcription factor involved in xenobiotic response (Table 2). No AOPs were available for CYP2B6, but KEGG pathway annotations indicate a role in arachidonic acid and retinol metabolism, in addition to biotransformation of steroids and xenobiotics (Table 2). Targeted metabolomics focused on selected arachidonic acid and retinoic acid derivatives may provide additional insight into whether potential CYP2B6 induction associated with contaminants like atrazine and DEET may have some subtle physiological impacts on exposed fish or wildlife. However, even if detected, the significance would be difficult to interpret without additional experimentation.
For the remainder of the prioritized assay responses, clear links to adverse effects have not been proposed or documented in the AOP‐Wiki (Table 2). In the case of PDE4A (NVS_ENZ_hPDE4A1), annotations indicate little more than a potential role in cAMP‐mediated signal transduction. Likewise, annotations for the translocator protein provide little biological insight beyond potential roles in neuronal signaling or differentiation of red blood cells. In the case of Sox1 (ATG_Sox_CIS_up), gene target annotations point to a role in transcriptional regulation in association with development of the nervous system. Consequently, something like a fish embryo‐larval test may be a fairly rapid and inexpensive way to determine whether prioritized chemicals may cause adverse effects on neural development. Indeed, Rodriguez et al. (2014) demonstrated that caffeine exposure can cause a range of neurobehavioral effects in zebrafish embryos and that longer exposures can cause irreversible malformations and or mortality. However, it should be noted that these effects were documented at concentrations ≥5 mM (≈970 mg/L), more than 6 orders of magnitude greater than those detected in Great Lakes tributaries. This is just one example to illustrate that although EARs provide an effective means to consider both relative ambient concentrations and relative biological potency when prioritizing contaminants of concern, neither an EAR >10–3 nor the linkage of an assay response with an AOP should be considered definitive evidence for adverse effects. In essence, AOPs explain how a particular biological interaction/activity can cause an adverse effect. For most AOPs, we do not have sufficient quantitative understanding to define the exact duration and magnitude of activity at a molecular initiating event or subsequent key events that are required to drive the pathway to its adverse outcome. Consequently, linkage of an EAR‐prioritized assay response with an AOP or with a specific biological target or pathway via functional annotations is meant to guide additional monitoring and experimentation that can confirm or reject the potential for effects in the field. It is not, in and of itself, evidence that adverse effects are occurring or necessarily will occur under environmentally realistic exposure scenarios.
Biological relevance of passive sampler data
Passive samplers have been widely used as surrogates for determining the exposure of contaminants to organisms. Chemicals detected in passive samplers were accumulated from the dissolved phase (not bound to particulate or suspended matter) in the water column into the sampler via diffusion and partitioning processes analogous to the uptake of chemicals by aquatic organisms (Huckins et al. 2006). Similar uptake between SPMDs and organisms has been demonstrated by comparing PCB congeners between SPMDs and brown trout (Salmo trutta) as well as chlorinated pesticides in SPMDs and mussels (Meadows et al. 1998; Sabaliūas et al. 1998). Comparisons between organisms and POCIS are not as indicative of actual exposure because many of the chemicals that sorb to POCIS material may not bioaccumulate in organisms as a result of their low log octanol–water partition coefficient values.
Determining exposure from passive samplers has been accomplished through the identification and quantitation of sampled chemicals and the screening of these chemicals with in vitro and in vivo bioassays. The combination of passive samplers and bioassays potentially provides information on the relative toxicological significance of exposure to chemicals present in the environment (Huckins et al. 2006). Typically, this measure of exposure is accomplished by directly screening the extract from a passive sampler by a bioassay test. For the present study, a different approach was taken where, instead of testing an extract by one bioassay at a time, measured chemical concentrations were compared to effect concentrations in ToxCast. This approach allowed for the estimation of potential biological effects across a broader range of endpoints than was practical from in vitro or in vivo testing methods.
Additional complexity arises when considering the biological effects of chemical mixtures. In vivo and in vitro analyses to examine biological activities resulting from mixtures are becoming more common, but there is much to learn about the effects of mixtures (Schoenfuss et al. 2016). When chemical monitoring data are available, established water quality benchmarks are useful for evaluation of single chemicals; but predicting the cumulative biological effects of mixtures using this information can be problematic. Methods for combining estimated effects from multiple chemicals depend on how the chemicals interact with biological systems and the mode of action for each individual chemical (Altenburger et al. 2015). Because many HTS techniques used in ToxCast focus on specific biological signaling pathways, cumulative bioactivity from co‐occurring chemicals has been estimated using a summation of effects from individual chemicals that act on the same pathway (Blackwell et al. 2017, 2019; Corsi et al. 2019). Combining analytical results from passive samplers in the present study with EAR analysis techniques allowed an estimation of mixture effects by ToxCast assay. Mapping of the associated gene targets from ToxCast assays to AOPs and/or functional annotations associated with ToxCast gene targets (Supplemental Data, Table SI‐8) extended this information to help infer plausible biological effects from exposure to the detected mixtures and suggest assays and endpoints that might be useful for effects‐based monitoring of mixture impacts.
Despite the wealth of information gathered from the combination of passive samplers, ToxCast, and the ECOTOX Knowledgebase, this approach does have limitations. Unlike a discrete sample in which all chemicals present in the water are collected, passive samplers sample a specific range of chemicals determined by their physicochemical properties. This was partially addressed by using the SPMD and POCIS together, each sampling a different range of chemical properties and hydrophobicities. Another limitation can be the ability to estimate the time‐weighted average water concentration of sampled chemicals. For the SPMD, well‐established models exist to conduct time‐weighted average water concentration estimates, whereas for the POCIS, this estimation is limited to those chemicals for which there have been experimentally derived sampling rates (Alvarez 2010). Another limitation with the POCIS is the lack of a universal PRC approach to account for site‐specific environmental conditions which could affect chemical sampling. However, differences in flow effects between sites and experimentally derived sampling rates are expected to be minimized by baffling effects of the protective deployment canisters which house the POCIS. A review by Harman et al. (2012) reported several studies which showed that POCIS sampling rates varied by less than a factor of 2 over a range of flow regimes for many pharmaceuticals and other chemicals of emerging concern. ToxCast has the limitation that not all chemicals analyzed are represented in its database. ToxCast is also dependent on the quality of data generated from in vitro assays. Chemicals that are highly hydrophobic, such as many sampled by the SPMD, are known to bioaccumulate in organisms and can be highly toxic. However, their hydrophobic nature may cause these chemicals to partition onto the plastic surfaces of multiwell test plates used in HTS assays instead of being solubilized by hydrophilic assay media, resulting in an underestimation of the potential toxicity of a chemical at a certain concentration (Gellert and Stommel 1999; Armitage et al. 2014). Models to address issues related to chemical partitioning between assay cells, medium constituents, and test systems have been developed (Fischer et al. 2017); but such corrections are not widely used or implemented into the EAR approach. Regardless of these limitations, the combination of passive sampling and ToxCast in the present study provided a chemical prioritization strategy that considers both environmental concentration and toxicological potency.
CONCLUSIONS
Evaluation techniques to prioritize chemicals, sites, and biological effects, including the use of the ToxCast HTS database and the ECOTOX Knowledgebase, provided the means for screening‐level assessments. Of the 185 chemicals monitored during the present study, 23 chemicals in 8 chemical use classes were identified as top candidates for further investigation through consideration of relative environmental occurrence/concentrations and their relative biological potency (Table 2). Atrazine, several PAHs, organophosphorus flame retardants, and DEHP all exceeded EAR and toxicity quotient thresholds at a large proportion of the study sites. Across the study sites, tributaries of Lakes Michigan and Erie had by far the highest numbers of chemicals detected, numbers of chemical classes represented, and calculated EARs for the chemical classes. Many of these tributaries were heavily impacted by chemicals related to urban and industrial wastewaters. The use of passive samplers to provide long‐term (approximately 1 mo) time‐weighted mean concentrations to simulate biological uptake provided relevant monitoring results for these assessments. Mapping ToxCast assay gene targets to AOPs and functional annotations provided additional insight into potential for ecological effects and importantly aided the identification of endpoints that can be useful for hypothesis‐driven hazard verification or monitoring. By incorporating the data from ToxCast as well as literature‐derived toxicity data from the ECOTOX knowledgebase, it is feasible to expand a risk‐based prioritization beyond the chemicals for which traditional water quality benchmarks are available. Overall, results can be used to inform resource managers about specific chemicals that may be of concern in monitored watersheds and help focus resources on compounds with the greatest potential to be problematic, based on available data. Where hazards associated with specific sites or chemicals are confirmed, similar pathway‐based biological effects can be used to evaluate the success of management strategies in reducing or eliminating the impacts.
Supplemental Data
The Supplemental Data are available on the Wiley Online Library at https://doi.org/10.1002/etc.5118.
Acknowledgment
The authors gratefully acknowledge the many individuals involved in sample collection: B. Hayhurst, B. Fisher, S. Kula, C. Huitger, C. Silcox, E. Dobrowolski, M. Hardebeck, J. Duris, A. Totten, R. Jodoin, E. Dantoin, D. Housner, J. Larson, and N. Viñas. Efforts for the construction, processing, and analysis of the passive samplers by S. Perkins and V. Schroeder are greatly appreciated. Assistance with compiling land cover data and the site map by M. Nott, L. Lenoch, and M. Pronscinske were also greatly appreciated. The authors thank those involved in programmatic support, including E. Smith and E. Murphy from the US Environmental Protection Agency and K. Richards, D. Sullivan, and C. Peters from the US Geological Survey. Support for the present study was provided by the Great Lakes Restoration Initiative through the US Environmental Protection Agency's Great Lakes National Program Office under agreement number DW‐014‐92453901.
Disclaimer
Any use of trade, product, or firm names is for descriptive purposes only and does not imply endorsement by the US government. The paper has been reviewed and approved for publication in accordance with US Geological Survey and US Environmental Protection Agency requirements. The findings and conclusions in this article are those of the author(s) and do not necessarily represent the views of the US Environmental Protection Agency.
Author Contributions Statement
D. Alvarez, S. Corsi, L. De Cicco, and A. Baldwin conceived and designed the field study; D. Alvarez conducted the chemical analyses; S. Corsi and L. De Cicco performed the toxicity database assessments; D. Villeneuve provided expert technical assistance and interpretation of the toxicity assessments; D. Alvarez, S. Corsi, L. De Ciccco, and D. Villeneuve contributed to writing different parts of the manuscript; and A. Baldwin provided review.
Data Availability Statement
Full chemical data for the present study can be assessed in a US Geological Survey Data Release (Alvarez et al. 2021). Data, associated metadata, and calculation tools are also available from the corresponding author ([email protected]).
REFERENCES
