


Abstract
Field studies to determine the effects of chemicals on earthworm communities are generally conducted according to International Organization for Standardization standard 11268‐3 (and later comments). However, statistical test procedures suggested in the guideline are frequently criticized, mainly for 2 reasons: 1) Earthworm abundances are count data and often do not fulfill requirements for multiple t tests (normal distribution and homogeneity of variance), and 2) the resulting toxicity metrics of multiple testing procedures (no/lowest‐observed‐effect concentrations [NOEC/LOEC]) fail to adequately detect the actual level of effects. Recently, a new method to overcome these shortcomings was presented by the introduction of the closure principle computational approach test (CPCAT). We applied this statistical method to assess chemical effects on abundance in a large dataset of 26 earthworm field studies (with up to 3 test chemical application rates) and an additional extended study with 6 application rates. A comparative analysis was provided considering results of well‐established multiple testing approaches (Dunnett's test) with particular consideration of the degree of overdispersion found in these data. It was shown that the CPCAT detects substantially more effects in earthworm field tests as statistically significant than standard t test approaches. This lowered the LOEC/NOEC for many chemical treatments to control comparisons. As a consequence, the statistically detected NOECs/LOECs were often set at lower percentage deviations between control and chemical treatment. This is the first time the performance of the CPCAT has been assessed within a comprehensive analysis of earthworm field study data. Environ Toxicol Chem 2021;40:1750–1760. © 2021 The Authors. Environmental Toxicology and Chemistry published by Wiley Periodicals LLC on behalf of SETAC.
INTRODUCTION
The closure principle computational approach test (CPCAT) was recently introduced by Lehmann et al. (2016) for multiple testing (many treatments against one control) of reproduction data in ecotoxicology. This method represents an alternative to the conventional test procedures for the detection of no/lowest‐observed‐effect concentrations (NOECs and LOECs) from the family of hypothesis testing procedures.
The standardized approaches for the statistical assessment of reproduction test data are comparable to the evaluation of abundance data of test organisms sampled in field tests. Due to the data characteristics of the aforementioned tests, several guidelines recommend using the Dunnett (1955) test or the Williams (1972) test as “the most appropriate statistical method for dose response tests” (Kula et al. 2006) for multiple comparisons against one control (Organisation for Economic Co‐Operation and Development 2006, 2012, 2016a, 2016b, 2016c; International Organization for Standardization 2014). Furthermore, the guidelines suggest, for data obtained through these 2 tests, that only if the statistical pretests on variance homogeneity and normal distribution indicate that these criteria are not met for the data (or the transformed data, for example, logarithmic or square‐root), then nonparametric test procedures (Mann–Whitney U test with Bonferroni correction, Jonckheere‐Terpstra etc.) should be performed. However, this can often result in effect thresholds only being detected at larger percentage differences between control and treatments (Hodges and Lehmann 1956; Tanizaki 1997). Such a reduction in statistical performance is to be especially expected with small sample sizes of <7 objects/tested group (Hamada 2018).
However, as Lehmann et al. (2016) have already stated, reproduction data from controlled laboratory studies (raw data as well as quantal data calculated as fractions of integer numbers [0,∞]) are not continuous and generally not assumed to be normally distributed, which is a prerequisite to perform multiple t tests like Dunnett's or Williams'. Data on reproduction as well as abundance data obtained in field tests are count data, which can be described by a Poisson distribution (Chapman et al. 1996; Delignette‐Muller et al. 2014; Szoecs and Schaefer 2015). There are several reasons why theory limits the use of statistics based on normal distribution and variance homogeneity (like Dunnett's or Williams' tests) in the case of these count data: 1) Field test abundance data are discrete, whereas the normal distribution is continuous, and approximating a discrete distribution with a continuous distribution can lead to inaccuracies and inferred results that are not in accordance with the data (Wallis 2013); 2) The lower limit of sampled individuals in the field is zero, whereas the normal distribution is an asymptotic distribution in both directions. The proximity to zero and magnitude of the (standard) error for small, positive integers of sampled individuals could lead to wrong estimates such as negative lower confidence limits; and 3) The assumption of homogeneity of variance is unlikely to be met with count data, especially if treatment sizes are small and/or counts are low. Moreover, the decreasing mean values with increasing concentrations (the normal case for a toxicological effect, especially in the case of acute toxic effects) inevitably result in decreasing variances, and variance homogeneity must be rejected (Figure 1). In addition to Dunnett's and Williams' tests, it should be noted that the nonparametric alternatives of the Jonckheere–Terpstra (Jonckheere 1954) and Kruskal–Wallis tests (Kruskal and Wallis 1952) also suffer from such inhomogeneous variances (Hollander and Wolfe 1999).
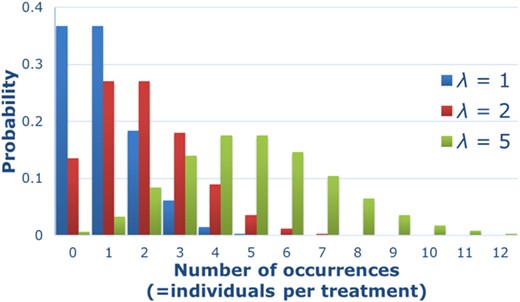
Illustration of the Poisson probability distribution (λ = 1; λ = 2; λ = 5), also referred to as the “distribution for rare events.” The variable λ of the Poisson distribution is a positive, real number that is equal to the expected number of occurrences (=individuals/treatment) and also to its variance.
Although one can test experimental count data regarding their normal distribution and variance homogeneity, these pretests always favor the null hypothesis (normal distribution and variance homogeneity of data), which is rewarded by small sample sizes and strongly enhances the probability of making a type II error. Subsequent application of Dunnett's or Williams' test is only an approximation of the true Poisson distribution (based on the central limit theorem; Dudley 2014) and gives only approximate statistics valid under the appropriate assumptions (expected value EV(X) ≥ 5), which is often not met in field studies, especially at higher test chemical application rates (Gupta and Guttman 2014). Transformation of raw data toward normal distribution or variance homogeneity also results in only an approximation of the theoretical Poisson distribution.
Due to these drawbacks, Lehmann et al. (2016) pointed out that NOECs and LOECs obtained from t test statistics must always be questioned, and thus they recommended the CPCAT as a nonapproximative Poisson‐based test to detect differences between treatment(s) and a control. This test does not require any assumptions about normality or homoscedasticity, as do the t‐based Dunnett's or Williams' tests, even if marked heterogeneity may reduce the effectiveness of the CAT procedure (Chang et al. 2010). Due to the use of the closure principle of hypothesis testing (see Bretz 2011 for detailed information), the CPCAT also avoids the issue of alpha‐inflation by testing sequences of intersecting hypotheses iteratively (Figure 2; e.g., H01: µ0 = µ1 is further subdivided into H012 [µ0 = µ1 = µ2], H013 [µ0 = µ1 = µ3], and H0123 [µ0 = µ1 = µ2 = µ3] for 3 treatments vs control).
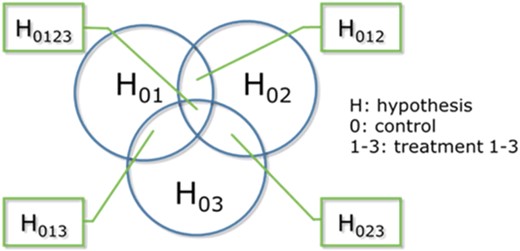
Closure principle of hypotheses testing in the closure principle computational approach test (adapted from Lehmann et al. 2018), that is, testing of H01: µ0 = µ1 is further subdivided into H012 (µ0 = µ1 = µ2), H013 (µ0 = µ1 = µ3), and H0123 (µ0 = µ1 = µ2 = µ3) for 3 treatments versus control.
For this reason, we aimed to investigate whether the application of the CPCAT to earthworm field test data would lead to changes in the detectability of significant effects compared with conventional multiple t tests (based on calculated p values). The applicability and principal improvement of the statistical test power when using the CPCAT instead of t‐distributed statistics have already been investigated in a simulation study (Lehmann et al. 2018). However, an evaluation of the CPCAT for empirical count data and their variance with a comprehensive set of field data has not yet been performed. In the present study, we analyzed abundance data generated from earthworm field tests conducted, for example, for the registration of plant protection products. The analysis includes a direct comparison between the results of the CPCAT and Dunnett's test as a representative of the multiple t test family. Dunnett's test was chosen from the set of standardized tests to generate a consistent comparison for all considered data sets. The test is explicitly suggested in the technical recommendations for the earthworm field test guideline (Kula et al. 2006). According to an analysis of the test reports, Dunnett's test is commonly used in practice for these data, it is generally more powerful than the alternative nonparametric tests, and the pretests for normal distribution and variance homogeneity often favor the null hyothesis due to small sample sizes.
Lehmann et al. (2018) assumed that the statistical power of the CPCAT would be reduced in case of highly dispersed data. For count and quantal data, the term “overdispersion” is used (Cameron and Trivedi 2013; Green et al. 2018), defined as µ < σ2, that is, the variance is higher than the mean. However, it is known that even with multiple t test procedures, reductions in statistical power are to be expected when data are highly dispersed (Anderson and Walsh 2013; Brock et al. 2015).
The results of the CPCAT and Dunnett's test procedures applied to data from earthworm field tests were therefore analyzed with special regard to the variance of earthworm abundances within the specific test settings. The impact of variability is particularly important for tests under field conditions, including considerations of heterogeneous conditions and distributions of communities in natural soils (Ekschmitt 1998) using the standard number of 4 replicates according to the International Organization of Standardization (ISO; 2014) earthworm field test standard (ISO 11268‐3). The strengths and limitations regarding the use of the CPCAT for count data from ecotoxicological field tests are presented.
MATERIALS AND METHODS
Earthworm field studies: Test design and toxicity measures
Earthworms play a crucial role in many soil‐related processes, functions, and ecosystem services (Keith and Robinson 2012; Van Groenigen et al. 2014; European Food Safety Authority Panel on Plant Protection Products and their Residues 2017). The field testing of effects on earthworm fauna for environmental risk assessment is considered an important element for registration procedures of plant protection products in the European Union (European Commission 2013a, 2013b) in case potential risks from laboratory studies on earthworms have been indicated. The earthworm field test was originally standardized by the German Federal Biological Institute (Biologische Bundesanstalt 1994) and was subsequently issued as an ISO standard in 1999. The latter was updated several times (last in 2014) without changing the basic, common approach (ISO 11268‐3; International Organization for Standardization 2014).
The field studies usually include a nontreated negative control, a toxic reference control (=positive), and 1 to 3 test chemical application rates (=treatments). Field test reports include information about earthworm species, numbers of individuals, and biomass collected from sampling plots treated with either the test chemical or the reference substance (the fungicidal active substances [a.s.] carbendazim or benomyl) in a randomized arrangement (4 replicates/treatment) and compared with those collected from the negative control plots. The sampling dates are usually set shortly before application (“presampling”), 1 to 3 mo (“first sampling”), 4 to 6 mo (“second sampling”), and approximately 12 mo (“third sampling”) after application of the test chemical. Field studies typically start in spring (late March–May), a period of high activity for most earthworm populations. The assessment of effects in a test includes the evaluation of total abundance and biomass at the species level and grouped for life stages. Juvenile earthworms are mostly summarized and evaluated at the genus level (morphological groups: tanylobous and epilobous). In addition, the ecological groups of endogeic, epigeic, and anecic earthworms are differentiated.
The statistical calculation to determine significant effects of the test chemical and reference substance treatments compared with the negative control for all sampling time points and tested species or morphological/ecological earthworm groups is carried out with current standard guideline test approaches (with α = 5% significance level). In addition to the abundance data of single earthworm species and earthworm groups, the guidelines also consider biomass as a measurement endpoint. However, biomass is a metric and not a count datum, which makes the Poisson distribution of the CPCAT inadequate for these data characteristics. For this reason, the analysis of biomass from field tests is not considered in the present study.
Data source and structure
Data used in the comparative analysis originated from 26 earthworm field studies conducted in Germany and the United Kingdom in the years 1998 to 2014, and submitted to the German Federal Environment Agency for regulatory purposes as part of pesticide dossiers. In the present study, these are termed “regulatory studies.” All considered regulatory studies were conducted according to the Organization for Economic Co‐operation and Development (OECD; 1998) principles of Good Laboratory Practice. Fungicides (18 field studies), herbicides (7 field studies), and one insecticide were tested. The number of treatments in these studies varied between 1 treatment compared with the control (limit test, 12 field studies), 2 treatments (4 field studies), 3 treatments (9 field studies), and 4 treatments (1 field study). In addition to these regulatory studies, an extended field study (“pilot study”) was conducted in 2017 to 2018 (Römbke et al. 2020) with 6 application rates (a.s., carbendazim) and 6 samples/plot (4 in the ISO guideline) in a “mixed design” (to determine both x% effect concentration [ECx] and NOEC values). The mixed design included 6 plots/treatment for control and 2 carbendazim treatments, and 3 plots for the 4 remaining carbendazim treatments (to be able to derive concise ECx values). In contrast to the regulatory studies, clear effects were targeted within the study by applying a concentration range of 0.6 to 31.5 kg a.s./ha and 6 treatments (0.6, 1.8, 3.2, 5.8, 10.5, and 31.5 kg a.s./ha). In the currently used ISO guideline 11268‐3 (International Organization for Standardization 2014), the reference substance carbendazim should yield a statistically significant difference of at least 50% on overall earthworm abundance (and/or biomass) compared with the control at least at one sampling date, when applied at rates of 6 to 10 kg a.s. carbendazim/ha. Thus, clear effects were expected within this pilot study.
The analysis of earthworm species frequencies in the regulatory studies showed that approximately 90% of the sampled adult individuals belonged to 5 species, Aporrectodea caliginosa (Savigny 1826; 46.3%), Aporrectodea rosea (Savigny 1826; 17.1%), Lumbricus terrestris (Linnaeus 1758; 11.9%), Allolobophora chlorotica (Savigny 1826; 9.6%), and Lumbricus castaneus (Savigny 1826; 4.4%). The statistical analyses in the present study were performed for these single species. In addition to these calculations, aggregated taxa groups and genus‐level juveniles were differentiated. The aggregated groups were “total earthworms,” “total adults,” “total juveniles,” “total endogeic,” “total epigeic,” “total anecic adults,” “total epilobous adults,” “total epilobous juveniles,” “total tanylobous adults,” and “total tanylobous juveniles” found in the field studies. Undetermined individuals were excluded from further analyses. The database created for this comparative analysis included a total of 76 442 adult individuals and 194 684 juvenile individuals (control and treatment plots; no reference plots were considered in this analysis). These individuals were analyzed accordingly at the species level for the 5 earthworm species as well as for the various aggregated earthworm groups.
Statistical analyses
Calculation of the effect levels (NOEC/LOEC values) was carried out for all available studies and at all sampling time points after application using the statistical software R (Ver 3.5.0; R Core Team 2018; package: multcomp 1.4‐8; Hothorn et al. 2008). According to ISO guideline 11268‐3 for the determination of effects on earthworms in field studies (International Organization for Standardization 2014) and according to the commonly applied practice in the corresponding study reports, data for the pilot study and regulatory studies were initially evaluated using a Dunnett's t test (α = 0.05, in this case, 2‐sided for unclear monotonicity and direction of response). For implementation of the CPCAT procedure, an R‐script was generated based on the original script for CPCAT analyses (see Lehmann et al. 2016 for details). The LOEC, not the NOEC, was used in this comparative analysis to compare the detected significant effect level. The NOEC is a measure that is not directly calculable but is defined as the highest treatment below a detected LOEC. The handling of nonmonotonous trends is often not consistent, challenging the identification of a reliable NOEC. Therefore, the LOEC, that is, the lowest concentration at which a significant difference from the control was detected (2‐sided testing), is the more meaningful reference value for this comparative analysis. The calculated distributions of p values for species and groups at all sampling time points and for all treatments are shown in the Supplemental Data, Figure S1.
For the direct comparison of calculated p values according to Dunnett's test and the CPCAT, an index was developed that we termed the “performance index.” It was calculated for each earthworm species or group at each sampling time and treatment of all field studies from the difference in the p values according to Dunnett's test and the CPCAT divided by the sum of these 2 p values (Equation 1).
This equation generates an intuitive measure of test performance between Dunnett's test and the CPCAT on a normalized scale from –1 to 1. An index value close to –1 indicates that the p value obtained with the CPCAT was significantly higher than that calculated with Dunnett's test, that is, the probability of detecting an effect with the CPCAT was lower (=Dunnett's test performs more sensitively). On the other hand, an index value close to 1 indicates a higher probability of detecting a significant effect with the CPCAT for the respective earthworm species/group at the sampling time point and treatment under consideration. “Performance,” in this sense, describes the ability of both test procedures to generate smaller probability values from the analysis of the same data sets, and thus to be more likely to detect a significant difference between control and treatment (i.e., a higher probability of obtaining p values below the threshold value p < 0.05). Because the p values of both tests are derived from different mathematical distributions, they are comparable to a limited extent. For this reason, the performance index merely represents a measure that can be used to illustrate which of the 2 tests is more likely to detect a significant effect between control and chemical treatment. Accordingly, a performance index of zero would indicate that both tests have the same probability.
To identify whether the considered earthworm abundance data from field studies were over‐ or underdispersed, the Hampel identifier was calculated for every treatment (Hampel et al. 2005) as applied and recommended by Lehmann et al. (2018) for the CPCAT. With the Hampel identifier, the difference between the mean and the variance (i.e., the residuals) is calculated for each treatment. As a cut‐off value, a threshold of 5 is defined (Sachs 2009), which means that from a value of σ2 – µ > 5, an overdispersion can be assumed, and from a value σ2 – µ < –5, a corresponding underdispersion can be assumed. The calculation of the variance was based on the formula for sample variance, in which the sample size n is corrected by n – 1. Table 1 gives an overview of the compared statistical test procedures, the considered earthworm species and groups, and the measures of comparison taken into account in the present study.
Overview of the test procedures, earthworm species, and groups compared, with the measures of comparison taken into account
| Data and statistical approaches | |
| Compared statistical procedures | CPCAT vs Dunnett's test |
| No. of considered earthworm field tests | 26 + one extended study (“pilot study”) |
| Compared species and aggregated earthworm groups | Aporrectodea caliginosa, Aporrectodea rosea, Lumbricus terrestris, Allolobophora chlorotica, Lumbricus castaneus |
| Groups:total earthworms, total adults, total juveniles, total endogeic, total epigeic, total anecic adults, total epilobous adults, total epilobous juveniles, total tanylobous adults, total tanylobous juveniles | |
| Measures of comparison | Calculated LOEC values |
| Median of actual effects (%) at LOEC | |
| Percentage of significant treatments | |
| p values/treatment | |
| Performance index (based on calculated p values) | |
| Hampel identifier (measure for [over‐]dispersion) | |
CPCAT = closure principle computational approach test; LOEC = lowest‐observed‐effect concentration.
RESULTS
Comparison of calculated LOEC values
The percentages of identically and differently (higher or lower) detected LOECs according to Dunnett's test and the CPCAT from the results of the conventional regulatory earthworm field studies and the pilot study are shown in Figure 3. The assessment includes the evaluation of abundance data for the 5 dominant species (A. caliginosa, A. rosea, L. terrestris, A. chlorotica, and L. castaneus) and the earthworm groups described previously in Data source and structure. The results of application of the reference substance as well as sampling time points before application of the test chemical were not used for these calculations. Analyzed treatments without detectable effects at a given observation (LOEC higher than the highest treatment concentration at a sampling time point of a field study) were included in the comparative analysis.
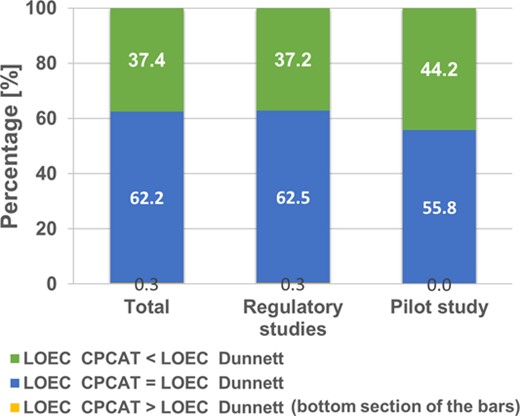
Differences in calculated lowest‐observed‐effect concentration (LOEC) values between Dunnett's test and the closure principle computational approach test (CPCAT) for data of earthworm field regulatory studies and the extended pilot study. Earthworm abundance data for 5 dominant species and aggregated earthworm groups in control and treatments of all sampling points after test chemical application were considered. Number of LOEC calculations in total: 1237 (database: 1194; pilot study: 43).
In many cases, the calculated LOEC was the same for both statistical procedures. This can be observed both in the regulatory studies (62.5%) and in the pilot study (55.8%). This result was mainly achieved when there were no large differences between control or treatment (often reported in the regulatory studies), or when the differences between control and treatment were particularly large (especially at higher test chemical concentrations of the pilot study). A detailed analysis of this relationship is presented in Figure 4. However, the results also showed that the CPCAT identified a lower concentration as LOEC than Dunnett's test in 37.2% of statistical analyses from the regulatory studies and 44.2% from the pilot field study. The CPCAT tends to detect smaller percentage differences between treatment and control as statistically significant (i.e., smaller effects), which consequently results in lower LOEC values than those derived from Dunnett's test procedure. This could be seen for the pilot study as well as for the regulatory studies with conventional test study designs.
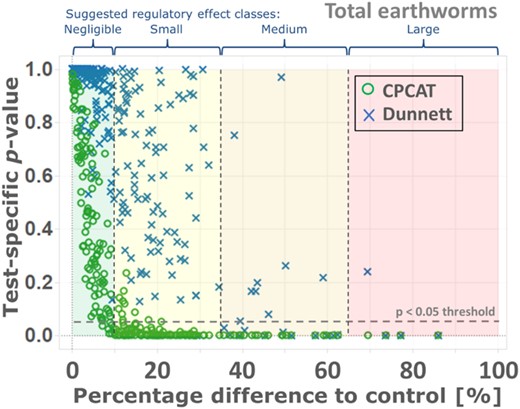
Percentage difference between control and chemical treatments plotted against calculated p values using the closure principle computational approach test (CPCAT) and Dunnett's test for abundance data of the group “total earthworms” (regulatory studies and pilot study). Background colors: Scaling of magnitude of effects as suggested in the Scientific Opinion on Soil Organisms (European Food Safety Authority Panel on Plant Protection Products and their Residues 2017), separated by dashed lines.
Table 2 shows the percentage of cases of single treatments (obtained from limit tests or as part of a field test including a concentration series) with statistically significant effects (columns 1.1 and 1.2). In addition, the median of the percentage differences between treatment and control at the detected LOEC is reported (columns 2.1 and 2.2). The number and percentage of single treatments showing a significant effect of the applied chemical on earthworm abundance data indicate that the CPCAT detected differences between control and treatment as significant in far more cases than did Dunnett's tests (see column 1.1 vs 1.2 in Table 2). In the pilot study, which tested a concentration range of carbendazim expected to elicit effects, 53.5% of earthworm species or groups and treatments of all sampling time points after application was shown to have a significant effect. In comparison, when the Dunnet method was used, the tested chemical was detected to have statistically significant effects on earthworm species or groups in 33.7% of the cases at any sampling time after application. By contrast, in the regulatory field studies, the tested chemical had statistically significant effects on earthworms in 2% of the cases if analyzed according to standardized procedures. However, according to CPCAT, 30.5% of the analyzed endpoints from the same study were statistically significantly different from the control. The results of the LOEC comparison (Figure 3) are therefore verified at the single treatment level.
Total number of tested treatments, percentage of detected treatments with significant effects, and, for all detected lowest‐observed‐effect concentrations, median of the percentage difference from controla
| % (no.) of significant treatments | Median of actual effects (%) at LOEC (no. of LOECs detected) | ||||
| Field study type | Total no. of tested treatments | Dunnett's test (column 1.1) | CPCAT (column 1.2) | Dunnett's test (column 2.1) | CPCAT (column 2.2) |
| Regulatory studies | 2260 | 2.0 (46) | 30.5 (690) | 64.4 (38) | 29.8 (472) |
| Pilot study | 258 | 33.7 (87) | 53.5 (138) | 56.6 (23) | 30.0 (28) |
| Total | 2518 | 5.3 (133) | 32.9 (828) | 56.6 (61) | 34.2 (500) |
Treatments were for different earthworm species/groups and different sampling time points after application (abundance data, no reference substance treatment considered). Shown is the percentage of detected treatments with significant effects (p < 0.05) compared with the control treatment according to Dunnett's test and the CPCAT. For all detected LOECs, the median of the percentage difference from control (=actual effect of the treatment) for Dunnett's test and the CPCAT calculations is shown. The median of actual effects was only considered when a LOEC could be detected (no. of detected LOECs/approach in parentheses).
CPCAT = closure principle computational approach test; LOEC = lowest‐observed‐effect concentration.
As a consequence, the treatment effect ranges that could be identified as being statistically significantly different from control were also substantially lower (percentage difference from control at LOEC). If a LOEC was detected, which was less often the case with the Dunnett's test approach than with the CPCAT, this LOEC with the CPCAT implied a median difference of 29.8% (regulatory studies) and 30.0% (pilot study) between treatment and control (see column 2.2 in Table 2). For Dunnett's test, the percentage difference at the LOEC was actually between 64.4% (regulatory studies) and 56.6% (pilot study; see column 2.1 in Table 2). This indicates that 1) a Dunnett‐derived LOEC in earthworm field tests from this comparative analysis caused a stronger effect than one would generally assume for a LOEC, and that 2) when CPCAT was used, the effect range detected as statistically significantly different from control (LOEC) was approximately half as large. Please note that the results of the aggregated earthworm groups are not independent of the results for the single species, so there may be an inflation of the observed trend. Nevertheless, these results are consistent for all tests and single species considered.
Comparison of p values
After the comparison of the LOEC values that were detected via either Dunnett's test or the CPCAT procedure, the calculated p values for the different endpoints were assessed. Figure 4 shows a visual comparison of the p values calculated with Dunnett's test and the CPCAT for the earthworm field tests distributed along with the respective percentage difference between treatment and control. The percentage difference detected for the respective endpoint assessed between control and chemical treatment on the x‐axis is classified and divided by colors and dashed lines into 4 different classes, adapted from the scaling of the magnitude of effects of the European Food Safety Authority (EFSA) soil opinion (European Food Safety Authority Panel on Plant Protection Products and their Residues 2017). Differences of up to 10% between control and treatment were defined as negligible, up to 35% as small effects, up to 65% as medium effects, and from 65% as large effects. Especially in classes of small and medium effects (10–65% difference from control), the CPCAT was seen to detect many more statistically significant differences than Dunnett's test. It should be kept in mind, however, that the EFSA assessment criteria refer to the possible effects on the soil protection goals and not specifically to the measurement endpoints of individual organism groups in the field.
Use of CPCAT in comparison with Dunnett's test increases the probability that significant effects will be identified, even in effect classes with small effect sizes. The CPCAT is therefore considered to be “more sensitive,” that is, significant effects of the test chemical are already shown for smaller differences between treatments and the control. This was evident for data from the regulatory field tests as well as for the pilot study, especially in aggregated groups with relatively high abundance values, as shown for the group “total earthworms” (Figure 4). This trend was also observed for single earthworm species and groups. Results for species and ecological/morphological earthworm groups are shown in the Supplemental Data, Figure S2.
Figure 5 presents the calculated p values as distributions for single sampling time points for the 2 test procedures. By way of example, the boxplots are shown for the endpoints “total earthworms,” the dominant species A. caliginosa, and the distribution of the p values of all considered single earthworm species and aggregated groups.
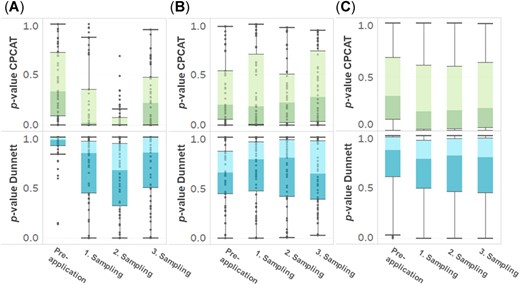
Boxplots of p value distributions for (A) total earthworms, (B) Aporrectodea caliginosa, and (C) all single earthworm species and aggregated groups according to the closure principle computational approach test (CPCAT) and Dunnett's test procedures for single sampling time points. Boxplots with whiskers of 1.5 × interquartile range. The dots in (A) and (B) represent single observations; due to the high total number of observations, only boxplots and outliers are shown in (C).
The analyses demonstrate that the CPCAT generally generated lower p values, regardless of the sampling time point within the test period. However, the CPCAT also detected far more significant differences between control and treatment than Dunnett's test during presampling. In the group of “total earthworms,” the analysis of the presampling of 50 control treatment combinations in all tests before application revealed that 8 treatments showed significant differences from control. This corresponds to a percentage of 16.0%. In these cases, the median difference between the control treatment and the (yet untreated) treatment plots was 19.2% (positive and negative deviations). Dunnett's test did not show any significant differences in the presampling for total earthworms.
For all single earthworm species and groups, the CPCAT detected an effect in presamplings in 19.0% of the calculations (137 of 720 tests). The percentage difference between treatment and control plots in these cases resulted in a median of 27.9% (positive and negative deviations). Dunnett's test identified only 9 of 720 observations as significant (1.3%) for these groups; the difference between the control and treatment plots was accordingly at a median of 137.0% (positive and negative deviations). Regarding the third sampling 1 yr after application, the CPCAT detected 31.4% (231 of 735) statistically significant treatments for all tested groups. By contrast, Dunnett's test only found 4.6% (34 of 735) cases.
Performance index: Dunnett's test versus CPCAT
The test results of the statistical analyses just outlined indicated that the CPCAT generated lower probability values for the same data composition compared with the Dunnett approach. This is supported by a summarizing illustration of the distribution of the performance index between Dunnett's test and the CPCAT (Figure 6). The performance index for abundance data of all considered single earthworm species and groups in all field tests had a median value of 0.52. This means that the median p value according to the CPCAT was approximately one‐third of the corresponding calculated value according to Dunnett's test. Fifty percent of the calculated index values were within the range of 0.15 (lower quartile) and 0.94 (upper quartile), indicating that the vast majority of observations provided lower p values using the CPCAT. As a result, the performance index was significantly different from zero (which would indicate a uniform distribution of p values). However, there are also some data constellations in which this is not the case, that is, Dunnett's test procedure had a lower probability value (lower whisker of –0.366).
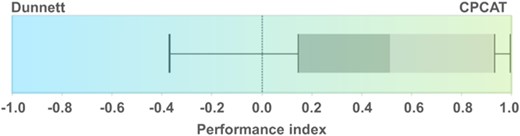
Distribution of the performance index for the comparison of probability values calculated by Dunnett's test and the closure principle computational approach test (CPCAT; earthworm field study abundance data).
Impact of overdispersion for earthworm field study data
The distribution of the calculated Hampel identifier as a state variable for overdispersion of analyzed earthworm abundance data for all treatments is shown in Figure 7. The box‐whisker plots for aggregated earthworm groups and single species (separated between regulatory studies and the pilot study) show that there was generally a strong overdispersion in abundance data from the earthworm field studies. For the aggregated groups (Figure 7, left), which showed higher sampling numbers compared with the single species, the Hampel identifier was accordingly higher. In regulatory studies, the median value was calculated to be 141, and in the pilot study it was 94, in each case clearly above the threshold value for overdispersion of >5. However, as can be seen in the assessment of the CPCAT probability values and corresponding LOECs in the previous section, Comparison of calculated LOEC values, this strong overdispersion in aggregated groups did not result in higher p values being calculated with the CPCAT in contrast to Dunnett's tests (i.e., the CPCAT would be less selective in these cases). The opposite was found in the present study.
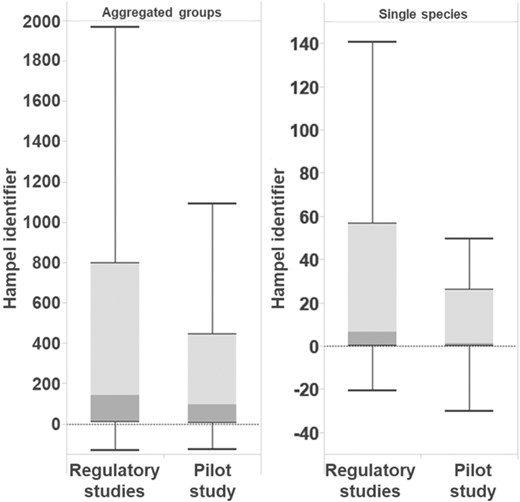
Distributions of the Hampel identifier for treatments of aggregated groups and single species (regulatory studies and earthworm pilot field study).
For single earthworm species (Figure 7, right panel) the Hampel identifier was usually much lower: the median was approximately 7 for regulatory studies and only 1 for the data from the pilot study. However, the scattering of the Hampel identifier for all observations was quite high. Overall, even at the level of single species, there was a clear trend toward overdispersion in the data sets (i.e., the variance was greater than the mean value). It was demonstrated that the CPCAT was still more powerful in these cases. However, this analysis also showed that the Hampel identifier was quite conservative for data from earthworm field studies, because the assumed threshold value of >5 for overdispersion was exceeded in most of the cases, especially with large sampling numbers.
DISCUSSION
The OECD states in the guideline for current statistical approaches for the analysis of ecotoxicity data that it “should be understood that the goal of selecting a method for determining a NOEC is not to find the most powerful method. Rather, the focus should be on selecting methods most appropriate for the data and end result. Power is certainly an ingredient in this selection process” (Organisation for Economic Co‐Operation and Development 2006). Our analyses should be interpreted in light of this context. The Poisson distribution used in CPCAT procedures describes earthworm abundance data in field tests mathematically and statistically more accurately than the underlying normal distribution used in conventional multiple t tests (e.g., Dunnett's or Williams' test, see the Introduction section for details and references). In case of overdispersion (µ < σ2), which can be frequently observed in earthworm field test data, the exact Poisson distribution (with the assumption of µ = σ2) is too conservative, because it requires µ and σ2 to be equal. Nevertheless, the resulting generalized Poisson distribution (allowing for µ ≠ σ2; Consul 1989) can be estimated approximately correctly by the CPCAT (for details, see Lehmann et al. 2018). In addition, the CPCAT procedure takes into account the binomially distributed characteristic of count data, which is a major advantage in contrast to approaches of the t test family, especially in the case of small count numbers—as can be seen in the earthworm field test results for many single species. This makes the CPCAT more appropriate for the testing of earthworm field study abundance data than any test procedure from the multiple t test family. For future available versions of the CPCAT, it will be critical to consider possible overdispersion by including the dispersion factor of a generalized Poisson distribution.
As another consequence, use of the CPCAT also increases the probability of detecting significant differences between controls and chemical treatments, which reduces the probability of a type II (beta) error (false‐negatives, the probability of keeping a null hypothesis although it should have been rejected) and raises the test power of the performed earthworm field tests. This result of increased power of the CPCAT compared to Dunnett's test could also be shown for field studies with overdispersed data, because overdispersion is a drawback for multiple t tests as well (Green et al. 2018). The increase in test power is presumably also a result of the use of the closure principle, a powerful tool in multiple testing (Bretz 2011) that avoids duplicate testing of hypotheses and alpha‐inflation (Figure 2).
The comparative analysis of earthworm field abundance data reveals that the application of standard multiple testing procedures leads to a disguising of effects due to high differences needed between control and treatments. This consequently results in uncertainties regarding the actual level of effects at the determined NOEC level. Therefore, it is strongly recommended to replace multiple t tests, especially in OECD guidelines (Römbke et al. 2020). The CPCAT offers a more powerful and statistically accurate evaluation for earthworm field study abundance data, leading to the statistical detection of smaller differences between control and chemical treatments.
The NOEC and related hypothesis testing concepts have long been criticized in ecotoxicological literature (Laskowski 1995; Koijman 1996; Walter et al. 2002; Warne and van Dam 2008; Jager 2011, 2012; Tanaka et al. 2018). Shortcomings of the NOEC/LOEC design are also retained when the CPCAT is used, even if the inefficiencies in the effect threshold calculation can be reduced. Landis and Chapman (2011) pointed out 4 limitations associated with using the LOEC approach: 1) It “ignores critical data” and only uses a small subset of the dataset; evidence of an effect from lower or higher concentrations is not considered; 2) It “uses a lack of evidence as no‐effect,” because null‐hypothesis testing is applied; not rejecting the null hypothesis can result from a poorly designed or badly replicated and underpowered experiment; 3) It is “inconsistent between studies” because LOECs/NOECs depend on the experimental design (number and range of exposure concentrations) that is often prescribed in standard test protocols; and 4) It is “not associated with any measure of uncertainty,” for example, the standard deviation. Despite the criticism of the NOEC concept, it is still common practice in regulatory contexts and scientific publications (Jager 2011; Iwasaki et al. 2015; Tanaka et al. 2018). As long as this continues to be the common practice, the CPCAT should certainly be considered as a more appropriate analysis of count data.
However, there is still a need for investigation regarding the mathematical determination of statistical power (defined as 1‐β error) for the CPCAT, as is feasible for multiple t tests (Cohen et al. 2012). For CPCAT calculations, this seems to be practicable only by simulation studies. This comprises an iterative approximation of the threshold value at which a difference between control and treatment is detected as significant. Accordingly, a resulting sample size planning for experiments based on the CPCAT is not yet possible. Because LOECs strongly depend on the experimental design and the number of replicates used in the statistical test, large type II errors (β‐errors) might be hidden within the resulting NOEC value (Laskowski 1995). For regulatory sciences, it is generally recommended that type II errors “should be of greater concern than type‐I‐error […] because the decision for protection of the environment must be biased […] toward safety rather than certainty of positive results” (Tanaka et al. 2018). Therefore, the sample‐size calculation needs to be established for CPCAT.
Moreover, up to now, the CPCAT has not been implemented in OECD guidelines for the testing of chemicals. Although the R‐scripts to perform the CPCAT are freely available (Lehmann et al. 2016), it is not yet available as an easy‐to‐use function in any of the commonly used statistical software packages. For this reason, the applicability of the CPCAT should continue to be tested in more and diverse case studies, covering both laboratory and field studies.
However, the results from the calculations with the CPCAT also show that this approach can detect significant effects even with relatively small differences from control. This unmasks a characteristic of earthworm field tests: due to the test design (usually 4 replicates/treatment), many test outcomes show a relatively large variation in the data for earthworm species and groups even without the impact of chemical treatment (e.g., data from presampling). The CPCAT, in contrast to the less sensitive Dunnett approach, already detected significant differences in these presampling cases, with a median of approximately 19% difference between control and treatment. This leads to the question of whether these differences are to be taken seriously—in other words, whether the variability in the field might prevent the use of such studies in a regulatory context. Another potential interpretation is that the CPCAT is “too sensitive” in defining differences as effects. In this respect, the differences between treatment and controls need to be assessed from a biological and ecological point of view—and not relying merely on statistical methods to detect significant differences. However, if one concludes that these statistically significant effects (according to the CPCAT) in this respective effect class do not yet result in any ecological consequences for the environment, the question arises of whether the earthworm field tests can provide information or derivations at all regarding the defined effect criteria of the EFSA (e.g., 10–35% effect for small effects; European Food Safety Authority Panel on Plant Protection Products and their Residues 2017). As EFSA states, the lack of statistical significance should not be the sole rationale for concluding that a lack of an exposure‐related effect exists (European Food Safety Authority Scientific Committee 2017). As a consequence, a statistical significance should also not be the sole justification for concluding that a treatment‐related effect exists (Organisation for Economic Co‐Operation and Development 2006).
This leads to the question of whether test results can and should be defined as statistically, regulatory, and ecologically relevant effects. Subsequently, along this causal chain, the question arises of whether these types of effects are the same, that is, a statistically significant effect implies that it is regulatorily relevant (for protection goals) and ecologically relevant (concerning the test organism community). It is evident that the use of the CPCAT reduces the β‐error in the test approaches, that is, we have a lower probability of missing an (also ecologically relevant) effect in the test. By using a statistically correct method such as the CPCAT, the difficulties in the evaluation of earthworm field data as described by de Jong et al. (2006) could be partly overcome. These authors acknowledged that the acceptability of effects was determined by the limitation of the statistical procedure used, and the question of biological relevance was hampered by the power of the test (de Jong et al. 2006). However, the question of whether the use of the CPCAT leads to increased detection of statistically significant effects that are not biologically relevant in the field (ecologically false‐positive decisions) cannot be answered by statistical analyses. This requires judgment and expert knowledge for specific situations and scenarios of experienced field ecologists or corresponding long‐term studies.
CONCLUSIONS
The statistical procedure CPCAT is an appropriate tool for the analyses of abundance data from earthworm field studies. In general, an improvement of the test power (reduction of the LOEC/NOEC thresholds) compared with multiple t tests can be assumed, even if a high variance (overdispersion) in the earthworm data was identified for the data of earthworm field tests.
The present comparative analysis revealed that the application of standard multiple testing procedures (e.g., Dunnett's test) leads to a disguising of possible effects due to relatively high differences needed between control and treatments to detect statistically significant differences. This consequently results in uncertainties regarding the actual level of effects at the NOEC. The CPCAT offers a more powerful alternative; statistically significant differences between the treatments and control are detected even at smaller percentage differences. However, this raises the reasonable question: what magnitude of difference from the control should be considered biologically or ecologically relevant? Bear in mind that this trend also increases the number of false‐positive events from an ecological (or regulatory) perspective, that is, the identification of statistically significant effects with no ecological relevance (or without relevance regarding the regulatory protection goals). Although imperative, such a discussion is beyond the scope of the present study. Furthermore, the new CPCAT procedure was applied to only a limited set of different ecotoxicological data and lacks a method for mathematically estimating statistical power (as complementary to the beta error, 1‐ß). We argue that further applications of the CPCAT should be envisaged in the future, especially for field data.
Supplemental Data
The Supplemental Data are available on the Wiley Online Library at https://doi.org/10.1002/etc.5015.
Acknowledgment
The authors acknowledge funding from UFOPLAN (grant 3715 67 420 0: Necessary adaptations of harmonized field‐testing procedure and risk assessment of earthworms [terrestrial]) and the provision of data by the Federal Environment Agency of Germany. Open Access funding enabled and organized by Projekt DEAL.
Data Availability Statement
Data, associated metadata, and calculation tools are available from the corresponding author ([email protected]). Earthworm field study data used in the present study were obtained for regulatory purposes during the registration process of plant protection products. For legal reasons, raw data are not publicly available. Associated metadata are available in the Supplemental Data.
