


Abstract
Per‐ and polyfluoroalkyl substances (PFAS) are associated with several disrupted physiological and endocrine parameters. Regarding endocrine mechanisms, laboratory studies suggest that PFAS could disrupt the thyroid hormone system and alter circulating thyroid hormone concentrations. Thyroid hormones play a ubiquitous role—controlling thermoregulation, metabolism, and reproduction. However, evidence for disruption of thyroid hormones by PFAS remains scarce in wildlife. The present study investigated the associations between concentrations of PFAS, thyroid hormones, and body condition in an arctic seabird, the black‐legged kittiwake (Rissa tridactyla). We collected blood from kittiwakes sampled in Svalbard, Norway (2013 and 2014). Plasma samples were analyzed for total thyroxine (TT4) and total triiodothyronine (TT3) concentrations; detected PFAS included branched and linear (lin) C8 perfluoroalkyl sulfonates (i.e., perfluoroctane sulfonate [PFOS]) and C9‐C14 perfluoroalkyl carboxylates (PFCAs). The dominant PFAS in the kittiwakes were linPFOS and C11‐ and C13‐PFCAs. Generally, male kittiwakes had higher concentrations of PFAS than females. We observed positive correlations between linPFOS, C10‐PFCA, and TT4 in males, whereas in females C12‐14‐PFCAs were positively correlated to TT3. Interestingly, we observed contrasted correlations between PFAS and body condition; the direction of the relationship was sex‐dependent. Although these results show relationships between PFAS and circulating thyroid hormone concentrations in kittiwakes, the study design does not allow for concluding on causal relationships related to effects of PFAS on the thyroid hormone system. Future experimental research is required to quantify this impact of PFAS on the biology of kittiwakes. The apparently different associations among PFAS and body condition for males and females are puzzling, and more research is required. Environ Toxicol Chem 2021;40:820–831. © 2020 The Authors. Environmental Toxicology and Chemistry published by Wiley Periodicals LLC on behalf of SETAC.
Abstract

INTRODUCTION
Per‐ and polyfluoroalkyl substances (PFAS) are synthetically produced chemicals used as surfactants and repellents. Once released into the environment they are able to undergo long‐range transport from areas of high use to remote areas with few local sources such as the Arctic (Young et al. 2007). Following transport to the Arctic, PFAS are available for uptake by local wildlife and have been detected in a range of species such as mammals, fish, and birds (Letcher et al. 2010).
A number of studies—laboratory and field studies—have investigated the potential effects of PFAS on organisms. These substances seem to affect lipid storage; for instance, a laboratory‐based study has demonstrated that PFAS can affect fatty acid and lipid synthesis, storage, and metabolism in a fish model (Cheng et al. 2016). Tartu et al. (2017) investigated the effects of organohalogenated contaminants on biomarkers of energy metabolism in polar bears (Ursus maritimus) and found a positive association between PFAS and the transcript levels of the sterol regulatory element–binding protein 1 gene (involved in synthesis of fatty acids) and plasma levels of cholesterol, high‐density lipoprotein, and triglycerides.
Furthermore, PFAS are endocrine‐disrupting chemicals, targeting, among other endocrine systems, the hypothalamus–pituitary–thyroid axis and the secretion and regulation of thyroid hormones. The thyroid hormones thyroxine (T4) and triiodothyronine (T3) are released from the thyroid gland into the bloodstream, where the majority of the hormones bind to transthyretin and albumin (Ishihara et al. 2003). The active form of the hormone is T3, and T4 is converted to T3 by iodothyronine deiodinases (Ishihara et al. 2003). Thyroid hormones are required for proper metabolism and thermoregulation, body weight control, growth, reproduction, molting, brain development, and cell differentiation (Merryman and Buckles 1998).
Laboratory exposure experiments on fish indicate effects of PFAS on thyroid hormone production (Shi et al. 2009; Liu et al. 2011; Zhang et al. 2018). But less is known for wildlife, and there are contrasting reports of the potential effects of PFAS on the thyroid hormone system in wildlife species in the scientific literature. Positive correlations between various PFAS and circulating concentrations of T4 and/or T3 have been reported for seabirds (Braune et al. 2011; Nøst et al. 2012; Melnes et al. 2017; Hovden 2018). In contrast, negative correlations have been found between PFAS and thyroid hormones in polar bears (U. maritimus; Bourgeon et al. 2017), suggesting that the impact of PFAS on this endocrine axis may depend on the degree of PFAS contamination, the species, or the environmental context.
In the Arctic, wildlife faces extreme environmental challenges because of the low temperatures and demanding climate. Even for migratory species, such as seabirds, which only remain in the Arctic for the summer season, the conditions during summer are characterized by low ambient temperatures and frequently inclement weather. Reproduction is a demanding event (Drent and Daan 1980), which when combined with challenging environmental conditions necessitates proper thyroid function, in particular because of the function of thyroid hormones in thermoregulation, reproduction, and energetics (Merryman and Buckles 1998). If the thyroid system is disrupted, it may impact the ability of the species to cope with environmental challenges, store energy, grow, and reproduce, thus potentially affecting avian population demography (Ruuskanen et al. 2021).
The black‐legged kittiwake (Rissa tridactyla, henceforth “kittiwake”), an arctic and boreal seabird, is currently experiencing population declines along the coast of mainland Norway (Anker‐Nilssen et al. 2019). The causes are still unknown, and although factors related to climate change and prey availability are likely partially responsible, further research on the significance of endocrine‐disrupting anthropogenic pollutants, such as PFAS, is required to understand these population declines.
Studies have reported PFAS in blood and liver of kittiwakes (e.g., Letcher et al. 2010; Nøst et al. 2012; Tartu et al. 2014; Blévin et al. 2017a). Because PFAS are a relatively new class of toxicants to be investigated, there have been no extensive studies on how they affect thyroid hormones in kittiwakes. To our knowledge, only 2 studies have investigated this so far: Nøst et al. (2012) reported positive associations between PFAS and thyroid hormone concentrations in kittiwake chicks in Svalbard; Blévin et al. (2017b), on the other hand, did not find any significant associations between PFAS and thyroid hormone concentrations in adult kittiwakes. It is possible that the relatively low sample size used in that particular study (n = 35) may have prevented the detection of significant relationships. There are differences in thyroid hormone status and function between chicks and adults (McNabb and Hughes 1983). The role of thyroid hormones in chicks is important for the development of endothermy and metabolism and for growth and development, where the hormones act to stimulate growth and cell differentiation (McNabb 2007). There is a large body of evidence demonstrating effects of thyroid hormones on tissue oxygen consumption and a strong link with basal or resting metabolism (Hulbert 2000; Kim 2008; Welcker et al. 2013), and basal metabolic rate (BMR) has a role in short‐term thermal acclimation and endothermy (McKechnie 2008; Sirsat and Dzialowski 2020). In addition, thyroid hormones are important factors in regulating reproduction (Nishiwaki‐Ohkawa and Yoshimura 2016) and thus reproductive success. Therefore, a disruption of thyroid hormones caused by exposure to PFAS in arctic breeding seabirds may impair their capability to deal with cold temperatures, interfere with lipid stores and lipid metabolism, and affect reproductive success, especially in a context of environmental changes (Ruuskanen et al. 2021).
The aim of the present study was therefore to further examine the relationships between plasma concentrations of PFAS and thyroid hormone concentrations (total T4 [TT4] and total T3 [TT3]) in chick‐rearing kittiwakes breeding in Kongsfjorden, Svalbard, Norway. Furthermore, the study investigated whether PFAS affected the body condition of the kittiwakes, which was used as a proxy for lipid storage.
MATERIALS AND METHODS
Sample collection and field procedures
Kittiwakes were all sampled from one colony (“Krykkjefjellet” located 6 km southeast of Ny‐Ålesund, 78°55′N, 11°56′E) in Kongsfjorden, during the chick‐rearing period of their breeding cycle. The sampling periods were between 3 and 6 July in 2013 and between 14 and 20 July in 2014. Each year 15 male and 15 female kittiwakes were sampled in the colony, resulting in 60 samples. The kittiwakes were caught on their nests using a telescopic rod with a nylon noose attached at the end. A maximum of 2.5 mL of blood was collected from the brachial vein. The blood was stored on ice during fieldwork and centrifuged on returning to the laboratory in Ny‐Ålesund. After centrifugation the plasma was transferred into another Eppendorf tube and frozen at –20 °C. The remaining red blood cells were kept in the original Eppendorf tubes and frozen at –20 °C to be used for sex determination.
Birds were weighed to the nearest 2 g using a Pesola spring balance, and their skull length (head and bill), wing length, and tarsus length were measured to the nearest 0.5 mm with a sliding caliper (data summarized in Supplemental Data, Table S1). The birds were monitored after release to ensure that they returned to the nest, which they all did.
The study was approved by the governor of Svalbard and the Norwegian Animal Research Authority. All handling and sampling of the birds were in accordance with the regulations of the Norwegian Animal Welfare Act.
Analyses of PFAS
The PFAS analyses were performed at the Norwegian Institute for Air Research in Tromsø, Norway, on plasma samples. The PFAS analytes are listed in Table 1 together with their chemical structures. The samples were analyzed for PFAS as described by Hanssen et al. (2013). More details on how the analysis was performed can be found in the Supplemental Data.
The per‐ and polyfluoroalkyl substances analyzed in chick‐rearing black‐legged kittiwakes (Rissa tridactyla) caught in Kongsfjorden, Svalbard, in 2013 and 2014, divided into perfluoroalkyl carboxylic acids and perfluoroalkyl sulfonatesa
| Group | Abbreviation | Analyte | Chemical structure |
| PFCAs | PFHxA | Perfluorohexanoate | C5F11COO– |
| PFHpA | Perfluoroheptanoate | C6F13COO– | |
| PFOA | Perfluorooctanoate | C7F15COO– | |
| PFNA | Perfluorononanoate | C8F17COO– | |
| PFDA | Perfluorodecanoate | C9F19COO– | |
| PFUnDA | Perfluoroundecanoate | C10F21COO– | |
| PFDoDA | Perfluorododecanoate | C11F23COO– | |
| PFTrDA | Perfluorotridecanoate | C12F25COO– | |
| PFTeDA | Perfluorotetradecanoate | C13F27COO– | |
| PFSAs | PFHxS | Perfluorohexane sulfonate anion | C6F13SO3– |
| brPFOS | Branched perfluoroctane sulfonate anion | C8F17SO3– | |
| linPFOS | Linear perfluoroctane sulfonate anion | C8F17SO3– | |
| PFDS | Perfluorodecane sulfonate anion | C10F21SO3– |
The limit of detection was <0.05 ng/mL for all compounds.
PFCA = perfluoroalkyl carboxylic acid; PFSA = perfluoroalkyl sulfonate.
For every batch of 10 samples, one tube with a blank and one with a standard reference material (SRM 1957; National Institute of Standards and Technology) were included. Together with an internal and a recovery standard, this formed the basis of the quality assurance. The internal standard contained known concentrations of 13C‐labeled PFAS. This standard was added at the beginning of the extraction with the assumption of an equal loss of the internal standard and the 12C PFAS in the sample through the extraction and cleanup processes. The recovery standard was added just before running the samples on the instrument for the purpose of determining the performance of the analytical method used. The reference samples were within the acceptable range, and the blank samples were below the limit of acceptable contamination determined by the laboratory.
Analyses of thyroid hormones
The hormone assays for TT3 and TT4 were performed at the Centre d'Etudes Biologiques de Chizé, France, using radioimmunoassay, as described by Blévin et al. (2017b).
For quality control, reference materials were used, which were within the acceptable range determined by the laboratory. Furthermore, because every plasma sample was analyzed in duplicate, only samples with a coefficient of variance (CV) <15% were used for statistical analyses. The mean CV calculated for the TT4 assays was 3.82% in 2013 and 3.34% in 2014. The mean CV for the TT3 assays was 4.76% in 2013 and 4.50% in 2014. The mean interassay variation for TT3 was 8.98%, and that for TT4 was 11.4%.
Sex determination
Sex determination by polymerase chain reaction and gel electrophoresis was performed for those individuals caught which had not been previously molecularly sexed at the Norwegian University of Science and Technology, Trondheim. The analysis was performed as described in Griffiths et al. (1998) and outlined in the Supplemental Data.
Data treatment and statistical analyses
From a total of 60 kittiwakes caught, 4 individuals were sampled in both years. All these individuals were females, and in the data treatment only one random (determined by a coin toss) observation for each of these individuals was included.
Furthermore, one male and one female kittiwake were excluded from the TT4 data sets because of too high variance between their duplicated plasma samples (>15%). Thus, the final sample size for male kittiwakes was 30 individuals for biometric variables and PFAS concentrations and 29 individuals for TT4 concentrations. For female kittiwakes the final sample size was 26 individuals for biometric variables and for TT3 and PFAS concentrations and 25 individuals for TT4 concentrations.
Statistical analyses were performed using R, Ver 3.6.1 (R Development Core Team 2019). The data (concentrations of PFAS and thyroid hormones) were resampled by bootstrapping (using the infer package, 5000 replicates). Some of the PFAS variables contained observations which were below the limit of detection (LOD; <0.05 ng/mL for all compounds) and were thus left‐censored. Specifically, branched perfluoroctane sulfonate anion (brPFOS), perfluorotetradecanoate (PFTeDA), perfluorohexanoate (PFHxA), perfluoroheptanoate (PFHpA), perfluorooctanoate (PFOA), perfluorohexane sulfonate (PFHxS), and perfluorodecane sulfonate (PFDS) contained observations below the LOD; PFHxA, PFHpA, PFOA, PFHxS, and PFDS contained >70% censored observations and were omitted from analyses. Because it is inappropriate to substitute nondetects with a value (Helsel 2006), the nonparametric Kaplan‐Meier technique was used on brPFOS and PFTeDA using the NADA package to obtain the descriptive statistics. Based on the bootstrapped data, mean values were calculated for the mean, the 95% confidence interval (CI) of the mean, and median.
The body condition of each individual bird was determined using the biometric variable (length of skull, wing, or tarsus) that was most correlated to body mass. Skull length was most strongly correlated to body mass (r = 0.50, p < 0.001). The standardized residual of linear regression plots of skull length as the independent variable against body mass as the dependent variable was determined to be the body condition.
The kittiwake data set was examined for differences between the years (2013 and 2014) by comparing the 95% CIs of the means, as described by Erickson and Rattner (2020; see specifically the section “Confidence intervals”). Differences in thyroid hormone and PFAS mean concentrations between male and female kittiwakes were also examined by comparing their 95% CIs. Potential associations between thyroid hormones and body condition were investigated using linear regression and considered meaningful if the 95% CI of the regression slope did not contain zero (Ismay and Kim 2020).
To examine if levels of thyroid hormones were associated with PFAS levels—thus indicating an effect of PFAS on thyroid hormones—a 2‐pronged approach was used: principal component analysis (PCA) and linear regression. Because of the issue of multicollinearity of the PFAS, PCA was performed to obtain principal components (PCs), which were subsequently regressed against the thyroid hormones. Because PCA is an unsupervised feature extraction method (Jolliffe 2002), the linear regression was performed with all PCs; and those which were significant were selected and are presented in the Supplemental Data. Afterward, linear regression of single PFAS was employed to further investigate which PFAS were correlated with thyroid hormones because effects of PFAS may depend on their carbon chain length (Costantini et al. 2019). To account for the censored PFAS—brPFOS and PFTeDA—linear regression with maximum likelihood estimation was employed, as described in Jaspers et al. (2013). Again, the correlations were considered meaningful if the 95% CI of the regression slope did not contain zero. The plotted linear regressions were bias‐corrected by subtracting the mean difference in “original” coefficients and bootstrapped coefficients from the “original” coefficients. Likewise, associations between PFAS and the body condition of the kittiwakes were also examined with linear regression models. R scripts can be found in the Supplemental Data.
RESULTS
Differences in PFAS and thyroid hormone concentrations between 2013 and 2014
All PFAS and thyroid hormone concentrations are given in nanograms per milliliter. Female kittiwakes sampled in 2014 had a higher mean TT3 concentration than those sampled in 2013 (95% CI 2013, 1.88–2.83; 2014, 3.01–3.95). There was no difference in mean concentrations of TT3 between 2013 and 2014 for males (95% CI 2013, 2.31–2.91; 2014, 2.60–3.36). There were no differences in the mean TT4 concentrations in male and female kittiwakes from 2013 (95% CI males, 29.97–43.88; females, 29.19–49.61) compared to 2014 (95% CI males, 32.11–40.49; females, 29.80–42.39). On average, perfluorononanoate (PFNA) levels were higher in both males and females sampled in 2013 (95% CI males, 1.44–2.75; females, 1.14–2.15) than 2014 (95% CI males, 0.866–1.19; females, 0.788–1.06). In 2013 mean concentrations of C12‐C14 perfluoroalkyl carboxylic acids (PFCAs) were higher in male and female kittiwakes than they were in 2014 (95% CI [2013/2014] males: perfluorododecanoate [PFDoDA], 0.833–1.32/1.87–2.34; perfluorotridecanoate [PFTrDA], 3.39–4.61/5.92–7.16; PFTeDA, 0.254–0.410/0.867–1.13; and females: PFDoDA, 0.537–0.970/1.35–1.68; PFTrDA, 2.01–3.25/4.20–5.01; PFTeDA, 0.077–0.160/0.529–0.692). The differences in concentrations are shown in Figure 1. Although there were some differences in mean concentrations between years, the PFAS' mechanism(s) of action should not differ. Thus, the data sets from the 2 yr were pooled to obtain a larger sample size and variation in PFAS and thyroid hormone concentrations.
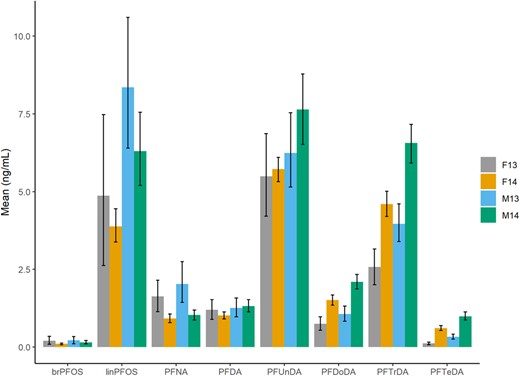
Mean concentrations (with 95% confidence intervals) of per‐ and polyfluoroalkyl substances (nanograms per milliliter of plasma) in male and female chick‐rearing kittiwakes (Rissa tridactyla) caught in Kongsfjorden, Svalbard, in 2013 and 2014. F = female; M = male; brPFOS = branched PFOS anion; linPFOS = linear PFOS anion; PFDA = perfluorodecanoate; PFDoDA = perfluorododecanoate; PFNA = perfluorononanoate; PFOS = perfluorooctane sulfonate; PFTeDA = perfluorotetradecanoate; PFTrDA = perfluorotridecanoate; PFUnDA = perfluoroundecanoate.
PFAS concentrations
The mean, 95% CI of the mean and median in PFAS concentrations after bootstrapping, as well as the range (of the original data set) in PFAS concentrations in kittiwakes are shown in Table 2. In both males and females linear (lin) PFOS, perfluoroundecanoate (PFUnDA), and PFTrDA were the PFAS present at highest concentrations. There is considerable overlap in the CIs of linPFOS (males, 6.13–8.65; females, 3.27–5.68) and PFUnDA (males, 6.10–7.82; females, 4.99–6.30), suggesting no difference in concentrations for both male and female kittiwakes. In males, both these chemicals (linPFOS and PFUnDA) were detected at higher levels than PFTrDA (95% CI 4.59–5.91). In female kittiwakes, however, only PFUnDA was detected at a higher concentration compared to PFTrDA (95% CI 3.14–4.16).
Concentrations of thyroid hormones (nanograms per milliliter of plasma) and per‐ and polyfluoroalkyl substances (nanograms per milliliter of plasma) in male and female chick‐rearing kittiwakes (Rissa tridactyla) caught in Kongsfjorden, Svalbard, in 2013 and 2014a
| Males | Females | ||||||||
| Mean | CI of mean | Median | Range | Mean | CI of mean | Median | Range | ||
| TH (ng/mL) | TT3 | 2.78 | 2.54–3.05 | 2.67 | 1.75–4.59 | 2.96 | 2.55–3.36 | 3.05 | 1.12–4.49 |
| TT4 | 36.41 | 32.49–40.48 | 36.99 | 18.61–70.05 | 37.26 | 31.73–43.15 | 35.13 | 9.53–79.83 | |
| PFAS (ng/mL) | brPFOS | 0.181 | 0.116–0.251 | 0.11 | nd–0.669 | 0.144 | 0.090–0.215 | 0.083 | nd–0.164 |
| linPFOS | 7.32 | 6.13–8.65 | 6.31 | 2.47–19.3 | 4.35 | 3.27–5.68 | 3.62 | 0.937–14.6 | |
| PFNA | 1.53 | 1.19–1.95 | 1.22 | 0.377–5.61 | 1.25 | 0.988–1.55 | 1.05 | 0.415–3.34 | |
| PFDA | 1.29 | 1.11–1.48 | 1.21 | 0.392–2.65 | 1.11 | 0.949–1.27 | 1.05 | 0.360–2.08 | |
| PFUnDA | 6.94 | 6.10–7.82 | 6.24 | 3.47–12.2 | 5.62 | 4.99–6.30 | 5.58 | 2.47–9.49 | |
| PFDoDA | 1.58 | 1.32–1.84 | 1.56 | 0.429–2.96 | 1.16 | 0.963–1.36 | 1.22 | 0.158–2.07 | |
| PFTrDA | 5.25 | 4.59–5.91 | 5.09 | 2.22–8.42 | 3.67 | 3.14–4.16 | 3.83 | 1.20–6.07 | |
| PFTeDA | 0.659 | 0.521–0.801 | 0.639 | 0.084–1.64 | 0.38 | 0.277–0.487 | 0.339 | nd–1.01 | |
The data have been bootstrapped (5000 replicates), and the mean of the descriptive statistics is presented (mean, 95% confidence interval of the mean, median, and range, of the original data set): For males, branched perfluoroctane sulfonate anion (brPFOS) was left‐censored; and for females, brPFOS and PFTeDA were left‐censored, and the values presented are estimated based on the Kaplan‐Meier technique.
nd = nondetect; brPFOS = branched perfluorooctane sulfonate anion; linPFOS = linear perfluorooctane sulfonate anion; PFDA = perfluorodecanoate; PFDoDA = perfluorododecanoate; PFNA = perfluorononanoate; PFTeDA = perfluorotetradecanoate; PFTrDA = perfluorotridecanoate; PFUnDA = perfluoroundecanoate; T3 = triiodothyronine; T4 = thyroxine.
Male kittiwakes had higher mean concentrations of linPFOS (95% CI males, 6.13–8.65; females, 3.27–5.68), PFDoDA (95% CI males, 1.32–1.84; females, 0.963–1.36), PFTrDA (95% CI males, 4.59–5.91; females, 3.14–4.16), and PFTeDA (95% CI males, 0.521–0.801; females, 0.277–0.487) compared to females.
Thyroid hormone concentrations and body condition
The mean, 95% CI of the mean, and median of TT3 and TT4 concentrations in kittiwakes after bootstrapping are presented in Table 2, together with the range in thyroid hormone concentrations of the original data set. The 95% CIs for both mean TT3 (males, 2.54–3.05; females, 2.55–3.36) and mean TT4 (males, 32.49–40.48; females, 31.73–43.15) concentrations overlapped greatly for males and females, indicating no difference in thyroid hormone concentrations between the sexes.
For female kittiwakes, there were no meaningful relationships between the thyroid hormones and body condition (95% CI of the regression slope TT3, –0.12 to 0.58; TT4, –0.23 to 0.50). The same was the case for males: no meaningful relationships were found between thyroid hormones and body condition (95% CI TT3, –0.21 to 0.47; TT4, –0.15 to 0.52).
Associations between PFAS, thyroid hormones, and body condition
Regressing the PCs from the PCA (Supplemental Data, Figure S2) against TT4 (Supplemental Data, Figure S3) and TT3 (Supplemental Data, Figure S4) showed positive associations between PFAS and both thyroid hormones.
In male kittiwakes, only TT4 was found to be positively correlated with linPFOS (95% CI of the regression slope, 0.08–0.70) and perfluorodecanoate (PFDA; 95% CI 0.09–0.67; Figure 2).
![Linear regression (±95% confidence interval [CI], shaded area) of total thyroxine (nanograms per milliliter of plasma) against natural log–transformed per‐ and polyfluoroalkyl substances (nanograms per milliliter of plasma) in male chick‐rearing kittiwakes (Rissa tridactyla) caught in Kongsfjorden, Svalbard (2013–2014, n = 29). The 95% CI for the correlation is shown for each subfigure. corr = correlation; PFDA = perfluorodecanoate; linPFOS = linear perfluorooctane sulfonate anion; TT4 = total thyroxine.](https://oup.silverchair-cdn.com/oup/backfile/Content_public/Journal/etc/40/3/10.1002_etc.4978/3/m_etc4978-fig-0002-m.jpeg?Expires=1749091821&Signature=4gALpcM9WYgPFrNgLZG1VjqNyAd5i0BSujoZg2D~Xp5J-jvfVCsZYoyhlHTQHLV2z8O4ToLPG3YX3iD3ByMzQK6Z2JqqiU7DBS0Bqf9kBQKb0F0Uwqrpc1hTKWDZMExNcTwOFrreQ1apCz9WG0wMaaf1pcSkyR2FkvfGRp-3BnXb~t-cw~yQPgbUmbLOYsNOCfl9UerMBJLN8cjScpg2869voNZuAN1mLctRWXvrc9-EU1iHDhecmghQyz3ktDuSinVNs28U-jpuNeobrKOlslqft1A4lXDHDl6iYKTuvMu~TCDYRaA65ZcSuUBGethSFKrIdC5IjEbivLFaG2oZeA__&Key-Pair-Id=APKAIE5G5CRDK6RD3PGA)
Linear regression (±95% confidence interval [CI], shaded area) of total thyroxine (nanograms per milliliter of plasma) against natural log–transformed per‐ and polyfluoroalkyl substances (nanograms per milliliter of plasma) in male chick‐rearing kittiwakes (Rissa tridactyla) caught in Kongsfjorden, Svalbard (2013–2014, n = 29). The 95% CI for the correlation is shown for each subfigure. corr = correlation; PFDA = perfluorodecanoate; linPFOS = linear perfluorooctane sulfonate anion; TT4 = total thyroxine.
In female kittiwakes, TT3 was positively correlated with PFDoDA (95% CI 0.08–0.70), PFTrDA (95% CI 0.12–0.71), and PFTeDA (95% CI 0.08–0.75; Figure 3).
![Linear regression (±95% confidence interval [CI], shaded area) of total triiodothyronine (nanograms per milliliter of plasma) against natural log–transformed per‐ and polyfluoroalkyl substances (nanograms per milliliter of plasma) in female chick‐rearing kittiwakes (Rissa tridactyla) caught in Kongsfjorden, Svalbard (2013–2014, n = 26). The 95% CI for the correlation is shown for each subfigure. The red line in (C) is the limit of detection (LOD, 0.05 ng/mL) for PFTeDA; the 5 points under the LOD have been assigned a value of one‐half the LOD for the purpose of the visual presentation only. corr = correlation; PFDoDA = perfluorododecanoate; PFTeDA = perfluorotetradecanoate; PFTrDA = perfluorotridecanoate; TT3 = total triiodothyronine.](https://oup.silverchair-cdn.com/oup/backfile/Content_public/Journal/etc/40/3/10.1002_etc.4978/3/m_etc4978-fig-0003-m.jpeg?Expires=1749091821&Signature=Jqhx~xi-1K-Cb9EoifrWaSYXBWoMLxaAN-3ievGpBceByn1NPFLxQGrjIobs7ZfRnjHqkCcylywC9TmaOYCM-hYqv7N6AkoZb18QL2rD-MRSXeYzAnqbvz5HQvJOcZ3KHWKOHWckFkq2HD02RusJFxlTLm5Y61CcBkYQq8aMYGn4rBkqB3s8Blfl0ql9~MZOKYaembuCxlJlgSmYfVQUJ90jpJ6r73gtwJl2bGA1-PVmpL2SQIb3AzDc7gDHqgu6BsjByWOqga8RvaWScdNgOBU9n95iBATN5wZP6sU4GlbOMX1QHwVyb7z~DwxUsRr0s1Ez44e89tQOkT0q-74YVA__&Key-Pair-Id=APKAIE5G5CRDK6RD3PGA)
Linear regression (±95% confidence interval [CI], shaded area) of total triiodothyronine (nanograms per milliliter of plasma) against natural log–transformed per‐ and polyfluoroalkyl substances (nanograms per milliliter of plasma) in female chick‐rearing kittiwakes (Rissa tridactyla) caught in Kongsfjorden, Svalbard (2013–2014, n = 26). The 95% CI for the correlation is shown for each subfigure. The red line in (C) is the limit of detection (LOD, 0.05 ng/mL) for PFTeDA; the 5 points under the LOD have been assigned a value of one‐half the LOD for the purpose of the visual presentation only. corr = correlation; PFDoDA = perfluorododecanoate; PFTeDA = perfluorotetradecanoate; PFTrDA = perfluorotridecanoate; TT3 = total triiodothyronine.
For male kittiwakes PFTrDA and PFTeDA were positively correlated with body condition (95% CI 0.07–0.66 for both correlations), as shown in Figure 4. For female kittiwakes, body condition was negatively correlated with linPFOS and PFNA (95% CI –0.73 to –0.14 and –0.76 to –0.22, respectively), presented in Figure 5.
![Linear regression (±95% confidence interval [CI], shaded area) of body condition against natural log–transformed per‐ and polyfluoroalkyl substances (nanograms per milliliter of plasma) in male chick‐rearing kittiwakes (Rissa tridactyla) caught in Kongsfjorden, Svalbard (2013–2014, n = 30). The 95% CI for the correlation is shown for each subfigure. corr = correlation; PFTeDA = perfluorotetradecanoate; PFTrDA = perfluorotridecanoate.](https://oup.silverchair-cdn.com/oup/backfile/Content_public/Journal/etc/40/3/10.1002_etc.4978/3/m_etc4978-fig-0004-m.jpeg?Expires=1749091821&Signature=4cA7PJ9MaE0HuvWOcETABwLHSaFeWqbLVmNYzxfomehsNFoaDErWB-~Ek~ifJJkaomR099Uvjz33aylgJuSc-bbV2yggT1vDLtFP1fHN26I0d~2T23yQUOV9BI58sQb1PGwFmmWgBiQ1XNfrrj1UlUNjoFCEfz2x0xqmie0cr8T9VyJuapbYNUDhXr4e-u4CmJM38BUsll80ds-ddH14n0du~syerD0WxkRbGumIUgUmon3FaMQ4z67~Za2Sw39WBMU7t4NLckx8n9oU80ofk2GUpTgoOzcw6Yo2kzPeBtRrSZBIumprDvBtuaXbiPExWdOrJUO7sc3iN7vzN3ZqNA__&Key-Pair-Id=APKAIE5G5CRDK6RD3PGA)
Linear regression (±95% confidence interval [CI], shaded area) of body condition against natural log–transformed per‐ and polyfluoroalkyl substances (nanograms per milliliter of plasma) in male chick‐rearing kittiwakes (Rissa tridactyla) caught in Kongsfjorden, Svalbard (2013–2014, n = 30). The 95% CI for the correlation is shown for each subfigure. corr = correlation; PFTeDA = perfluorotetradecanoate; PFTrDA = perfluorotridecanoate.
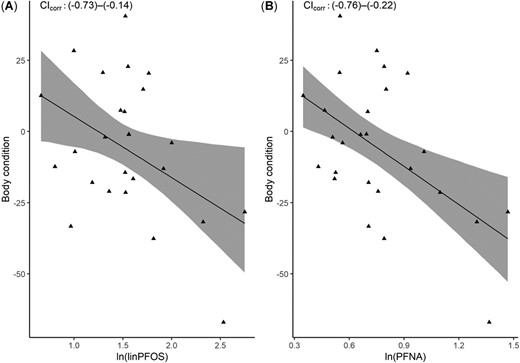
Linear regression of body condition against natural log–transformed per‐ and polyfluoroalkyl substances (nanograms per milliliter of plasma) in female chick‐rearing kittiwakes (Rissa tridactyla) caught in Kongsfjorden, Svalbard (2013–2014, n = 26). The 95% confidence interval (CI) for the correlation is shown for each subfigure. corr = correlation; PFNA = perfluorononanoate; PFOS = perfluorooctane sulfonate.
Supplemental Data, Table S3, shows the 95% CIs of all the linear regressions.
DISCUSSION
PFAS concentrations
Linear PFOS, PFUnDA, and PFTrDA were the dominant PFAS in both male and female kittiwakes in the present study. In another study of kittiwakes in the chick‐rearing part of their breeding cycle, Tartu et al. (2014) found PFTrDA to be the dominant PFAS detected in 20 kittiwakes caught in 2012 from the same colony (“Krykkjefjellet,” Kongsfjorden) as in the present study. Furthermore, the concentrations of PFTrDA in male and female kittiwakes reported by Tartu et al. (2014) were higher than those observed in the present study. Nevertheless, PFTrDA was the third most dominant substance in both males and females in the present study. For the other compounds, levels reported in the present study were comparable to the levels reported in kittiwakes by Tartu et al. (2014).
There have been indications that there are no meaningful differences in PFAS concentrations between the sexes in arctic wildlife (Verreault et al. 2005; Butt et al. 2007). This contradicts the results reported by Blévin et al. (2017a) and the results reported in the present study. Sex differences have also been reported for some PFAS in great skuas (Stercorarius skua; Leat et al. 2013), lesser black‐backed gulls (Larus fuscus; Bustnes et al. 2008), glaucous gulls (Larus hyperboreus; Melnes et al. 2017; Haarr et al. 2018), and European shags (Phalacrocorax aristotelis; Carravieri et al. 2020). There also appeared to be sex differences in PFAS concentrations for black guillemots (Cepphus grylle) and arctic skuas (Stercorarius parasiticus), although the differences were not statistically significant (Haarr et al. 2018). These studies generally found higher concentrations of PFAS in males compared to females, which is consistent with the present study. In several avian species, PFAS have been detected in eggs (Verreault et al. 2005; Miller et al. 2015). Thus, the sex differences observed in the present study are likely a result of the female bird being able to deposit some of her PFAS burden into the eggs, as suggested by Bustnes et al. (2008). Nevertheless, the difference in PFAS levels may also be caused by a difference in exposure if males and females target different prey species and/or if the sexes have differences in biotransformation capacities. To the best of our knowledge, there are no published results on whether male and female kittiwakes select different prey species. However, a personal communication from our team (Sabrina Tartu, Centre d'Etudes Biologiques de Chizé and Université de La Rochelle, Villiers‐en‐Bois, France) suggests that blood concentrations of the stable nitrogen isotope 15N relative to the isotope 14N (i.e., δ15N; used as a proxy of trophic level [Hobson 1999]) in chick‐rearing male kittiwakes are significantly higher than those measured in females (logistic regression, estimate 0.28‰, t = 3.12, p = 0.002). Although fluorotelomer alcohols can be biotransformed to PFCAs (Nilsson et al. 2013), there is currently a lack of information on the role of biotransformation processes of PFAS in birds and, in particular, whether there are sex differences. Thus, maternal deposition of PFAS into eggs in addition to sex‐specific differences in diet appear as reliable factors to explain the observed sex difference in the PFAS concentrations.
Newsted et al. (2005) calculated avian toxicity reference values for PFOS based on experiments with northern bobwhite quail (Colinus virginianus). The predicted‐no‐effect concentration (PNEC) of PFOS in serum of a trophic level 4 avian predator is 2.4 µg/mL for males and 0.15 µg/mL for females. The single highest ∑PFOS concentrations for male and female kittiwakes were 2 and 1 orders of magnitude lower than the reported PNECs, respectively (0.02 and 0.015 µg/mL). The observed concentrations in the present study are thus well below the PNECs calculated by Newsted et al. (2005), and it is unlikely that the concentrations of PFOS and other PFAS pose an overt, acute toxicological risk to the kittiwakes. Nonetheless, we must remain cautious because the concentrations experienced by the kittiwakes could be sufficient for endocrine disruption and because other factors not taken into account in laboratory experiments could make wild species more sensitive to PFAS toxicity.
Associations between PFAS and thyroid hormone concentrations
In the present study male kittiwakes had positive correlations between their concentrations of TT4 and concentrations of linPFOS and PFDA. In females, concentrations of TT3 were positively correlated to concentrations of PFDoDA, PFTrDA, and PFTeDA.
The literature on the effects of PFAS on the thyroid hormone system in free‐ranging seabirds is scarce. However, Nøst et al. (2012) reported positive associations between TT4 and perfluoroheptane sulfonate (PFHpS), brPFOS, linPFOS, and PFNA in kittiwake chicks from Svalbard. That particular study also investigated associations in northern fulmar (Fulmarus glacialis) chicks, and TT4 was found to have positive associations with PFHpS, brPFOS, and PFNA. No associations were found between TT3 and PFAS for either of the 2 species included in that study. A study on glaucous gulls from Kongsfjorden, Svalbard, found a positive association between PFOS and free T3 in females (Melnes et al. 2017). Another study of female glaucous gulls from Kongsfjorden found positive correlations between PFDA, PFUnDA, PFTrDA, and PFTeDA and TT3 and between PFDA and TT4 (Haugerud 2011). Although a study of adult kittiwakes sampled in 2012 did not find any significant relationships between PFAS and thyroid hormones, possibly because of lower sample sizes compared to the present study, they reported a positive association between some long‐chained PFAS and BMR (Blévin et al. 2017b). A positive association of BMR with T3 has been shown in kittiwakes (Welcker et al. 2013) and other birds (Chastel et al. 2003). Thus, there are several indications that PFAS are positively associated with concentrations of TT3 and TT4 in seabirds. The weak correlations found in the present study are hence strengthened and likely to be indicative of an association between PFAS and thyroid hormones in kittiwakes.
It is interesting that the particular individual PFAS found to be associated with thyroid hormones vary between different studies, even for the same species. One explanation for this might be that PFAS are not evenly distributed spatially and temporally (Rauert et al. 2018), and levels of other halogenated compounds that are thyroid‐disruptive, such as chlorinated and brominated compounds, may also vary across time and space. This could cause complicated interactive thyroid hormone‐related effects via similar or dissimilar mechanisms of actions of the various chemicals. Indeed, in female glaucous gulls, Melnes et al. (2017) reported a positive relationship between PFOS and T3 but negative relationships between chlorinated compounds and T3, indicating that that these 2 groups of contaminants could have interactive effects on thyroid hormones in a complex manner. Thus, the effect of the exposure chemicals on thyroid hormones would depend on the concentrations in birds and the relative distribution of the various compounds, which could vary between years.
The mechanism(s) of action of PFAS on the thyroid hormone system is, as of yet, largely unknown. However, one potential disruptive effect of PFAS is their competition with thyroid hormones for binding proteins: binding potencies of various PFAS in glaucous gulls have been investigated for both transthyretin and albumin (Ucán‐Marin et al. 2010; Mortensen et al. 2020), and a recent study has found that albumin is the main transport protein for PFOS, PFOA, PFHxS, PFNA, and PFDA in human plasma (Forsthuber et al. 2020). Albumin is also the most important transport protein for thyroid hormones in avian species (McNabb 2007). Most of the T4 and T3 in the plasma is thus bound to proteins, with much lower fractions of T4 and T3 being free in the plasma. Because both thyroid hormones and PFAS are associated with plasma proteins, it is possible that the positive relationship between TT4 and TT3 and the PFAS is caused by differing plasma protein concentrations in the birds. Thus, birds with low plasma protein concentrations would have low concentrations of both total thyroid hormones and PFAS, whereas birds with high plasma protein concentrations would have high thyroid hormone and PFAS concentrations. Information on the free fraction of thyroid hormones in the plasma would also be necessary in the present study to be able to better assess the importance of binding site competition between thyroid hormones and PFAS as an explanation for the increased thyroid hormone levels observed.
As for the implications of the increased thyroid hormone levels observed in the current work on kittiwake physiology, the use of plasma concentrations of thyroid hormones to diagnose hyper‐ and hypothyroidism in birds has been reported to be unreliable (Merryman and Buckles 1998). Moreover, although reference values of thyroid hormones exist for some species (Spano et al. 1987), there are considerable differences between the species, hindering any meaningful comparison. Thus, it is unknown whether the thyroid hormone concentrations measured in the kittiwakes in the present study are within the normal range of hormone concentrations or not. Nevertheless, a finely tuned regulation of the thyroid hormone system is crucial for free‐ranging species, and a potential disruption of thyroid hormones could lead to inappropriate regulation of the basal metabolism, leading to inappropriate storage of lipids, which could become highly problematic because females need to store lipids prior to egg formation. Furthermore, when considering the positive relationship reported between TT3 and BMR in adult kittiwakes (Welcker et al. 2013), it can be hypothesized that increased TT3 levels caused by high body burdens of certain PFAS could lead to an increased BMR, which could impair thermal acclimation or acclimatization in kittiwakes (Hulbert 2000; McKechnie 2008). Lastly, an increase in thyroid hormone concentrations could disrupt the adaptive decrease in BMR in kittiwakes during chick‐rearing (Bech et al. 2002).
Associations between PFAS and body condition
In male kittiwakes, there were positive correlations between body condition and 2 PFCAs: PFTrDA and PFTeDA. In females, however, body condition was negatively correlated to linPFOS and PFNA.
A previous study on kittiwakes found a positive correlation between PFNA and body condition in kittiwake males (Tartu et al. 2014), whereas PFNA was not correlated to body condition in males in the present study, although these variables were correlated in females. The concentrations of PFNA in these 2 studies are similar; 1.24 ± 0.55 ng/mL (mean ± standard deviation) in the study by Tartu et al. (2014) and 1.53 (95% CI 1.19–1.95) ng/mL in the present study. Furthermore, in contrast to the present study, Tartu et al. (2014) found no significant relationships of the investigated PFAS and body condition in female kittiwakes, whereas in the present study a negative correlation was found between body condition and linPFOS and PFNA in the females. It should also be noted that using a multivariate statistical modeling approach, Melnes et al. (2017) identified plasma levels of PFOA, PFHxS, and perfluorooctane sulfonamide as strong determinants of having a high body condition. These apparently contrasting sex‐ and species‐dependent responses in body condition to PFAS, as indicated by the correlations, highlight the need for more research on this topic before the biological effects, if any, of PFAS on the body condition and lipid storage in kittiwakes can be determined.
It is interesting that the relationship between PFAS and body condition is contrasted in male and female kittiwakes in the present study. Cheng et al. (2016) reported that male zebrafish (Danio rerio) had increased mRNA expression of 4 nuclear receptors involved in adipogenesis following PFOS exposure, whereas females only had a modest increase in expression of the pregnane X receptor. Furthermore, they noted a sex‐specific difference in concentration of serum lipids. Sex differences in energy homeostasis are also recognized in mammals (Mauvais‐Jarvis 2015; Link and Reue 2017), but the scientific literature on this topic in birds is scarce. Still, the contrasting associations between body condition and PFAS observed in the present study might be attributable to, for example, the role of sex hormones in adipogenesis (Palmer and Clegg 2015) and/or genetics (Link and Reue 2017).
Another possible explanation for the positive associations between body condition and the 2 PFCAs in male kittiwakes in the present study is that all 3 variables might be related to males feeding at a higher trophic level than females during chick‐rearing (S. Tartu, personal communication). Thus, it is possible that a high‐quality dietary intake from high–trophic level prey would lead to a higher body condition (MacArthur and Pianka 1966), accompanied by exposure to greater levels of PFAS because PFAS biomagnify along the food chain (Haukås et al. 2007). Yet, this does not explain the negative associations between body condition with linPFOS and PFNA in female kittiwakes in the present study.
It is, however, necessary to acknowledge the shortcomings of using body condition as a proxy for lipid storage in seabirds (Jacobs et al. 2012), and thus the results presented herein should be considered exploratory. Given the increasing scrutiny of environmental pollutants as so‐called obesogens (Heindel and Blumberg 2019), this is a topic which should be examined in greater detail in future studies.
CONCLUSION
In kittiwakes, PFAS were detected, half of which were at higher concentrations in males compared to females; and there were associations between some PFAS and circulating thyroid hormones. It should be noted that the positive correlations between PFAS and thyroid hormones in kittiwakes do not allow for conclusions on causal relationships. Future studies should include determination of the free fraction of thyroid hormones in the plasma. The mechanisms of how PFAS exert their effects on the thyroid hormone system are probably indirect, and future research efforts should be directed toward elucidating this. In male kittiwakes, there were positive associations between 2 PFCAs and body condition, but in female kittiwakes, the opposite was observed, with negative associations between body condition and both linPFOS and PFNA. Given the contrasting associations of PFAS on the kittiwakes' body condition, this is identified as an area where more research is needed before any meaningful conclusions can be drawn.
Supplemental Data
The Supplemental Data are available on the Wiley Online Library at https://doi.org/10.1002/etc.4978.
Acknowledgment
O. Chastel, F. Angelier, and S. Tartu were supported by Institut Polaire Français (IPEV project 330, to O. Chastel), Agence National de la Recherche (ANR project PolarTop, to O. Chastel), and INSU‐EC2CO 2014 (to O. Chastel). A.V. Ask received the Arctic Field Grant from the Research Council of Norway for the field season of 2014. At the Norwegian Institute for Air Research, we thank D. Herzke, A. Götsch, and L. Hanssen for their facilitation and help with the PFAS analyses. At Centre d'Etudes Biologiques de Chizé, we thank C. Parenteau for her help in the T3 and T4 assays. We thank S. Nilsen for her help with the kittiwake sexing. We also thank T. Cielsiski and P. Massicotte for helpful discussions on the manuscript. S. Dielschneider is gratefully acknowledged for his help with the language. Finally, we thank 2 anonymous reviewers for their helpful comments.
Disclaimer
The authors declare no conflicts of interest.
Data Availability Statement
The data are available from the corresponding author upon request ([email protected]).
