


Abstract
Contaminant analysis in biota extracts can be hampered by matrix interferences caused by, for example, co‐extracted lipids that compromise the quality of the analytical data and require frequent maintenance of the analytical instruments. In the present study, using gas chromatography coupled to high resolution mass spectrometry (GC‐HRMS), we aimed to develop and validate a straightforward, robust, and reproducible cleanup method with acceptable recoveries for diverse compound classes with a wide range of physicochemical properties representative of pollutant screening in biota extracts. We compared Oasis PRiME HLB cartridges, Agilent Captiva EMR‐Lipid cartridges, and “Freeze‐Out” with salmon lipids spiked with 113 target chemicals. The EMR‐Lipid cartridges provided extracts with low matrix effects at reproducible recoveries of the multi‐class target analytes (93 ± 9% and 95 ± 7% for low and high lipid amounts, respectively). The EMR‐Lipid cartridges were further tested with spiked pork lipids submitted to total extraction or silicone‐based passive sampling. Reproducible recoveries were achieved and matrix residuals were largely removed as demonstrated gravimetrically for both types of extracts. Ion suppression of halogenated compounds was not as efficiently removed by the cleanup of total and silicone‐based extracts of pork lipids as for the salmon lipids. However, the samples with clean up provided better instrument robustness than those without cleanup. Hence, EMR‐Lipid cartridges were shown to be efficient as a cleanup method in multi‐class monitoring of biota samples and open up new possibilities as a suitable cleanup method for silicone extracts in biota passive sampling studies using GC‐HRMS analysis. Environ Toxicol Chem 2021;40:2693–2704. © 2021 The Authors. Environmental Toxicology and Chemistry published by Wiley Periodicals LLC on behalf of SETAC.
INTRODUCTION
Analysis of (semi‐)volatile pollutants in lipid‐rich samples using gas chromatography (GC) coupled with quadrupole‐time‐of‐flight (ToF) or Orbitrap high‐resolution mass spectrometry (HRMS) has recently evolved. This change occurred due to improved mass accuracy and higher resolution yielding enhanced selectivity and sensitivity for analysis. The development has opened up the possibility of simultaneous screening of numerous contaminants with diverse physicochemical properties in environmental samples including biota (Peterson et al. 2014; Nagornov et al. 2020). Several studies have been published describing target analysis of specific compound classes such as pesticides, synthetic musks, chlorinated paraffins, and polycyclic aromatic hydrocarbons (PAHs) in complex biota and food matrices such as baby food (Lozano et al. 2018), wild salmon (Krätschmer et al. 2018), honeybees (Gómez‐Ramos et al. 2019), and tuna (Wickrama‐Arachchige et al. 2020) by GC‐Orbitrap‐HRMS. However, this increased sensitivity comes at the price of higher susceptibility to disturbing matrix constituents such as lipids that jeopardize the quality of the analyses and obtained data, and imply longer instrument downtime and higher frequency of required maintenance.
Current methods for biota analysis aimed for analyte isolation with selective determination for specific compound classes with similar properties (Gómez‐Ariza et al. 2002; Hong et al. 2004; Ma et al. 2013; Cruz et al. 2019). These methods consisted of liquid partitioning approaches including the quick, easy, cheap, effective, rugged, and safe (QuEChERS) extraction method (Cruz et al. 2019), followed by matrix removal by size exclusion chromatography such as gel permeation chromatography (Ma et al. 2013), and purification with Florisil and/or silica cartridges (Gómez‐Ariza et al. 2002), in some cases combined with sample freezing (Hong et al. 2004). More attention has lately been paid to the QuEChERS procedures combined with dispersive solid‐phase extraction (d‐SPE) materials such as zSEP (Sapozhnikova and Lehotay 2013), primary–secondary amine (PSA), or C18 (Gonzalo‐Lumbreras et al. 2014; Daniele et al. 2016) for matrix removal. However, all these multi‐stage cleanup methods require considerable labor; they include a risk of sample contamination and loss of chemicals due to nonselective interactions with the analytes of interest; and this can result in variable reproducibility (Simon et al. 2010) and impedance of their application for wide‐scope, multi‐residue analysis in biota samples.
An alternative to these approaches is using prepacked cartridges containing specific sorbents for lipid removal. Among the commercially available lipid removal cartridges, Oasis PRiME and Agilent Captiva EMR‐Lipid cartridges promise high analyte recoveries for micropollutants of environmental interest while achieving efficient lipid/phospholipid removal with the so‐called “pass‐through” method (Zhao and Lucas 2015). This method eliminates preconditioning and elution and solely requires loading the extract in an organic solvent and letting the analytes pass while retaining matrix interferences. The Oasis PRiME sorbent material is described as a reversed‐phase polymer (Zhang et al. 2015), whereas the retention mechanism of the EMR‐Lipid sorbent combines hydrophobic interactions and size exclusion to achieve high percentages of matrix removal (e.g., for unbranched aliphatic chain of lipids; Zhao and Lucas 2017).
Both cartridges were reported to successfully remove lipids from extracts of different matrices such as various meat types (Zhao et al. 2018) and milk (Castilla‐Fernández et al. 2019) and to analyze veterinary drugs with ultra‐high performance liquid chromatography (LC) coupled with tandem mass spectrometry (MS/MS). Moreover, Oasis PRiME was used in the analysis of tetracycline and quinolone antibiotics in milk (Moreno‐González et al. 2017), the insecticide fipronil and its metabolites in seafood (Zhang et al. 2018), quinolone antibiotics in chicken meat and eggs (Lu et al. 2019), and aflatoxins (Chen et al. 2016), and glyphosate, glufosinate, bialaphos and their metabolites (Guo et al. 2018) in human blood/serum—showing the capabilities of the sorbent to also remove proteins. The EMR‐Lipid cartridges were employed as the cleanup method in edible oils for organophosphate, and organochlorine pesticides and pyrethroids analyzed by GC‐MS/MS (Zhao et al. 2019) and in human plasma for mycotoxins analyzed by LC‐MS/MS (Arce‐López et al. 2020). The EMR‐Lipid cartridges were also used to analyze chlorinated and brominated compounds in human milk to identify human exposure to both known and unknown halogenated biomarkers (Pourchet et al. 2021). However, to the best of our knowledge, both cartridges have been used only for the determination of pollutant groups with similar physicochemical properties, which leaves a knowledge gap of their applicability for broad screening purposes. In this context, Álvarez‐Ruiz and Picó (2020) reviewed biota analysis of pollutants—including a wide compilation of cleanup methods applied in recent studies regarding different groups of pollutants and several matrices—and the related challenges. Cleanup approaches included centrifugation, filtration, liquid/liquid partitioning with immiscible solvents, column chromatography separation (e.g., silica, Florisil, Oasis PRiME HLB and d‐SPE with PSA and C18), and chromatographic separation systems (gel permeation and turbulent flow chromatography). The authors concluded that Oasis PRiME HLB was widely used mainly in methods targeting pharmaceuticals and personal care products but also for perfluorinated compounds or ultraviolet (UV) filters. They identified the most recent trend within this field to be the development of specific sorbents such as Agilent Captiva EMR‐Lipid, Captiva ND, or OstroTM2 for high lipid loads that can be used in multi‐residue extractions.
Silicone constituents represent another challenging matrix for biota analysis, emerging with the recently increasing use of in‐tissue passive sampling (Jahnke et al. 2009; Allan et al. 2013; Rusina et al. 2017; Rojo‐Nieto et al. 2019). Silicone‐based passive sampling generates extracts much lower in matrix loads than traditional total solvent extraction (Jahnke et al. 2009; Jin et al. 2015). However, when using HRMS, despite thorough Soxhlet pre‐cleaning, extracting silicone with organic solvents resulted in the release of sorbed lipids (up to 1% of the silicone weight; Jahnke et al. 2008) and silicone oligomers (Rusina et al. 2007; Shahpoury and Hageman 2013) still causing matrix interference, hence threatening reliable, robust chemical analysis and instrument lifetime. The aforementioned size exclusion properties of the EMR‐Lipid sorbent could create the possibility of removing these silicone co‐extracts, while largely conserving the chemical mixtures.
In the present study, by utilizing GC‐HRMS we developed and validated a straightforward, robust, and reproducible cleanup method with acceptable recoveries for multiple and diverse compound classes. We selected 113 target chemicals covering pyrethroids, brominated diphenyl ethers (BDEs), polychlorinated biphenyls (PCBs), organochlorine pesticides (OCPs), substituted and nonsubstituted PAHs, musks, UV light filters, and antioxidants (log KOW [US Environmental Protection Agency 2000] ranging from 0.56 methyl phenyl sulfone to 12.26 alpha‐tocopherol acetate). In addition to the Oasis PRiME and EMR‐Lipid cartridges, we also tested the lipid freezing method, the so‐called “Freeze‐Out,” which can be adapted for small sample volumes and is widely used for the analysis of diverse chemicals in biota samples (Ahn et al. 2006; Shin et al. 2012; Desforges et al. 2017; Álvarez‐Ruiz and Picó 2020). These methods were first tested with spiked total extracts of lipid‐rich salmon to evaluate compound recoveries and removal of unwanted lipid matrix constituents (extractable organic matter as a surrogate for lipids). The best‐performing method was then evaluated further with total extracts and silicone‐based passive sampling extracts of spiked pork lipids. In addition to the compound recoveries and reduction of matrix effects, the method was also evaluated for the removal of silicone co‐extracts.
MATERIALS AND METHODS
Reagents and material
The >98% purity standards were purchased from Sigma Aldrich and Dr. Ehrenstorfer. Gas chromatography grade acetonitrile and GC‐MS grade ethyl acetate (EtAc), 2‐propanol, diethyl ether, n‐hexane, and NaCl were bought from Merck. The Oasis PRiME HLB cartridges (3 mL) were purchased from Waters, and the Captiva EMR‐Lipid cartridges (3 mL) came from Agilent. The standard solution of the 113 environmental contaminants was prepared at 0.5 ng/µL in EtAc and used as the spiking solution. The target chemicals were grouped according to their properties and/or usage into 8 categories for better visualization: 1) PCBs (n = 13); 2) BDEs (n = 6); 3) pyrethroids and the organophosphate Chlorpyrifos (pyrethroids—n = 15); 4) synthetic polycyclic musks, nitro musks, and musk‐like fragrances (musks—n = 10); 5) OCPs (n = 22); 6) PAHs (n = 25); 7) other industrial compounds including antioxidants, industrial precursors, intermediates, and UV filters such as Homosalate (others—n = 17); and 8) compounds having branched or unbranched aliphatic chains (LongChain—n = 5). Details of the analyzed target chemicals are given in Supplemental Data, Table S1.
Total extraction of salmon and pork lipids
Organic salmon was purchased at a local store and organic pork belly was obtained from a local butcher. The samples were refrigerated until homogenization using a Büchi mixer (B‐400). Then the lipids of the homogenates were extracted according to the modified Jensen II protocol (Jensen et al. 2003), a total extraction with a sequence of solvent mixtures. After evaporation to dryness, the weight of the lipids (as extractable organic matter) was determined gravimetrically and re‐dissolved in EtAc. Both salmon and pork lipids were tested in 2 different amounts: 10 or 50 mg for salmon lipids and 10 and 30 mg for pork lipids. The EtAc volume corresponding to the respective amount of lipids was pipetted into 2‐mL vials for processing by the lipid removal methods.
Sample preparation with silicone‐based passive sampling of pork lipid
The silicone sheets (SSP‐M823, 1‐mm thickness, polydimethylsiloxane; Specialty Silicone Products) were pre‐cleaned for 16 h with Soxhlet extraction using EtAc. Air‐dried silicone sheets (a total of 27.9 g) were brought into contact with the pork belly (~100 g). All silicone sheets were covered with the tissue, and the samples were wrapped in aluminum foil and refrigerated at 4 °C for 24 h. This sampling time is sufficient as shown for time series experiments in marine mammal blubber tissues where equilibrium was reached in less than 24 h with a time to reach 95% of equilibrium (t95) of 11.9 h (Reiter 2017). After equilibration, the silicone sheets were collected and their surfaces were thoroughly cleaned with Milli‐Q water and lint‐free tissues. The weight gain of each sheet was determined gravimetrically. The silicone sheets were extracted twice with EtAc (1 mL of solvent per 0.1 g of silicone). The extracts were evaporated to dryness and distributed into autosampler vials to yield approximately 10 mg lipid and 1 g silicone equivalent extract in each vial. In addition, 1‐g silicone blanks were also prepared using the same extraction method to evaluate the removal efficiency of the optimal cleanup method for silicone residuals.
Lipid cleanup methods and method optimization
Oasis PRiME cartridges (3 mL), EMR‐Lipid cartridges (3 mL), and Freeze‐Out (based on the precipitation of lipids at low temperatures) were tested with the salmon total extracts to find the optimal cleanup method in terms of recoveries of the multi‐class analytes and lipid removal efficiency. See Evaluation of recoveries in Materials and Methods section for details. Salmon fillet was chosen as test matrix due to its complexity and high fat content (Lucas and Zhao 2015). The influence of the amount of lipids on the cleanup methods was evaluated by their performance with 2 sets containing 10 or 50 mg lipids. Pre‐spiked and post‐spiked extracts were prepared in acetonitrile to facilitate lipid removal and to ensure the solubility of hydrophobic chemicals in the spiking mix (Lucas and Zhao 2015). Spiking mix of 2.5 ng (5 µL of 0.5 ng/µL) was pipetted to each extract (at different steps, referred to as pre‐spiked and post‐spiked, as shown in Figure 1). All experiments were conducted in triplicate; 3 pre‐spiked and 3 post‐spiked extracts were prepared for each method. In addition, method solvent blanks were prepared using only acetonitrile, and method matrix blanks were supplied for the tested lipid amounts for each method. The summary of the workflows for all 3 tested cleanup methods is given in Figure 1. A more detailed description can be found in Supplemental Data, Text S1.1 and Figure S1.
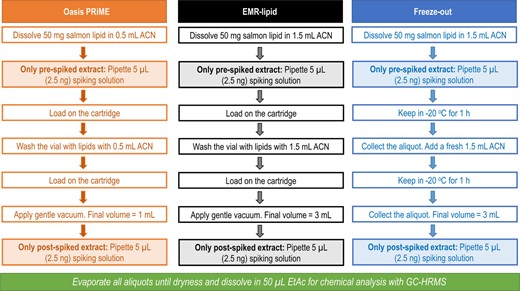
Workflow of the cleanup methods tested with 50 mg salmon lipids in the first step. All experiments were also performed with 10 mg salmon lipids, pre‐spiked (n = 3) and post‐spiked (n = 3) for each case. ACN = acetonitrile; EtAc = ethyl acetate; GC‐HRMS = gas chromatography–high‐resolution mass spectrometry.
Total lipid extracts of pork lipids were tested in amounts of 30 or 10 mg lipids, according to the same workflow used with salmon lipids (Figure 1). For silicone extracts of pork lipids, 1 g silicone equivalent with approximately 10 mg lipid and 1 g silicone equivalent without lipids were used to evaluate the cleanup operation efficiency. An overview of all experiments, each conducted in triplicate, is given in Supplemental Data, Figure S2.
Evaluation of recoveries
The recoveries were calculated according to Equation 1 by the ratios of average peak areas of each chemical in pre‐spiked (n = 3) and post‐spiked (n = 3) extracts for 50 or 10 mg (salmon) and 30 or 10 mg (pork) lipids. The effect of silicone on the method recoveries was evaluated using the ratio of average peak areas of each compound with 10 mg pork lipid + 1 g silicone (n = 3) and 10 mg pork lipid (n = 3) only.
Matrix effect evaluation
The matrix effects due to co‐extracted lipids and/or silicone co‐extracts were defined as deviations of the peak areas of the extracts with matrix from those without matrix (set as 100%) and were calculated in agreement with Equation 2 using the ratios of average peak areas of each chemical in post‐spiked extract containing matrix (n = 3) and post‐spiked matrix‐free solvent (n = 3). Values less than 100% indicate signal suppression and values higher than 100% show signal enhancement.
Removal of matrix constituents
The total matrix removal was evaluated gravimetrically by weighing the residuals with a Mettler‐Toledo micro analytical balance (model XPE26DR). The empty vials were desiccated overnight and weighed (n = 6 for each method, sample type and amount). After the cleanup, the extracts of remaining matrix in the vials were evaporated under a flow of nitrogen until constant weight was observed, and the vials were re‐weighed. The removal of co‐extracted matrix was calculated by Equation 3. In addition, these extracts were used as matrix blanks for chemical analysis.
Silicone co‐extract removal efficiency evaluated by peak area integration
The removal efficiency of silicone co‐extracts by the optimal method was evaluated comparing peak areas in the total ion chromatograms from GC‐HRMS analysis. Silicone blanks (n = 3) containing 1 g silicone equivalent dissolved in 1.5 mL acetonitrile were subjected to the optimal cleanup method. Additional silicone blanks (n = 3) were prepared in the same way but without applying any cleanup. The total peak areas were manually integrated and the percentage of reduction in the areas was calculated in accordance with Equation 4. In this experiment, solvent blanks served as controls to ensure that column bleeding did not interfere with the evaluation of the co‐extracts.
GC‐HRMS analysis
The GC‐HRMS analysis is described elsewhere (Muz et al. 2020; Niu et al. 2020), and further details are given in Supplemental Data, Text S1.2. Method detection limits (MDLs, given in Supplemental Data, LipidCleanUp_Supp2) were calculated using 10 mg pork lipid extract and 10 mg pork lipid + 1 g silicone equivalent extract spiked with standard solutions at 1, 10, and 100 ng/mL (n = 4 at each level and for each matrix). The MDLs of the optimal method were estimated using a two‐tailed t distribution test with a 99% confidence interval based on the US Environmental Protection Agency guidelines (2011). Quality assurance/quality control procedures were in place for that instrument and the analysis method, including standard operating procedures, trained technicians dedicated to the equipment, traceability (including analytical standards and reference materials whenever available), and are described in detail in Supplemental Data, Text S1.3.
RESULTS AND DISCUSSION
Analyte recoveries for Oasis PRiME, EMR‐Lipid, and Freeze‐Out
To evaluate the analyte recoveries of the 3 investigated cleanup methods, pre‐spiked and post‐spiked extracts of salmon lipids were prepared as described in Lipid cleanup methods and method optimization in the Materials and Methods section. All 3 methods were tested with 50 mg and 10 mg lipids to evaluate the effect of lipid amounts on the recoveries (see Analyte recoveries for Oasis PRiME, EMR‐Lipid, and Freeze‐Out in Results and Discussion section) and matrix effects (see Matrix effects by Oasis PRiME, EMR‐Lipid, and Freeze‐Out in Results and Discussion section). The analyte recoveries were calculated according to Equation 1. Furthermore, relative standard deviations (RSDs) of the replicates (n = 3) were calculated for each analyte in each sample. All results are given in Supplemental Data, LipidCleanUp_Supp2.
We evaluated the recoveries and matrix effects on a relative basis (see Equations 1–3) by comparing the quantified peak areas in the samples (see Supplemental Data, LipidCleanUp_Supp2). For 50 mg salmon lipids (±RSD; results for 10 mg are shown in parentheses) the average analyte recoveries were: 1) Oasis PRiME 10.8 ± 8.3% (8.3 ± 9.1%); 2) EMR‐Lipid 95.0 ± 6.8% (92.9 ± 8.7%); and 3) Freeze‐Out 97.4 ± 7.6% (103.1 ± 6.4%). Recoveries of analytes having an RSD >20% were considered unacceptable and therefore were not examined. The results for each analyte are given in Supplemental Data 2. The recoveries for the 3 methods using 50 mg and 10 mg salmon lipids are illustrated in Figure 2, and are given according to the compound classes with 50 mg and 10 mg salmon lipids using all 3 cleanup methods in Supplemental Data, Figures S3 and S4, respectively.
![Recoveries of the target compounds (n = 3) with the 3 cleanup methods using 50 mg and 10 mg salmon lipids. Target compounds are grouped according to compound classes (whiskers represent min and max values; small boxes denote outliers [1.5* interquartile range]; values not applicable and compounds with relative standard deviation (RSD) >20% are excluded from the image). BDEs = brominated diphenyl ethers; OCPs = organochlorine pesticides; PAHs = polycyclic aromatic hydrocarbons; PCBs = polychlorinated biphenyls.](https://oup.silverchair-cdn.com/oup/backfile/Content_public/Journal/etc/40/10/10.1002_etc.5153/3/m_etc5153-fig-0002-m.jpeg?Expires=1750206453&Signature=v0oM-OBiSVP5oZyJH6TM5ac0nWDJQA8aB-~i0XKO4BoifbExrAQIEZnD4aowkt75bJCEu2sSE2oTPCfHCryzKfuZETJ9STn7X6teyAb3HHR5WvhzLfG1BuwsNSnR3ryyS2YWi9CM8S~3xvcTETeCN0pWEbjdVAPUsnSed-PJghTTa-jvfkXVMyjjVp9fQ8u3gbQx7moPCGRkA8QnLrgpC0I2aVhDQ7~YajExkByZrP9VdcHFBhWxG3hsGNtnlevONownJR7oYfoDRKURvUYL0oQCECuhb8SXI-tnhlYc78zcOpM8JdDLD3s1wm~JOiSzbjgUyJpb3Xtn-J7qgRdZ1g__&Key-Pair-Id=APKAIE5G5CRDK6RD3PGA)
Recoveries of the target compounds (n = 3) with the 3 cleanup methods using 50 mg and 10 mg salmon lipids. Target compounds are grouped according to compound classes (whiskers represent min and max values; small boxes denote outliers [1.5* interquartile range]; values not applicable and compounds with relative standard deviation (RSD) >20% are excluded from the image). BDEs = brominated diphenyl ethers; OCPs = organochlorine pesticides; PAHs = polycyclic aromatic hydrocarbons; PCBs = polychlorinated biphenyls.
In general, the recoveries for EMR‐Lipid and Freeze‐Out were high. For EMR‐Lipid, among the 113 target compounds there were 100 compounds for 50 mg salmon lipid and 101 compounds for 10 mg salmon lipids that had acceptable recoveries between 70 and 120% (RSD < 20%). Seven compounds had RSDs > 20% with 50 mg lipids, whereas this was the case for 10 compounds with 10 mg lipids. The lowest and highest analyte recoveries (RSD < 20%) with EMR‐Lipid ranged between 29.7% (diphenylmethane) and 116% (cypermethrin) for 50 mg or 79.8% (PCB 209) and 117% (ambrettolide) for 10 mg lipids. Despite the fact that good recoveries were achieved, the efficiency of the method could be improved when the extracts were in aqueous acetonitrile because the water activation was reported to increase the effectiveness of the product to remove the lipids (Anumol et al. 2017). However, one should be aware that the solubility of some of the tested chemicals might decrease in aqueous solutions, which can also cause lower recoveries (Lucas and Zhao 2015).
For Freeze‐Out, 71 compounds with 50 mg and 92 compounds with 10 mg had recoveries in the range of 70 to 120% (RSD <20%). Thirteen compounds exceeded the acceptable range (highest calculated recovery of 163% for dibutylhydroxytoluene), and 8 compounds remained below 70% (lowest calculated recovery of 51.3% for BDE 99) with 50 mg lipids. For 10 mg lipids, 10 compounds exceeded 120% (highest calculated recovery of 189% for dibutylhydroxytoluene), whereas there were no compounds with a recovery lower than 70%. The lowest recovery was calculated for PCB 209 (74.9%). Ten compounds had RSDs >20% with 50 mg lipids, whereas this was the case for 5 compounds with 10 mg lipids.
Conversely, the Oasis PRiME cartridges delivered relatively poor recoveries for most target chemicals. This observation might result from loading the samples only in acetonitrile. Although the EMR‐Lipid method was reported to have been used only with acetonitrile to have better recoveries for more hydrophobic chemicals (Lucas and Zhao 2015; Anumol et al. 2017), this solvent has not been used for the Oasis PRiME cartridges. In the latter, the loaded extracts always contained water (Guo et al. 2018; Stubleski et al. 2018; Lu et al. 2019) or methanol (Hakme et al. 2018), usually with formic or acetic acid, even if after cleanup the extracts were analyzed with GC‐MS. However, this method was not used for our experiments because we aimed for a simple and reproducible cleanup method. Water (or water with acid) in the extracts would require an additional step for water (and acid) removal.
In regard to the 2 cleanup methods with acceptable recoveries in our experiments, for 50 mg lipids no significant differences were observed in most of the cases (except for BDEs, musks, and others) by comparing the average recovery per compound group and the overlap of confidence intervals for EMR‐Lipid and Freeze‐Out. Nevertheless, in the case of 10 mg lipids, this comparison indicated significant differences for BDEs, pyrethroids, musks, OCPs, PAHs, and others. The recoveries of brominated compounds were more consistent with EMR‐Lipid, whereas with 50 mg lipid some brominated compounds were not recovered (not detected) with the Freeze‐Out method. Moreover, pyrethroids had high RSDs with Freeze‐Out for 50 mg lipids, thus making the method unsuitable for these compounds. The recoveries of OCPs were on average 99.3% for 50 mg and 91.7% for 10 mg with EMR‐Lipid, whereas with Freeze‐Out several OCPs could not be detected, thus no recoveries could be determined. The musk compounds cashmeran and ambrettolide could not be quantified in some of the extracts due to high background signals in the matrix blanks. Compounds in the LongChain group showed good recoveries with both methods except for dioctyl diphenylamine; RSDs for this compound were >20% with EMR‐Lipid. The other compounds in the LongChain group had branched aliphatic chains. The long, unbranched aliphatic chains of these compounds might have similar interactions with the sorbent as fatty acids; hence, it can be expected that this method might not be suitable for compounds with such structures and/or properties.
Matrix effects by Oasis PriME, EMR‐Lipid, and Freeze‐Out
The quantitative matrix effects of all 3 methods were evaluated using analyte responses in post‐spiked matrix samples with different amounts of lipids compared with post‐spiked solvents, according to Equation 2. Values <100% indicate signal suppression, whereas values >100% show signal enhancement. Results are given in Supplemental Data, LipidCleanUp_Supp2.
For 50 mg salmon lipids (±RSD; results for 10 mg are shown in parentheses) the average deviation from 100% due to matrix effects indicated: 1) substantial (10 mg, slight) signal suppression for Oasis PRiME (59.1 ± 5.2% [10 mg, 93.4 ± 4.8%]); 2) slight signal enhancement for EMR‐Lipid (106 ± 4.2% [10 mg, 108 ± 4.3%]); and 3) substantial (10 mg, slight) signal suppression for Freeze‐Out (63.0 ± 3.4% [10 mg, 90.7 ± 3.4%]). Hence, the data indicate that signal suppression for Oasis PriME and Freeze‐Out was more explicit for higher lipid amounts. Matrix effects of analytes having an RSD >20% were considered unacceptable and were not included in the data analysis. The results for each analyte are listed in Supplemental Data 2. An overview of the signal suppression or enhancements due to matrix effects for the 3 methods using 50 and 10 mg salmon lipids is given in Figure 3.
![Deviation from 100% due to matrix effects of the target compounds (n = 3, signal suppression for data <100%, signal enhancement for data >100%) with the 3 cleanup methods using 50 mg and 10 mg salmon lipids are grouped according to compound classes (whiskers represent min and max values; small boxes depict outliers [1.5* interquartile range]; values not applicable, compounds with an RSD >20%, and values >200% are not included in the image). Horizontal line indicates no matrix effect and shaded area represents acceptable values of 70 to 120%. See Figure 2 legend for acronym definitions.](https://oup.silverchair-cdn.com/oup/backfile/Content_public/Journal/etc/40/10/10.1002_etc.5153/3/m_etc5153-fig-0003-m.jpeg?Expires=1750206453&Signature=KSEoRSg1xTksF37EA8PMjx-bWqk8fjtWO~56PSUm4cBIYWh8DddywBnp4SqNl6OF1F7916TaSWfVmOluZXQLJ~EO6Bmozt9Ccp9ncODHOYERx9DGmONWEI6m~BaqmtaST6GnOFczcWJcXviqNNnIh7HXpyWlK4SawT4DF8s~9Ydikwx6Y4giFZIQD2Q9PQOESYUDTE~rL5eEMA8toPBMMMUmPEE8d2I49WsTYbCRbHl~nZibcz1jdCbg6NN4GVdaLr57YSUXz4tlMY7ncQA8-iGC2JXeXv0D-u-HmEwxp6Ajrbh-fYBzFUi-wMEheORGvWGhSMZbpZbeix9PbiMn7Q__&Key-Pair-Id=APKAIE5G5CRDK6RD3PGA)
Deviation from 100% due to matrix effects of the target compounds (n = 3, signal suppression for data <100%, signal enhancement for data >100%) with the 3 cleanup methods using 50 mg and 10 mg salmon lipids are grouped according to compound classes (whiskers represent min and max values; small boxes depict outliers [1.5* interquartile range]; values not applicable, compounds with an RSD >20%, and values >200% are not included in the image). Horizontal line indicates no matrix effect and shaded area represents acceptable values of 70 to 120%. See Figure 2 legend for acronym definitions.
In our experiments, EMR‐Lipid achieved the best results in reducing matrix effects with both amounts of salmon lipids. Compounds with an acceptable signal suppression/enhancement were judged to be those showing values between 70 to 120% with an RSD < 20%. The 3 cleanup methods performed as follows: with 1) Oasis PRiME 44 and 74 compounds, 2) EMR‐Lipid 88 and 78 compounds, and 3) Freeze‐Out 24 and 39 compounds were within 70 to 120% with an RSD < 20% for 50 and 10 mg lipids, respectively. For EMR‐Lipid and 50 mg lipids, 7 compounds showed substantial signal enhancement, that is, matrix effects higher than 120% in (RSD < 20%). Among these, cyclopenta[cd]pyrene and dioctyl diphenylamine had values higher than 200%. With 10 mg lipids, 19 compounds showed substantial signal enhancement. Among these, cyclopenta[cd]pyrene, benzo[a]pyrene, and 3‐bromocarbazole were higher than 200%. The highest signal suppression was observed for PCB 209 (27.1%) with 50 mg lipids and for endrin aldehyde (19.2%) with 10 mg lipids.
Although for the recoveries (see Analyte recoveries for Oasis PRiME, EMR‐Lipid, and Freeze‐Out in the Results and Discussion section) Freeze‐Out performed similarly as well as EMR‐Lipid, this was not the case for the reduction of matrix effects. The average signal suppression due to matrix effects of all target compounds with 50 mg lipids using the Freeze‐Out method was substantial (on average 63.0%; 10 mg was within an acceptable range of 90.7%). Further details can be found in Supplemental Data, Text S2.1, including details about the specific compounds and compound classes with particularly high signal suppression or enhancement. The determination of matrix residue removal by weight did not show substantial differences among the methods, as given in Supplemental Data, Table S2. Judging by weight, all 3 cleanup methods were successful in removing the unwanted matrix co‐extracts, with Freeze‐Out showing slightly less efficient matrix removal. The similarity in these gravimetric matrix reduction values across the 3 cleanup methods, however, was not reflected in the chromatographic matrix effects that showed explicit differences (Figure 3). A possible explanation for this discrepancy may be method‐specific differences in their ability to remove different types of matrix constituents, hence, resulting in similar weight removal but differing effects on the ionization efficiency of the target chemicals.
Evaluating the overall performance of all 3 tested methods in terms of recoveries (see Analyte recoveries for Oasis PRiME, EMR‐Lipid, and Freeze‐Out in the Results and Discussion section) and reduction of matrix effects (see Matrix effects by Oasis PRiME, EMR‐Lipid, and Freeze‐Out in the Results and Discussion section), we concluded that EMR‐Lipid cartridges were the optimal method for samples of lipid‐rich biota. They provided high and reproducible recoveries for a broad range of environmental micropollutants while showing an acceptable performance in removing matrix effects, thus promoting instrumental performance (e.g., limiting chromatographic issues and maintenance needs) and hence lifetime. They also performed successfully in removing the solid matrix co‐extracts (Supplemental Data, Table S2). Consequently, for the follow‐up experiments with pork lipids and silicone, we tested only the EMR‐Lipid cartridges.
Analyte recoveries with EMR‐Lipid for total and silicone‐based extraction of pork lipids
Given that the experiments with spiked salmon lipids showed similar results for 50 mg and 10 mg of lipids and that frequently sample volumes are limited, for the follow‐up experiments we used pre‐spiked and post‐spiked: 1) pork lipid extracts in amounts of 30 mg and 10 mg, 2) approximately 1 g silicone with approximately 10 mg extracted pork lipids added, and 3) approximately 1 g silicone equivalent (without lipids) as described in Lipid cleanup methods and method optimization in the Materials and Methods section. The recoveries for each analyte, including RSDs, were determined and calculated according to Equation 1. For the silicone‐based passive sampling of pork lipids, a total weight gain of approximately 0.8% of the silicone was recorded. This was mainly caused by lipid sorption to the silicone (corresponding to 9 mg), in accordance with previous studies (Jahnke et al. 2008), and to a lesser extent by silicone residuals (corresponding to 0.7 mg). However, for consistency within the present study, we refer to these extracts as 10 mg pork lipids +1 g silicone equivalent.
The recoveries for all target chemicals (detailed in Supplemental Data, LipidCleanUp_Supp2) were on average (±RSD) for: 1) total extraction 99.7 ± 9.3% for 30 mg pork lipids and 93.4 ± 9.7% for 10 mg pork lipids, 2) silicone‐based extraction 86.1 ± 11.8% (10 mg pork lipids +1 g silicone equivalent), and 3) silicone only 80.3 ± 13.4% (1 g silicone equivalent). Recoveries of analytes with an RSD >20% were not considered. The results for each analyte are given in Supplemental Data 2. The recoveries per compound class with different tested lipid and/or silicone amounts are given in Figure 4. A different type of plot showing the recoveries of the target compounds versus diverse tested lipid and/or silicone amounts is shown in Supplemental Data, Figure S5.
![Recoveries of target compounds (n = 3) using EMR‐Lipid cartridges with different lipid and/or silicone amounts are grouped according to compound classes (whiskers represent min and max values; small boxes identify outliers [1.5* interquartile range]; values not applicable and compounds with an RSD > 20% are excluded from the image). See Figure 2 legend for acronym definitions.](https://oup.silverchair-cdn.com/oup/backfile/Content_public/Journal/etc/40/10/10.1002_etc.5153/3/m_etc5153-fig-0004-m.jpeg?Expires=1750206453&Signature=eBnY6rp7GzAFe1ZUdhwO6EhIYvte5TcL0glOJk2YmlRuG4vcpdsb7feFUuYUjlKPjCh4-VyjK5kaq3FMTkNQugtIFSKDAoCkrp5fC3b0Fwy6ZwKfuQsQg6VSgfb3ku4zZcmGjqGPE8fi9BdlDUrOeog9lOEpb6AkUTAePi63AOMw4zWyYzjDmrXvtDvXmfiu1zF~q-J~6zrYSjBos8v~puS3VZB90W8F8S8pvIZ7kD-EW4yUijsHuyCTvP5FY-yu9gVs7GE2haBgqEx9X~QXqll~5BmH4yiGiGFDF--uWt4ZkcwKm3cEu6uJ3Mx5AZtEBSG-CBWxxIBFfqFQeLZIgg__&Key-Pair-Id=APKAIE5G5CRDK6RD3PGA)
Recoveries of target compounds (n = 3) using EMR‐Lipid cartridges with different lipid and/or silicone amounts are grouped according to compound classes (whiskers represent min and max values; small boxes identify outliers [1.5* interquartile range]; values not applicable and compounds with an RSD > 20% are excluded from the image). See Figure 2 legend for acronym definitions.
Among the 113 target chemicals, 97 and 96 had acceptable recoveries (between 70–120%; RSD < 20%) with 30 and 10 mg pork lipids, respectively. With 30 mg pork lipids, the lowest recovery was observed for prallethrin (39.5%), whereas 3‐bromocarbazole showed the lowest recovery (44.9%) for 10 mg pork lipids. Six and 8 compounds had RSDs > 20% for 30 and 10 mg pork lipids, respectively. An effect of the presence of silicone residuals on the recoveries was clearly observed. In the group of target compounds, only 82 and 68 had acceptable recoveries (70–120%; RSD < 20%) with 10 mg pork lipids +1 g silicone equivalent and 1 g silicone equivalent, respectively. When silicone and lipids co‐occurred, the recoveries of the OCPs were severely impaired; of the 22 compounds belonging to this group, only 8 had acceptable recoveries and 10 compounds showed RSDs >20%; endrin and endrin aldehyde were completely lost (not detected). Recovery variability was higher for 11 compounds showing RSDs >20% with 1 g silicone equivalent rather than when occurring together with lipids.
Method detection limits were calculated for all 113 target chemicals as described in GC‐HRMS analysis in the Materials and Methods section. With 10 mg pork lipids the MDLs were between 5.0 and 375 ng/g lipids, whereas with 10 mg pork lipids +1 g silicone equivalent the MDLs ranged from 5.0 to 466 ng/g lipids. In both matrices, endrin aldehyde had the highest calculated MDL. The number of compounds that showed MDLs in the ranges 5 ng/g lipids, 5 to 10 ng/g lipids, or >50 ng/g lipids is provided in Supplemental Data, Figure S6. Calculated MDLs for each chemical with both matrices using EMR‐Lipid cleanup are included in Supplemental Data 2.
Matrix effects with EMR‐Lipid for total and silicone‐based extraction of pork lipids
In the present study, the pork lipids caused substantially stronger matrix effects than the salmon lipids for unknown reasons. The average matrix effect for all compounds indicated only minor signal suppression or enhancement; it was approximately 100% with 93 ± 9.5% (±RSD) for 30 mg and 112 ± 10.5% for 10 mg pork lipids, respectively. However, the number of compounds with an acceptable signal suppression or enhancement, that is, having matrix effect values between 70 and 120% with an RSD <20% was lower: 1) 59 or 64 with 30 or 10 mg of pork lipids, 2) 33 with 10 mg pork lipids +1 g silicone equivalent, and 3) 58 with 1 g silicone equivalent. Pork lipids caused substantial ion suppression (matrix effect <70%) for PCBs; 8 out of 13 compounds were in this range, mostly for PCBs with 5 and more chlorine atoms. Also, high ion suppression was observed for the BDE compound class, with an average matrix effect of 58% with 30 mg pork lipids. The ion suppression was more severe when the matrix consisted of pork lipids together with silicone co‐extracts. Not only PCBs and BDEs but also the compound classes of pyrethroids, OCPs and PAHs showed substantial signal suppression due to the challenging matrix constituents (on average 77, 60, and 78%, respectively, with 10 mg pork lipid +1 g silicone equivalent).
More compounds showed signal enhancement (matrix effect >100%) with pork lipids than with salmon lipids. The signal enhancement of the musk compounds was pronounced with both amounts of pork lipids and silicone‐based sampling of pork lipids. Furthermore, the PAHs anthracene and phenanthrene had values >200% for 30 mg and 10 mg of pork lipids. Finally, many compounds in the “others” group—including the UV filter homosalate, the intermediate ethylene glycol diphenyl ether, and the plant growth regulator 2,6‐diisopropylnapthalene—showed substantial signal enhancement. The results for each analyte appear in Supplemental Data 2. The deviation from 100% due to matrix effects for each compound class with different tested matrices is illustrated in Figure 5.
![Deviation from 100% recovery due to matrix effects for the target compounds (n = 3) using EMR‐Lipid cartridges with different tested lipid and/or silicone amounts are grouped according to compound classes (whiskers represent min and max values; small boxes show outliers [1.5* interquartile range]; values not applicable, values >200%, and compounds with an RSD > 20% are excluded from the image). Values <100% denote signal suppression, whereas values >100% indicate signal enhancement. Horizontal line represents no matrix effect and shaded area displays acceptable signal suppression (70–100%) or signal enhancement (100–120%). See Figure 2 legend for acronym definitions.](https://oup.silverchair-cdn.com/oup/backfile/Content_public/Journal/etc/40/10/10.1002_etc.5153/3/m_etc5153-fig-0005-m.jpeg?Expires=1750206453&Signature=QZlutKP5p7JMxlsgnSAxG7zeWekuubliGmvjsTYnkIkoQYSEAGhl58NtvNwuh4t3wEPLV-SC8KDgSiCL7ij9~L2eqy5OPykfMISI60oEUp-clZDSA~QGHiif3ibxP4~Z54qCoQFl41-x9LJV4agXGAzWqlZU9WNZRqjhRVoRzMxsss9nBkU~Sdyup0JwfUsF0CrHOtZEyvWd~TxT4lzI~3xEFYvzt604Qddjp5uvuLGE86VK-6cNfqNIhI2gs3InBvLI0XG7bIKS2~KXI4n4HV4svcFhNup98jGxQTZd7nknT5ZrW7At8hhCpUNrYVIVwu9DCgxJlqnI8OHnlsND8w__&Key-Pair-Id=APKAIE5G5CRDK6RD3PGA)
Deviation from 100% recovery due to matrix effects for the target compounds (n = 3) using EMR‐Lipid cartridges with different tested lipid and/or silicone amounts are grouped according to compound classes (whiskers represent min and max values; small boxes show outliers [1.5* interquartile range]; values not applicable, values >200%, and compounds with an RSD > 20% are excluded from the image). Values <100% denote signal suppression, whereas values >100% indicate signal enhancement. Horizontal line represents no matrix effect and shaded area displays acceptable signal suppression (70–100%) or signal enhancement (100–120%). See Figure 2 legend for acronym definitions.
Similarly, as observed for salmon lipids, high matrix residue removal efficiencies were found for different amounts of pork lipids with EMR‐Lipid cartridges. Although the efficiency was slightly lower for extracts containing both lipids and silicone residues, the cartridges, in addition to removing lipids, were shown to remove unwanted silicone co‐extracts to some extent; to the best of our knowledge, this has not been reported before. The summary of the percentage of matrix residue removal by weight for 30 and 10 mg pork lipids, 10 mg pork lipids +1 g silicone equivalent, and 1 g silicone equivalent is given in Supplemental Data, Table S3; more details are provided in Supplemental Data, LipidCleanUp_Supp2.
Silicone co‐extract removal by EMR‐Lipid evaluated by peak area integration
The performance of EMR‐Lipid cartridges in removing the unwanted silicone co‐extracts was additionally evaluated by comparing the integrated peak areas in the total ion chromatograms of silicone blanks with and without cleanup. The respective full scan GC‐HRMS chromatograms are represented in Figure 6. The total integrated peak areas indicated that 74% of silicone co‐extracts were efficiently removed by EMR‐Lipid. Moreover, integrated peak areas of single peaks were compared one‐by‐one. The spectra of the peaks were searched in the National Institute of Standards & Technology Library (NIST) for tentative identification of siloxanes. The results showed that the cartridges were effective in removing the linear siloxanes such as hexadecamethyl, heptasiloxane, and hexadecamethyl octasiloxane that elute at later retention times (>28 min). However, the cyclic siloxanes such as octadecamethyl‐cyclononasiloxane and eicosamethyl‐cyclodecasiloxane (retention times 11–28 min) were not effectively removed. These observations are in line with the reported size exclusion properties of EMR‐Lipid: molecules with long chains (such as lipids), thus presenting elongated structures, enter the sorbent pores, whereas bulky chemicals are not retained. The full‐scan total ion chromatograms of the silicone blanks with and without cleanup and the total ion chromatogram of a solvent blank are shown in Supplemental Data, Figure S7. The percentage of removal in peak areas for single peaks is given in Supplemental Data, Table S4.
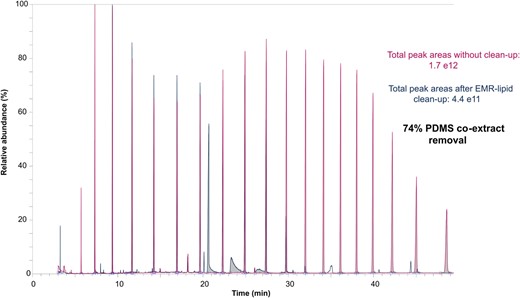
Total ion chromatograms of full‐scan GC‐HRMS analysis of silicone blanks with and without cleanup with EMR‐Lipid cartridges. PDMS = polydimethylsiloxane.
CONCLUSION
The EMR‐Lipid cartridges proved to be more efficient than Oasis PriME and Freeze‐Out in removing co‐extracted lipids, providing high recoveries of the multiple and diverse target chemicals with a broad range of properties (on average 89%. and 85%, without and with the presence of co‐extracted silicone, respectively). At the same time, EMR‐Lipid yielded less explicit matrix‐related signal suppression or enhancement in GC‐HRMS analysis. As the optimal method, EMR‐Lipid was further tested with 2 other challenging matrices: total extracts and silicone‐based extracts of pork lipids. The size exclusion properties of EMR‐Lipid were tested for their removal efficiency of co‐extracted lipids and silicone residuals, and good performance was achieved with both matrices. With respect to remaining silicone co‐extract interferences, changes in the extraction step (e.g., switching extraction solvents) could be considered to prevent their co‐extraction; however, balance needs to be kept to co‐extract less silicone constituents without severely limiting extraction efficiencies of the target analytes. The present study introduces the possibility of largely removing matrix constituents consisting of: 1) lipids, and 2) silicone oligomers using EMR‐Lipid cartridges in sample preparation for chemical analysis of a wide range of compounds with extremely diverse physicochemical properties. However, for some compound groups, the remaining signal suppression can imply a challenge for quantification―particularly at low concentrations. Further steps, such as combining the suggested method with an additional cleanup step (e.g., dispersive solid‐phase extraction), should thus be evaluated in those specific cases.
Supplemental Data
The Supplemental Data are available on the Wiley Online Library at https://doi.org/10.1002/etc.5153.
Acknowledgment
The present study was partially supported by a grant from the European Research Council under the European Union's Horizon 2020 research and innovation programme (715173, CHEMO‐RISK). The authors thank M. Krauss for all his helpful advice and comments; we are grateful to J. Watzke and F. Rosello Jimenez for their assistance with sample preparation; and we are indebted to E. Reiter for valuable comments on the preparation of silicone extracts. We acknowledge the insightful comments of our anonymous reviewers and the editor that greatly helped to improve the manuscript. The analytical instrument used in the present study is part of the major infrastructure initiative Chemicals in the Terrestrial Environment Profiler funded by the Helmholtz Association.
Author Contributions Statement
M. Muz, E. Rojo‐Nieto, and A. Jahnke conceived and designed the experiments. M. Muz performed the experiments together with E. Rojo‐Nieto. M. Muz performed chemical analysis, evaluated the data, and wrote the manuscript. A. Jahnke and E. Rojo‐Nieto edited and revised the manuscript.
Data Availability Statement
Data, associated metadata, and calculation tools are available from the corresponding author ([email protected]).
