


Abstract
Shiga toxin–producing Escherichia coli are pathogenic bacteria found in the gastrointestinal tract of humans. Severe infections could lead to life-threatening complications, especially in young children and the elderly. Understanding the distribution of the incubation period, which is currently inconsistent and ambiguous, can help in controlling the burden of disease. We conducted a systematic review of outbreak investigation reports, extracted individual incubation data and summary estimates, tested for heterogeneity, classified studies into subgroups with limited heterogeneity, and undertook a meta-analysis to identify factors that may contribute to the distribution of the pathogen’s incubation period. Twenty-eight studies were identified for inclusion in the review (1 of which included information on 2 outbreaks), and the resulting I2 value was 77%, indicating high heterogeneity. Studies were classified into 5 subgroups, with the mean incubation period ranging from 3.5 to 8.1 days. The length of the incubation period increased with patient age and decreased by 7.2 hours with every 10% increase in attack rate.
Abbreviations
INTRODUCTION
Shiga toxin-producing Escherichia coli (STEC) is a pathogenic form of the E. coli bacterium. STEC is common and benign in many organisms, but usually causes illness in humans (1). Symptoms generally include severe stomach cramps; profuse, often bloody diarrhea; and vomiting (2). Symptoms could last between 5 and 7 days (3); however, severe infections can be life threatening and result in complications (2). A common complication of STEC infection is hemolytic uremic syndrome (HUS), which affects 5%–10% of ill persons (1, 3).
There are several disease-causing STEC serogroups, but the most common is STEC O157 (4, 5). Its reservoir is mainly cattle (6) and it is transmitted to humans through consumption of contaminated foods, fecal-oral transmission, or cross contamination (5). Other STEC serotypes are collectively called non-O157 STEC. Numerous non-O157 strains have been identified; however, the most common serogroups associated with disease include O111, O26, O45, O103, and O145 (7, 8).
Globally, STEC is estimated to cause nearly 3 million cases annually, leading to approximately 200 deaths (9). Most reported cases of STEC O157 are sporadic (10), but because of the low infectious dose required for infection to occur (10), there is the potential for large outbreaks (11). There are relatively fewer cases of non-O157 and, likewise, non–O157-related outbreaks are rare; however, large outbreaks have also been reported (12).
Incubation period is the time between exposure to the infecting pathogen and onset of clinical symptoms. Accurate knowledge of the distribution of incubation period is necessary to understand its epidemiology and is useful in outbreak investigations and distinguishing between primary and secondary cases, which is an important factor in STEC epidemiology because person-to-person transmission can occur. (11). In an outbreak investigation, when the date of exposure is unknown, accurate knowledge of the incubation-period distribution can help identify the potential source of contamination.
Modified PICO Element in the Systematic Review of Studies Between 1984 and 2012
| PICO Elements | Components |
|---|---|
| Population studies/participants | Cases of STEC in a laboratory-confirmed point-source exposure outbreak or continuous source outbreak for which dates of exposure and onset are known for each case |
| Individual case laboratory confirmation was not required within each outbreak when cases met a clinical and epidemiological case definition. | |
| Infectious agent | Shiga toxin–producing Escherichia coli |
| Comparator | Host factors and outbreak characteristics: food vehicle and level of contamination or dose |
| Clinical characteristics such as HUS and bloody diarrhea | |
| Microbiological characteristics such as serotype and toxin type | |
| Outcome | Time from exposure to onset of clinical illness as described or defined by the reporting authors and including diarrhea, bloody diarrhea, abdominal pain, vomiting, HUS |
Abbreviations: HUS, hemolytic uremic syndrome; PICO, Population studies, Infectious Agent, Comparator and Outcome; STEC, Shiga toxin–producing Escherichia coli.
| PICO Elements | Components |
|---|---|
| Population studies/participants | Cases of STEC in a laboratory-confirmed point-source exposure outbreak or continuous source outbreak for which dates of exposure and onset are known for each case |
| Individual case laboratory confirmation was not required within each outbreak when cases met a clinical and epidemiological case definition. | |
| Infectious agent | Shiga toxin–producing Escherichia coli |
| Comparator | Host factors and outbreak characteristics: food vehicle and level of contamination or dose |
| Clinical characteristics such as HUS and bloody diarrhea | |
| Microbiological characteristics such as serotype and toxin type | |
| Outcome | Time from exposure to onset of clinical illness as described or defined by the reporting authors and including diarrhea, bloody diarrhea, abdominal pain, vomiting, HUS |
Abbreviations: HUS, hemolytic uremic syndrome; PICO, Population studies, Infectious Agent, Comparator and Outcome; STEC, Shiga toxin–producing Escherichia coli.
There are several conflicting reports on the incubation-period distribution of STEC. The World Health Organization reports a range of 3–8 days (1), the US Centers for Disease Control and Prevention report 3–4 days after exposure (3), and in a few notable outbreaks, unexpectedly long incubation periods have been reported (13, 14). Because of the ambiguity around the incubation-period distribution of STEC, researchers have used other methods to identify the time of exposure in outbreak investigations (15).
To describe the incubation-period distribution of STEC, examine the ambiguity of the reported incubation period, and identify possible influencing factors, we conducted a systematic review of published and gray literature in which the incubation period of STEC in exposed populations was reported. We extracted reported individual patient incubation data and summary estimates and undertook meta-analysis and meta-regression of the extracted data. We tested for the presence of heterogeneity and attempted to explain observed variation by identifying influencing factors.
METHODS
To extract data on incubation period, we undertook a systematic literature review of observational studies with known point sources. These data were assessed for the presence of heterogeneity, and subgroups with limited evidence of heterogeneity between them were identified. We conducted a meta-regression to identify factors that influence the incubation-period distribution. More complete details on methods we used have been published (16).
Research questions and modified population studies, infectious agent, comparator and outcome elements
We had 2 research questions: 1) What is the distribution of the incubation period of STEC infections in humans and 2) what factors affect the incubation period? The modified population studies, infectious agent, comparator, and outcome (i.e., the PICO model) elements and associated components are listed in Table 1.
Search strategy
A systematic literature search for peer-reviewed publications and gray literature reports of observational and experimental studies reporting incubation period was conducted in bibliographic databases (namely, PubMed and Scopus) and Google Scholar. A customized gray literature search of the Centers for Disease Control and Prevention (www.cdc.gov), World Health Organization (www.who.int), and OpenGray (www.opengrey.eu) websites and open Google search (screening only the first 50 items) was undertaken using combinations of search terms (Web Table 1) (available at https://dbpia.nl.go.kr/aje). All searches were carried out from June 5, 2017, to July 3, 2017. There was no restriction on the dates or language of articles returned. The reference lists of identified review papers were also screened to find other relevant studies in which incubation period of STEC may have been reported.
Selection process
After likely relevant articles were identified from the literature review, each article went through a selection process and quality assessment, the steps of which were described previously (16).
Data extraction
Data were extracted from all included studies according to a predetermined form (Web Table 2). When available, individual incubation-period data were extracted from text and tables. Where an epidemic curve was provided, the raw incubation-period data were extracted using the online tool WebPlotDigitizer (17). Summary data, such as the mean, median, and mode, were also extracted or calculated from the raw data where necessary. Raw data were used in the test for heterogeneity and the subgroup analysis. The summary data were used in the meta-regression analysis, because explanatory variables were only available for outbreaks, not individuals. The unit of incubation data reported and extracted was days. For point-source outbreaks, or outbreaks with continuous exposures, during which the total number of people exposed was observed and reported, the attack rate was determined.
Descriptive analyses
The extracted data were summarized according to the reported characteristics. Frequencies and percentages were calculated for year of study, study design, geographical region of study, serotype, toxin type, mode of transmission, and food vehicle, where applicable.
The extracted, individual incubation-period data were used to plot histograms of the incubation periods and re-create the epidemic curves of the outbreaks. The epidemic curves were plotted on a uniform x-axis representing the incubation period from 1 to 20 days and an individual y-axis indicating the number of cases in each outbreak.
Statistical analyses
We tested for the presence of heterogeneity using the individual incubation data, and the pattern of heterogeneity was investigated. We also identified factors that may explain heterogeneity, using the summary statistics and available outbreak characteristics. Statistical analyses were done using the statistical software R, version 3.2.3 (R Foundation for Statistical Computing, Vienna, Austria ), “Wooden Christmas Tree” (18).
Testing for heterogeneity.
Using the available individual data extracted from the studies, the test for heterogeneity was done by calculating the value of the heterogeneity statistic, I2, and performing a 2-sample Kolmogorov-Smirnov test to compare the cumulative distributions between studies. We applied a bootstrapped version of the test with 10,000 samples to derive P values that would provide improved coverage, given the compared data are discretized at the point of reporting (16).
Identifying factors that explain heterogeneity.
To examine the relationship between the outbreak characteristics and the mean incubation period, we performed a linear regression analysis. We fitted a generalized linear model, with a γ family function and a link identity, to account for the skewness of data. The mean incubation period was the dependent variable and the outbreak or host characteristics were the explanatory variables. The association of the explanatory variables with the mean incubation period was examined first using a univariate model and then by building a multivariable model with variables that had a significant association (P < 0.05) to test for confounding.
Identifying subgroups.
After confirming heterogeneity, we explored the data according to subgroups. Using the P values of the bootstrapped Kolmogorov-Smirnov test, we conducted a hierarchical cluster analysis to produce a graphical representation of the dissimilarity matrix among the studies (16).
Subgroup analyses
The individual incubation data of studies in a subgroup were collated and summary statistics and outcome measures were derived for each subgroup. A forest plot was created to show the distribution of the mean incubation period and the corresponding 95% confidence interval for studies with individual incubation data.
Risk of bias
Our data were tested for small-study effect by creating a funnel plot that graphically represented the relationship between sample size and incubation period.
RESULTS
Search strategy and selection process
A total of 1,980 unique articles were retrieved from both bibliographic databases, 840 from Google Scholar and 1,279 articles were identified from the gray literature search. After screening for relevance and removing duplicates identified from all 3 sources, 2,059 articles were excluded (Figure 1). An additional 26 articles were identified from searching through reference lists of relevant review papers, resulting in 2,066 articles for additional screening. Excluding articles that did not report incubation period resulted in 42 articles for full-text review and eligibility screening. Another 14 articles were excluded because they did not meet the eligibility criteria (Web Table 3), resulting in 28 articles for inclusion and data extraction, 1 of which reported 2 outbreaks (Web Table 4). All the included studies were outbreak reports, and 22 of these reported individual incubation-period data available for extraction. Some outbreaks were part of larger outbreaks. Three outbreaks (19–21) within the German O104 outbreak, for which incubation time could be extracted, were included. It was not possible to include all cases in the 2011 German outbreak, because incubation time was not known, due to uncertain date of exposure.
Flowchart of study selection process.

Descriptive analyses
Of the 29 total outbreaks reported on in the 28 studies included in our review, 75.9% (n = 22 of 29) were of serotype O157. In all but 1 of the studies, the onset of either bloody diarrhea or HUS was reported. Bloody diarrhea alone or HUS alone was reported from 9 outbreaks (31%); in 10 outbreaks (34.5%), both HUS and bloody diarrhea were reported (Table 2).
Characteristics of Included Outbreaks in the Systematic Review of STEC Between 1984 and 2012
| Variables | No. of Outbreaks | Proportion |
|---|---|---|
| Total no. of outbreaks | 29 | |
| Year of study | ||
| Before year 2000 | 16 | 55.2 |
| 2000 and later | 13 | 44.8 |
| Study design | ||
| Case-control | 9 | 31.0 |
| Case | 1 | 3.4 |
| Cohort | 14 | 48.3 |
| Descriptive | 5 | 17.2 |
| Age group | ||
| Children | 15 | 51.7 |
| Adults | 13 | 44.8 |
| Mixed | 0 | 0.0 |
| Unknown | 1 | 3.4 |
| Region of study | ||
| Europe | 16 | 55.2 |
| North America | 8 | 27.6 |
| Asia | 5 | 17.2 |
| Serotype | ||
| O157 | 22 | 75.9 |
| O104 | 4 | 13.8 |
| O127 | 1 | 3.4 |
| O145 and O26 | 1 | 3.4 |
| O103 | 1 | 3.4 |
| Toxin type | ||
| VT1 and VT2 | 9 | 31.0 |
| VT2 alone | 8 | 27.6 |
| VT1 alone | 3 | 10.3 |
| Unknown | 9 | 31.0 |
| Clinical outcome | ||
| Bloody diarrhea | 9 | 31.0 |
| HUS alone | 9 | 31.0 |
| Both | 10 | 34.5 |
| Unknown | 1 | 3.4 |
| Foodborne transmission | 20 | 69.0 |
| Private party | 8 | 40.0 |
| Nursing homes | 4 | 20.0 |
| School | 4 | 20.0 |
| Community | 1 | 5.0 |
| Farm visit | 1 | 5.0 |
| Restaurant | 2 | 10.0 |
Table continues
| Variables | No. of Outbreaks | Proportion |
|---|---|---|
| Total no. of outbreaks | 29 | |
| Year of study | ||
| Before year 2000 | 16 | 55.2 |
| 2000 and later | 13 | 44.8 |
| Study design | ||
| Case-control | 9 | 31.0 |
| Case | 1 | 3.4 |
| Cohort | 14 | 48.3 |
| Descriptive | 5 | 17.2 |
| Age group | ||
| Children | 15 | 51.7 |
| Adults | 13 | 44.8 |
| Mixed | 0 | 0.0 |
| Unknown | 1 | 3.4 |
| Region of study | ||
| Europe | 16 | 55.2 |
| North America | 8 | 27.6 |
| Asia | 5 | 17.2 |
| Serotype | ||
| O157 | 22 | 75.9 |
| O104 | 4 | 13.8 |
| O127 | 1 | 3.4 |
| O145 and O26 | 1 | 3.4 |
| O103 | 1 | 3.4 |
| Toxin type | ||
| VT1 and VT2 | 9 | 31.0 |
| VT2 alone | 8 | 27.6 |
| VT1 alone | 3 | 10.3 |
| Unknown | 9 | 31.0 |
| Clinical outcome | ||
| Bloody diarrhea | 9 | 31.0 |
| HUS alone | 9 | 31.0 |
| Both | 10 | 34.5 |
| Unknown | 1 | 3.4 |
| Foodborne transmission | 20 | 69.0 |
| Private party | 8 | 40.0 |
| Nursing homes | 4 | 20.0 |
| School | 4 | 20.0 |
| Community | 1 | 5.0 |
| Farm visit | 1 | 5.0 |
| Restaurant | 2 | 10.0 |
Table continues
Continued
| Variables | No. of Outbreaks | Proportion |
|---|---|---|
| Non-foodborne transmission | 9 | 31.0 |
| Farm visit | 4 | 44.4 |
| Laboratory acquired | 1 | 11.1 |
| Outdoor activity | 2 | 22.2 |
| Surface water | 1 | 11.1 |
| Swimming pool | 1 | 11.1 |
| Food vehicle | ||
| Vegetables | 7 | 35.0 |
| Red meat | 4 | 20.0 |
| Dairy | 3 | 15.0 |
| Poultry | 2 | 10.0 |
| Others | 2 | 10.0 |
| Unknown | 2 | 10.0 |
Abbreviations: HUS, hemolytic uremic syndrome; STEC, Shiga toxin–producing Escherichia coli; VT, Vero toxin.
| Variables | No. of Outbreaks | Proportion |
|---|---|---|
| Non-foodborne transmission | 9 | 31.0 |
| Farm visit | 4 | 44.4 |
| Laboratory acquired | 1 | 11.1 |
| Outdoor activity | 2 | 22.2 |
| Surface water | 1 | 11.1 |
| Swimming pool | 1 | 11.1 |
| Food vehicle | ||
| Vegetables | 7 | 35.0 |
| Red meat | 4 | 20.0 |
| Dairy | 3 | 15.0 |
| Poultry | 2 | 10.0 |
| Others | 2 | 10.0 |
| Unknown | 2 | 10.0 |
Abbreviations: HUS, hemolytic uremic syndrome; STEC, Shiga toxin–producing Escherichia coli; VT, Vero toxin.
Outbreaks involving mostly children accounted for approximately half of the included studies (51.7%, n = 15 of 29); the age distribution in 1 study was unknown. The 15 outbreaks involving mostly children occurred in settings such as farm visits (n = 5), schools (n = 4), and outdoor settings (n = 4) such as swimming pools, camping, and exposure to surface water. Outbreaks involving mostly adults (n = 13) occurred in settings such as private parties (n = 6) and nursing homes (n = 4).
Foodborne transmission accounted for 69% (n = 20 of 29) of the outbreaks, of which 40% (n = 8 of 20) were traced to private parties, and 20% (n = 4 of 20) took place in either a nursing home or a school. Non-foodborne transmission accounted for 31% (n = 9 of 29) of outbreaks, of which 44% (n = 4 of 9) were associated with farm visits. The most commonly identified food categories in foodborne outbreaks were vegetables (35%, n = 7 of 20) and red meat (20%, n = 4 of 20) (Table 2).
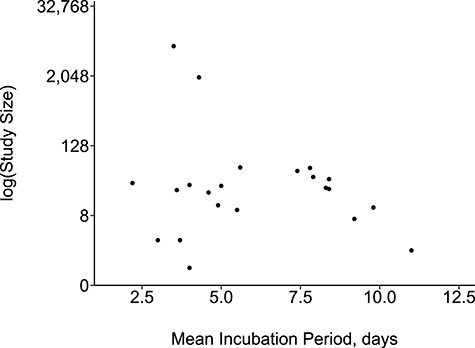
The funnel plot showed no evidence of small-study effect. It was a symmetrical funnel with small-sample studies reporting both short and long incubation periods (Figure 2). The re-created epidemic curves from the extracted individual data showed variation in the distribution of the incubation period (Web Figure 1).
Test for heterogeneity
The results of the Cochran Q statistic (<0.001) and test of heterogeneity (I2 = 77%) indicated high heterogeneity among the studies. From the Kolmogorov-Smirnov test, 56% (n = 143 of 253) of the resulting P values were less than 0.05 and the probability of obtaining this proportion by chance was less than 0.0001.
Factors that may explain heterogeneity
The results of the regression analysis showed outbreaks involving mostly children and attack rate are factors that may influence the mean incubation period. From the univariate analysis, outbreaks involving children had an incubation period 2.7 days shorter than outbreaks involving adults (P = –0.01). A 10% increase in the attack rate resulted in the incubation period being reduced by 0.3 days (P = –0.03). The results were similar in the multivariable analysis; however, the P value indicated a borderline significant association with the mean incubation period (P = –0.06 for both) (Table 3).
Funnel plot showing relationship between sample size and mean incubation period.
Generalized Linear Regression Model Identifying Factors Associated with Incubation Period in the Systematic Review of Studies Between 1984 and 2012
| Variables | Univariate Model (difference in days) | P Value | Multivariable Model (difference in days) | P Value |
|---|---|---|---|---|
| Age | 0.01 | 0.06 | ||
| Adult | Referent | |||
| Children | −2.70 | −2.10 | ||
| Attack rate | −0.03 | 0.03 | −0.03 | 0.06 |
| Setting | ||||
| Other | Referent | |||
| Farm | 1.40 | 0.40 | ||
| Nursing home | 3.20 | 0.10 | ||
| Outdoor | 1.10 | 0.60 | ||
| Private party | 3.10 | 0.10 | ||
| School | −0.60 | 0.70 | ||
| Restaurant | 1.50 | 0.40 | ||
| Mode of transmission | 0.50 | |||
| Foodborne | Referent | |||
| Non-foodborne | −0.60 | |||
| Serotype | 0.30 | |||
| Non-O157 | Referent | |||
| O157 | −1.20 | |||
| Toxin type | ||||
| VT1 | Referent | |||
| VT2 | 1.50 | 0.30 | ||
| VT1 and VT2 | 1.50 | 0.30 | ||
| Bloody diarrhea | 0.90 | |||
| No | Referent | |||
| Yes | −0.10 | |||
| HUS | 0.70 | |||
| No | Referent | |||
| Yes | 0.30 |
Abbreviations: HUS, hemolytic uremic syndrome; VT, Vero toxin.
| Variables | Univariate Model (difference in days) | P Value | Multivariable Model (difference in days) | P Value |
|---|---|---|---|---|
| Age | 0.01 | 0.06 | ||
| Adult | Referent | |||
| Children | −2.70 | −2.10 | ||
| Attack rate | −0.03 | 0.03 | −0.03 | 0.06 |
| Setting | ||||
| Other | Referent | |||
| Farm | 1.40 | 0.40 | ||
| Nursing home | 3.20 | 0.10 | ||
| Outdoor | 1.10 | 0.60 | ||
| Private party | 3.10 | 0.10 | ||
| School | −0.60 | 0.70 | ||
| Restaurant | 1.50 | 0.40 | ||
| Mode of transmission | 0.50 | |||
| Foodborne | Referent | |||
| Non-foodborne | −0.60 | |||
| Serotype | 0.30 | |||
| Non-O157 | Referent | |||
| O157 | −1.20 | |||
| Toxin type | ||||
| VT1 | Referent | |||
| VT2 | 1.50 | 0.30 | ||
| VT1 and VT2 | 1.50 | 0.30 | ||
| Bloody diarrhea | 0.90 | |||
| No | Referent | |||
| Yes | −0.10 | |||
| HUS | 0.70 | |||
| No | Referent | |||
| Yes | 0.30 |
Abbreviations: HUS, hemolytic uremic syndrome; VT, Vero toxin.
Identifying subgroups of studies
The output of the clustering analysis produced a dendrogram of the dissimilarity matrix. As a result of the pragmatic adjustment made to the significance level, the corrected P value was 0.002, and subtracting this from 1 resulted in a cutoff point of 0.998. Applying this cutoff point to the dendrogram resulted in 5 subgroups of studies with limited evidence of heterogeneity among them. These consisted of a subgroup of 7 studies, a subgroup with 5 studies, a subgroup of 4 studies and 2 subgroups with 3 studies each (Web Figure 2).
Summary of subgroup analysis
The mean incubation period among subgroups varied from 3.5 to 8.1 days and differed significantly among subgroups 1–4 (Web Figure 3). Subgroups 2 and 4 had significantly longer mean incubation periods (6.7 and 8.1 days, respectively) compared with the other subgroups (Web Table 5). The variance, skew, and kurtosis also differed and were larger for subgroups with smaller sample sizes. Some variation was observed within subgroups, particularly in outbreaks in which patients had symptoms of bloody diarrhea and HUS, and in the outbreak setting.
Two of the 3 outbreaks in subgroup 2 involved mostly adults and all outbreaks in subgroup 4 involved mostly adults. The distribution of serotypes in the subgroups was diverse, although all outbreaks involving serotype O104 were clustered within subgroup 4. Severity of symptoms was similar across subgroups, because patients reported on in the outbreaks in all subgroups had both bloody diarrhea and HUS (Web Table 5).
DISCUSSION
We conducted a systematic review of published and gray literature and identified articles in which precisely estimated data were reported on the incubation period of STEC. We extracted the reported data and, because of the presence of heterogeneity, classified studies into 5 subgroups for analysis. Among the 5 subgroups, the mean incubation time varied as did other measures of distribution such as the median and variance. The mean incubation period of the subgroups ranged from 3.5 to 8.1 days. Patient age and attack rate were identified as factors that influence incubation period.
In our study, the length of incubation period increased with age; outbreaks involving mostly children had shorter incubation periods. This finding contrasts with that of Werber et al (22), who, using individual patient data, reported the incubation period decreased with age in a single O104 outbreak. Children are more at risk of STEC infections (9) for a number of reasons, some of which could also influence the incubation period. However, we could only perform ecological analysis in our study, due to the lack of individual patient data and because we lacked information to assess many possible explanatory factors that may explain the association of age with the distribution of incubation period.
The attack rate of a disease and incubation period have been reported to have an inversely proportional relationship such that a higher attack rate resulted in a shorter incubation period in a study of Salmonella outbreaks (23). We found that for every 10% increase in attack rate, the incubation period was shortened by 7.2 hours, or 0.3 days. Factors such as virulence of the pathogen, the infectious dose, and host susceptibility, which alter the attack rate of a disease in a population (24–27), and also the incubation period of the disease (28) may have contributed to this association.
We did not find statistical evidence for association of the following features with incubation time: setting, mode of transmission, symptoms, and serotype. STEC O157 is the most commonly reported serogroup (4) and was also the dominant STEC described in our review, accounting for 22 of 29 outbreaks. The O104 serogroup that caused the German outbreak accounted for 3 outbreaks; hence, the paucity of outbreaks caused by non-O157 serogroups may be responsible for the nonsignificant association between serogroup and incubation period. Despite this, all outbreaks associated with the O104 serogroup were clustered in 1 subgroup, which had the longest incubation period. Serotype and toxin type were the information most often reported from outbreaks; the outbreaks we studied lacked more detailed microbial characterization. As routine STEC genome sequencing increases, testing of a wider range of pathogen factors for association with incubation period will be possible. The observed clustering of the O104 outbreaks within the same incubation-time subgroup (Web Figure 3) (19–21, 29), which outbreaks shared both a pathogen lineage, and a transmission route through contaminated beansprouts support the potential importance of these factors in affecting incubation period.
The variability of incubation-time distribution between outbreaks and the large number of outbreaks with incubation times longer than those cited in reference materials (1, 3) are striking. The mean incubation time across the 7 outbreaks in subgroup 4 was longer than the standard ranges proposed for individual cases (1, 3). Even acknowledging that 3 of these 7 outbreaks were from the outbreaks (19–21) within the large German O104 outbreak (14) with identifiable incubation times and 1 from a related O104 outbreak in France (29), this large cluster of outbreaks with longer-than-expected incubation times highlights the risks associated with restricting investigation to exposures occurring within expected incubation-time distributions. A consequence is the need for outbreak investigators to consider a wide range of potential incubation times. We offer in this study an evidence base of the scale of variation to inform future editions of reference materials.
Although we summarized data across the published literature, our study is based on very limited data compared with the large burden of disease of STEC and the numerous outbreaks investigated and reported (5, 11). The majority of STEC cases are sporadic (30); however, some are part of continuous-source outbreaks (31–34), where it is difficult to identify exposure time and, therefore, difficult to calculate incubation periods accurately. We excluded many studies from this review because, although the necessary data appear to have been gathered, they were not reported in a way that allowed suitable data extraction. Standard approaches to reporting incubation-period data in outbreak reports should be developed and would be useful for better understanding incubation periods. The same is no doubt true for other questions, including the effectiveness of control measures, where the natural experiments offered by outbreaks could contribute to evidence-based practice if well reported and collated.
One reporting feature of importance to incubation time is the case definition used. Where data for occurrence of diarrhea and HUS were available, we observed a period of 4–7 days between onset of diarrhea and onset of HUS, similar to that reported by Razzaq (35). In our review, most of the case definitions used by authors included diarrhea or bloody diarrhea without HUS; a few included all 3 clinical outcomes. We observed that in studies in which all clinical outcomes were reported, including HUS, a longer mean incubation period was recorded than in other studies; however, we did not identify a significant association between HUS and the length of incubation period, as also reported by Werber et al (22). We suspect that some of the heterogeneity we observed in the incubation-period distribution across outbreaks may be explained by the differences in the case definitions. Reporting with more specific case definitions and even separation of results across cases on the basis of different symptoms is thus an example of a feature of standard reporting that could promote better evidence synthesis.
Even with detailed and standardized reporting of outbreaks, there are limitations to using the published literature to study factors associated with incubation time. For these questions, individual patient data allowing analysis of host factors such as premorbidity, ongoing medications, and dose are required, as well as outbreak-level characteristics such as mode of transmission and pathogen characteristics. This raises questions on how best to capture, store, and make accessible data from individual outbreaks in a way that will allow joint analysis and align with the increasing trend toward individual-patient data meta-analysis in the synthesis of randomized, controlled trial evidence.
The studies included in our review were predominantly outbreak reports for which incubation period was not the main goal of investigation and the population studied were cases being investigated as part of the outbreak. Therefore, there is little possibility of encountering publication bias or selection bias due to the reported incubation period. Furthermore, we found no evidence of small-study effect. Although focusing on sharing information on incubation period protected against publication bias, it no doubt contributed to the exclusion of studies, with the majority of studies we identified not meeting the quality assessment criteria for reporting of incubation period. Extracting individual data involved using an online data-extraction tool and a manual process of selecting each data point, which is open to human error and could alter the reported incubation period. However, these errors are likely to be small. Results, therefore, are not likely to be substantially biased, although they are based on a restricted number of studies in which usable data were reported.
In conclusion, we confirmed in this review of studies that the STEC incubation period varied across outbreaks, and we identified several subgroups, some of which had incubation periods far longer than expected, based on standard estimates. We identified age and attack rate as factors that may influence the distribution of incubation period. However, there was insufficient information to explain the relationship between these factors and incubation period or to study the impact of many individual patient-level factors on incubation period. Our work highlights the opportunities afforded for information synthesis across outbreaks to support evidence-based practice and the challenges to be overcome to optimize reporting and ultimately support combined analysis across outbreaks if the full potential of these natural experiments is to be exploited.
ACKNOWLEDGMENTS
Author affiliations: National Institute of Health Research, Health Protection Research Unit in Gastrointestinal Infections, University of Liverpool, Liverpool, United Kingdom (Adedoyin Awofisayo-Okuyelu, Ian Hall, and Noel McCarthy); Department of Zoology, University of Oxford, Oxford, United Kingdom (Adedoyin Awofisayo-Okuyelu and Noel McCarthy); National Institute of Health Research, Health Protection Research Unit in Emergency Preparedness and Response, King’s College London, London, United Kingdom (Julii Brainard); Norwich Medical School, University of East Anglia, Norwich, United Kingdom (Julii Brainard); School of Mathematics, University of Manchester, Manchester, United Kingdom (Ian Hall); and Warwick Medical School, University of Warwick, Warwick, United Kingdom (Noel McCarthy).
This research was funded by the National Institute for Health Research (NIHR) Health Protection Research Units in Gastrointestinal Disease and Emergency Preparedness and Response in partnership with Public Health England (PHE). The views expressed are those of the authors and not necessarily those of the National Health Service, the NIHR, the Department of Health, or PHE.
Conflict of interest: none declared.
REFERENCES
Lumen. Microbiology. Characteristics of infectious disease. https://courses.lumenlearning.com/microbiology/chapter/characteristics-of-infectious-disease/. Accessed December 30, 2017.
