


Abstract
Age at pubertal onset has decreased over the recent decades. Early maturing girls have longer puberty duration, and higher peak height velocity (PHV) than late maturing girls. To what extent this is generated by increased insulin-like growth factor-I (IGF-I), fat mass, or fasting insulin levels is currently unknown.
A population-based study—part of the COPENHAGEN puberty study—longitudinal part. Eighty-one girls evaluated biannually for a median of 10 (2-15) visits for a total of 815 evaluations.
Pubertal staging, anthropometric measures, PHV, skin fold thickness (SFT), and IGF-I and fasting insulin levels were measured.
Early maturing girls achieved similar final height compared to late maturing girls (166.1 vs 167.1 cm, P = .36). Early pubertal onset was associated with significantly greater PHV (8.7 vs 7.4 cm/year, P < .001) and a longer puberty duration (age at onset of breast development to age at PHV [1.8 vs 1.1 years, P < .001]) compared with late maturation. After correcting for age at pubertal onset, neither body mass index, SFT, nor IGF-I levels differed between early vs late maturing girls. By contrast, fasting insulin levels were significantly higher in early compared with late maturing girls 1.5, 2.0, and 3.0 years after pubertal onset (all P = .039).
Growth velocity was higher and more prolonged in early compared with late maturing girls and associated with higher insulin levels. Thus, the higher insulin levels may compensate for the shorter total growth period by intensifying the pubertal growth period.
NCT01411527.
In this longitudinal study of female puberty, we show that girls with early maturation had significantly higher growth velocity and higher fasting insulin levels compared with girls with late maturation. This was significant even after adjustment for age at onset of breast development. This explains why early matured girls with shorter total growth periods reach the same adult height as late matured girls. In addition, the higher growth velocity was correlated with higher fasting insulin levels, both cross-sectional and longitudinal, during puberty. Thus, fasting insulin may be a significant growth factor for the pubertal growth spurt in girls.
Introduction
Age at pubertal onset defined by breast development in girls has decreased over the recent decades worldwide.1,2 In the same time period, age at attainment of later pubertal milestones such as age at menarche does not seem to have decreased in parallel, suggesting that the pubertal duration (time from stage B2 to menarche) has increased.3
Although earlier pubertal development leads to younger age at epiphyseal closure, secular trends toward taller stature have been documented over the recent decades.4,5 Thus, compensatory mechanisms are at play to maintain full growth potential. Several studies report that earlier pubertal timing is associated with augmented pubertal growth rates in girls.6,7 Thus, early maturing girls reaching normal levels of final adult height may be due to intensified and prolonged pubertal growth rates. However, the mechanisms underlying the variation of growth velocities in early and late maturing children are unknown.
Pubertal timing is highly influenced by genetic factors.8-10 However, genetic factors cannot explain the observed marked changes over few decades, and lifestyle and/or environmental factors must play a role. In the COPENHAGEN puberty study,11 differences in body mass index (BMI) could not explain the marked changes in pubertal onset observed over 16 years, which prompted us to evaluate other factors including endocrine disrupting chemicals.12 Clearly, body fat mass plays a significant role in timing of puberty in girls,13-15 and increased fat mass may lead to augmented linear growth during childhood and early puberty.16,17
The growth hormone/insulin-like growth factor-I (IGF-I) axis is of paramount importance for the linear bone growth observed during childhood and puberty. We have previously shown that circulating IGF-I levels are higher in early compared with normally maturing girls for a given Tanner stage of puberty.18 In addition, the hyperinsulinemia that accompany the increase in adiposity19 has also been linked to the early pubertal timing in girls.20 However, rodent models suggest that hyperinsulinemia without obesity leads to early pubertal activation of the hypothalamic-pituitary-gonadal (HPG) axis.21 During puberty, insulin sensitivity decreases with a compensatory increase in insulin secretion independent of adiposity.22,23 These dynamic changes seem to be more marked in early maturing than late maturing girls.18,24,25 In addition, insulin also has growth potential properties either directly or indirectly thought the effect on IGF-I and its binding proteins.26 However, to what extent it is the pubertal increase of insulin secretion or the increasing GH/IGF-I levels that drives the accelerated growth velocity in early compared with late maturing girls remains to be elucidated.
The aim of the present study was to evaluate longitudinal changes in growth velocity in association with changes in body composition, fasting insulin, and IGF-I concentrations in healthy peri-pubertal girls according to their timing of pubertal onset.
Methods
Study subjects
In this longitudinal study, as part of the COPENHAGEN puberty study (ClinicalTrials.gov ID: NCT01411527), we examined 110 healthy Danish girls every 6 months over the course of 8 years (2006-2014). A total of 815 examinations were carried out, and the median age at first examination was 9.2 years (range, 5.84-14.95). The median (range) number of examinations was 10.2-15 All participants were recruited from 2 schools in the Copenhagen area. The schools were in the upper 20% of Danish schools with respect to parental income and socioeconomic status in a national investigation from 2011 (http://www.kora.dk/media/277013/Bilag_2_til_rapport_om_folkeskolens_faglige_kvalitet.pdf). All the examined girls were healthy. Other aspects of the COPENHAGEN puberty study have previously been published.11,27
Clinical examination
Height was measured to the nearest 0.1 cm using a stadiometer (Holtain Ltd.). Weight was measured to the nearest 0.1 kg using a digital electronic scale (SECA). The children were weighed without shoes, wearing light clothing. The fat mass was evaluated by: (1) body mass index: calculated as weight (kilograms) divided by height (meters) squared (kg/m2), and (2) the thickness of 4 skinfolds (biceps, triceps, subscapular, and suprailiac crest) was measured on the left side of the body using a skinfold caliper calibrated to 0.2 mm (Harpenden, British Indicators Ltd). The sum of all 4 skin folds was calculated. Growth velocity was calculated at every visit by the current height minus the height half year before multiplied with 2 to achieve cm/year.
Breast developmental (B15) and pubis hair stages (PH1-5) were assessed by clinical examination according to Marshall and Tanner in all girls.28 Pubertal onset was defined as the first examination with breast budding (B2). Age at B2 could be determined in 72 girls as the first examination with breast budding (B2) in at least 1 breast. The girls were divided into groups of early and late age at pubertal onset based on the mean age at pubertal onset in this cohort (breast stage 2 before and after 10.5 years of age). An additional 9 girls could be classified as either early pubertal onset as they were pubertal at first visit and below 10.5 years of age or late pubertal onset in that they were pre-pubertal at last visit and above 10.5 years of age, leaving 81 girls for final analyses. Age at menarche was achieved in 41 of the girls.
Blood sampling procedure
Fasting blood samples were drawn from an antecubital vein between 08:30 and 9:30 hours. Blood samples were clotted and centrifuged, and serum was stored at −20 °C until hormone analyses were performed. IGF-I were measured on 707 samples, dihydroepiandrosterone sulfate (DHEAS) on 511 samples, and insulin on 534 samples, of which the 526 were fasting samples. Glucose was measured on 242 samples.
Serum hormone analyses
Serum concentrations of insulin were determined by an electrochemiluminescence immunoassay (Elecsys insulin reagents kit; Roche Diagnostics, Mannheim, Germany) on an automated Roche Modular Analytics Module E170 (Roche Diagnostics). The detection limit for insulin was 2 pmol/L and the intra- and interassay coefficients of variabilities (CVs) were 4.2% and 8.2%, respectively. Glucose was determined on automated Roche Modular Analytics Module P (Roche Diagnostics) by enzymatic absorption photometry (GLU, Roche, Mannheim, Germany) with intra- and interassay CVs < 2%, respectively. Serum IGF-I and IGF binding protein (IGFBP)-3 were determined by immunoassay (IMMULITE 2000, Siemens Healthcare Diagnostics) with detection limits of 20 and 100 ng/mL, respectively. IGF-I intra- and interassay CVs were 2.1% and 10.1%; for IGFBP-3, CVs were 4.3% and 9.2%, respectively. DHEAS was measured by specific solid-phase, competitive chemiluminescent enzyme immunoassays (Immulite 2000; Siemens, USA) with detection limits of 0.41 μmol/L. The intra- and interassay CVs were 6.3%-7.1% and 7.8%-10.2% and 7.1%-10.8% and 11.0%-14.9%, respectively.
Statistical analyses
Data are presented as mean and 95% CI. Correlations between age at B2, age at peak height velocity (PHV), duration between age at B2 and PHV, and magnitude of PHV were evaluated using Spearman rho correlations (ρ). Simple group comparisons of age at B2, age at PHV, B2-PHV duration, and magnitude of PHV between early and late pubertal onset groups were done with independent samples t-tests. Simple correlations between PHV with fasting insulin, IGF-1, and DHEAS levels at different timepoint were evaluated with Spearman rho correlations (ρ). Adjustment for skin fold thickness (SFT) in these analyses was done by linear regression analyses.
Differences in height, growth velocity, BMI, sum of skinfolds, IGF-I, IGFBP-3, DHEAS, and fasting insulin levels between the early and late pubertal groups were evaluated by linear mixed models to account for the repeated measurements on each individual. Models were done with autoregressive: heterogenous as repeated covariance type. Models were done with either chronological age (half year intervals) from age 8.5 to 15.5 years or adjusted age from onset of B2 (half year intervals) from 2.0 years before to 5.0 years after onset of puberty. The analyses were spilt into a pre-pubertal (−2.0 to −0.5 years) and a puberty (0 to 5.0 years) evaluation for selected variables. The depending variables were log-transformed to obtain normal Gaussian distribution of the residuals. Groups of early and late onset of B2 and age/corrected age were included as fixed factors. Results are shown as mean differences and 95% CI between the early and late B2 groups.
To further explore the longitudinal changes in fasting insulin, IGF-I, and height, we made linear regression analysis on each individual from pubertal onset to 2 years beyond pubertal onset (0 to 2 years). Each individual with at least 4 of 5 measurements was included. The changes in fasting insulin and IGF-I per year were correlated with changes in height per year (growth velocity) by spearman rho (ρ). Twenty to 35 individuals were available in each analysis.
To determine the magnitude and age at PHV, we modeled the height of an individual by a population-wide growth curve plus an individual time-consistent height deviation. The model included a random warping function per individual that allowed temporal deformation of the population growth pattern, thus modeling a height development age for each subject. The models belong to the class of functional nonlinear mixed-effects models29 and were fitted using maximum likelihood estimation. The population height curve was modeled by an increasing spline with 10 anchor points. The consistent height variations over time were modeled by a Gaussian Matérn process with smoothness 2. The time warping was done using an increasing spline with 2 anchor points driven by an underlying Brownian bridge. Height velocity curves were calculated from the model by differentiation of the predicted height curves. Individual ages at PHV were found as the chronological ages that corresponded to the population PHV in adjusted age. The model has been presented in a previous study.30
All statistical analyses were performed using IBM SPSS Statistics 29.0 (SPSS, Chicago, IL). P-values of <.05 were considered statistically significant.
Ethical considerations
The study was approved by the local ethical committee (KF 01 282214) and the Danish Data Protection Agency (2010–41–5042). All participants and their parents gave their informed assent/consent before enrollment in the study. The study is in accordance with the Declaration of Helsinki.
Results
Basic characteristics of the participants are presented in Table 1. Age at onset of B2 (age at first biannual examination with breast stage B2) was positively correlated with age at PHV (ρ = .62; P < .001), and negatively correlated with PHV (ρ = −.75; P < .001). Age at onset of B2 was negatively correlated with the duration from age at B2 to age at PHV (ρ = −.57; P = .003) and negatively to age at menarche (ρ = −.46; P = .005).
Basic characteristics all the participants divided into groups of early pubertal onset (onset of B2 before 10.5 years) and late pubertal onset (onset of B2 after 10.5 years).
| Early (age at B2 < 10.5 years) | Late (age at B2 > 10.5 years) | |
|---|---|---|
| n = 35 | n = 37 | |
| Age at B2 (years) | 9.5 (±0.2) | 11.3 (±0.3)* |
| Age at PH2 (years) | 10.5 (±0.4) | 11.3 (±0.3)* |
| Age at menarche (years) | 12.5 (±0.4) | 13.7 (±0.3)* |
| Age at PHV (years) | 11.2 (±0.2) | 12.5 (±0.2)* |
| Age at B2 to age at PHV (years) | 1.8 (±0.3) | 1.1 (±0.3)* |
| Age at B2 to age at menarche (years) | 3.1 (±0.4) | 2.5 (±0.4) |
| PHV (cm/year) | 8.7 (±0.4) | 7.4 (±0.3)* |
| At pubertal onset (onset of B2) | ||
| Height (cm) | 141.2 (±1.7) | 145.9 (±1.7)* |
| Growth velocity (cm/year) | 6.5 (±0.6) | 5.8 (±0.5) |
| Weight (kg) | 35.3 (±1.7) | 35.9 (±1.5) |
| BMI (height/weight2) | 17.7 (±0.7) | 16.8 (±0.6) |
| SFT (mm) | 39.4 (±4.6) | 34.1 (±2.7) |
Results are presented as means (±1.96 SE). Significant differences between the 2 groups were evaluated by independent sample t-test. P < 0001 are marked with an asterisk.
Height and growth velocity in relation to pubertal timing
In relation to chronological age, early maturing girls were taller than late maturing girls from late childhood (age 9.0 years) until early adolescence (age 13.5 years) (Figure 1A) corresponding to earlier onset of the pubertal growth spurt (Figure 1B). Adjusted for age at pubertal onset, the early maturing girls were shorter at pubertal onset but caught up with the late maturing girls from 2 years after pubertal onset achieving similar final adult height (Figure 1E). In accordance, the group of early maturing girls had a higher mean growth velocity evaluated over the entire 7-year evaluation period (mean Δ 0.7 (0.4-1.0) cm/year; P < .001), although only significantly higher at a few separate biannual timepoint (Figure 1F). When evaluating the pre-pubertal (−2.0 to −0.5 years before pubertal onset) and pubertal periods (0 to 5.0 years after pubertal onset) in separate analyses, the early maturing girls had higher growth velocities than the late maturing girls both prior to pubertal onset (mean Δ 0.8 (0.4-1.4) cm/year; P = .001) and through puberty (mean Δ 0.6 (0.3-1.0) cm/year; P = .001).
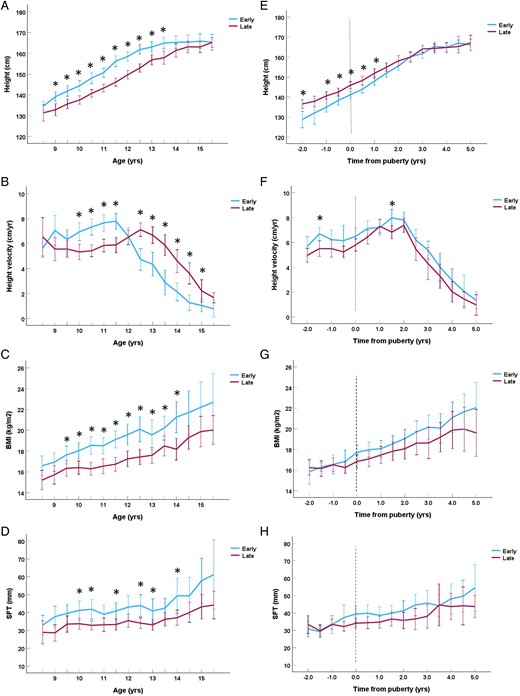
Height in centimeters (A), height velocity in centimeters/year (B), BMI in weight/height2 (C), and skinfold thickness in centimeter (D) in relation to chronological age in years divided into groups of early (breast stage B2 < 10.5 years) and late (B2 ≥ 10.5 years) pubertal onset. Height in centimeters (E), height velocity in centimeters/year (F), BMI in weight/height2 (G), and skinfold thickness in centimeter (H) in relation to time to/from pubertal onset in years divided into groups of early (breast stage B2 < 10.5 years) and late (B2 > 10.5 years) pubertal onset. Significant differences between groups (P < .05) for each timepoint are marked with an asterisk * (Student’s t-test). The whiskers represent the 95% CI.
In compiled analyses including all participating girls, higher growth velocity at −1.5 to 2 years before/after pubertal onset was correlated with higher PHV (all ρ ≥ .33; all P ≤ .037).
Body composition in relation to pubertal timing and growth
The early maturing girls had higher BMI (Δ 1.5 (0.8-2.3) kg/m2; P < .001) and greater SFT (Δ 6.0 (2.1-10.0) mm; P = .003) than late maturing girls when evaluated for chronological age (Figures 1C and 1D). However, none of these differences remained significant when evaluated in relation to age at pubertal onset (BMI: Δ 0.7 (−0.1-1.5) kg/m2; P = .10) and SFT: Δ 2.3 (−1.8-6.5) mm; P = .27) (Figures 1G and 1H). Looking at the pre-pubertal period alone, BMI and SFT did not differ between the early and late maturing girls (both P ≥ .46).
Greater PHV correlated significantly with lower BMI at −2.0, 0.5, 1.0, and 2.0 years (all ρ ≤ −.26, P ≤ .041). However, smaller SFT was only significantly correlated with greater PHV at −1.0 and 1.0 before and after pubertal onset (both ρ ≤ −.28, P ≤ .041).
Skin fold thickness and BMI at age 8.5 years was not correlated with either age at onset of B2 or age at PHV (all ρ ≥ −.33, P ≥ .10).
Fasting insulin, IGF-I, and DHEAS levels in relation to pubertal timing and growth velocity
Fasting insulin (mean Δ 41.2 (26.9-57.0) %, P < .001), IGF-I levels (mean Δ 20.6 (8.8-33.5) %; P < .001), and DHEAS (mean Δ 30.7 (6.5-60.3) %, P = .011) were significantly higher in early compared with late maturing girls when evaluated in relation to chronological age, respectably (Figures 2A and 2B). Fasting insulin levels (mean Δ 16.2 (5.3-28.1) %; P = .003), but not IGF-I (mean Δ 2.0 (−6.4-11.2) %; P = .64) or DHEAS (mean Δ −3.3 (−23.7-22.5) %; P = .78) levels, remained higher in the early maturing girls when adjusted for age at pubertal onset (Figures 2D and 2E). When splitting the analyses into pre-pubertal and pubertal periods, fasting insulin levels were significant higher in the pubertal (mean Δ 16.4 (4.1-30.1) %; P = .008) period, and reached borderline significance in the pre-pubertal (mean Δ 22.5 (−1.5-52.2) %; P = .067) period in the early compared with late maturing girls.
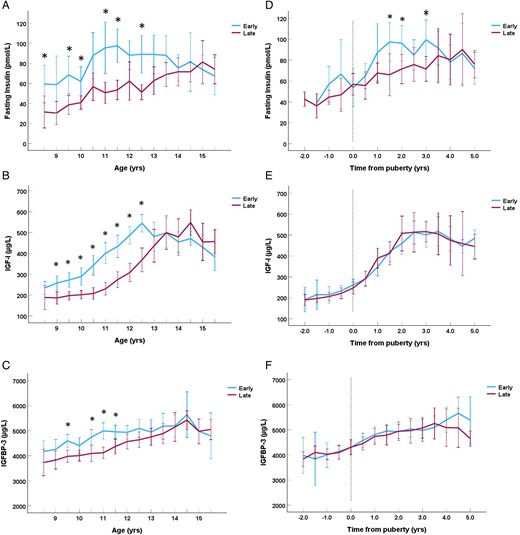
Fasting insulin levels in pmol/L (A), insulin-like growth factor-I (IGF-I) levels in μg/L (B), and IGFBP-3 levels in μg/L (C) in relation to chronological age in years divided into groups of early (breast stage B2 < 10.5 years) and late (B2 ≥ 10.5 years) pubertal onset. Fasting insulin levels in pmol/L (D), IGF-I levels in μg/L (E), and IGFBP-3 levels in μg/L (F) in relation with time to/from pubertal onset in years divided into groups of early (breast stage B2 < 10.5 years) and late (B2 ≥ 10.5 years) pubertal onset. Significant differences between groups (P < .05) for each timepoint are marked with an asterisk * (Students t-test). The whiskers represent the 95% CI.
In analyses of all participating girls, greater PHV was correlated with higher fasting insulin (ρ = .50; P < .001) as well as higher IGF-I levels (ρ = .37; P = .005) at time of PHV. Furthermore, higher fasting insulin levels at timepoints 0.5 and 1.5 years (both ρ ≥ .37; P ≤ .043) and higher IGF-I levels at timepoint 1.5 years (ρ = .31; P = .033) after pubertal onset were correlated with greater PHV. All these correlations did not change after additional adjustment for SFT in linear regression analyses (P ≤ .044). The increase in fasting insulin, but not IGF-I, levels was correlated with increase in height (growth velocity) over the first 2 years of puberty (ρ = .47; P = .039). Lower DHEAS levels were correlated with PHV at 2 years before to 0.5 years after pubertal onset (all ρ ≤ −.31, P ≤ .048).
At age 8.5 years, higher fasting insulin was correlated with earlier age at B2 (ρ = −.59; P = .034). In contrast, higher IGF-I levels at age 8.5 years were correlated with earlier age at PHV (ρ = −.47; P = .012). Higher DHEAS at 8.5 years was borderline significantly correlated with earlier age at onset of pubic hair (ρ = −.43; P = .058).
Higher insulin levels were only correlated with higher SFT from 1.5 to 5.0 years (BMI from 2.0 to 4.5 years) after pubertal onset (all ρ ≥ .30; P ≤ .037).
Discussion
In the present longitudinal study of healthy peri-pubertal girls, we observe similar final height in girls with early vs late onset of puberty. The increased pubertal growth spurt in early maturing girls which compensates for the shorter pre-pubertal growth phase may be related to higher insulin levels rather than IGF-I levels and fat mass.
The timing of puberty greatly influences the duration of the statural growth period. Early pubertal timing leads to accelerated growth, advanced bone maturation, and ultimately to earlier closure of the epiphysial growth plates. In accordance with previous studies,6,7 we found that girls with early pubertal onset had longer pubertal periods and higher pubertal growth velocities including higher PHV compared to girls with late pubertal onset. Even prior to puberty, early matured girls had higher growth velocities than girls entering puberty later. Thus, early maturing girls seem to compensate for the shorter total growth period by higher growth rates both before and during puberty. In accordance, the early maturing girls were shorter at pubertal onset but caught up completely to the height of the late maturing girls. In addition, we found a strong interrelationship between higher pre-pubertal growth velocity, higher pubertal growth velocity, and early attainment of pubertal milestones (age at onset of breast development and age at PHV).
To further explore the relationship between growth and pubertal timing, we evaluated fasting insulin and IGF-I levels before and during the pubertal period. As expected, fasting insulin and IGF-I levels were higher at an earlier age in the early compared with late maturing girls. However, only fasting insulin levels remained higher in the early compared with the late maturing girls when adjusted for age at pubertal onset, although only significantly in the pubertal girls. In accordance, higher fasting insulin levels during puberty have previously been found in girls with early-timed menarche.24 In addition, we previously found that girls with central precocious puberty (CPP) had higher fasting and oral glucose-stimulated insulin levels than girls with normal puberty when adjusted for stage of puberty and bone age.18,25 In addition, greater PHV was correlated with fasting insulin levels independent of adiposity, throughout most of the pubertal growth spurt. The greater increase in fasting insulin levels from pubertal onset to 2 years after pubertal onset was associated with a greater increase in height in the same period. Thus, insulin levels seem to increase the intensity of the pubertal growth spurt, although the cause-and-effect relationship could not be determined.
Adiposity greatly influences insulin sensitivity and insulin levels even in non-obese subject.23,31,32 In the present study, no differences were found in adiposity-related outcomes (BMI and SFT) between the early and late maturing girls when adjusted for age at onset of puberty. In accordance, previous studies have found that higher pubertal insulin levels in early compared with late maturing girls are present even after adjustment for differences in adiposity.18,24 In the present study, we did not find any significant association between SFT and pubertal timing. Thus, adiposity does not seem to be responsible for the higher fasting insulin or the earlier pubertal timing in the present study. In addition, the higher insulin levels were only correlated with higher SFT beyond 2 years after pubertal onset in all the girls.
The decrease in insulin sensitivity and the compensatory increase in insulin levels during puberty is at least partly caused by the concomitant increase in GH secretion.33,34 A similar observation is evident during GH treatment.35 Thus, differences in GH secretion between early and late maturing girls could theoretically explain the differences in insulin levels. However, girls with CPP seem to have GH levels typical of normal puberty.36 In addition, one would expect higher GH secretion to result in higher circulating IGF-I levels. However, in the present study, IGF-I and IGFBP-3 levels were similar in early and late maturing girls when adjusted for onset of puberty. We previous found that girls with CPP had higher IGF-I levels than puberty-matched controls.18 Although this seems contradictory to the present results, the girls with CPP were evaluated early in puberty and the IGF-I levels may represent an early increase rather than higher IGF-I levels per se. In the present study, IGF-I at age 8.5 years was related to earlier age at PHV. This is in accordance with a previous study that found that IGF-I levels at age 8 years were related to earlier age at menarche.37
The mechanisms underlying the relationship between glucose homeostasis and pubertal timing is still largely unknown. A recent study on lean female mice has shown that hyperinsulinemia can activate the HPG axis and lead to early pubertal timing.21 Higher childhood fasting insulin levels have been associated with early menarche.20 In the present study, we found that higher fasting insulin at the age of 8.5 years was associated with earlier pubertal onset. However, the relationship between pubertal timing markers and glucose regulation seems to go way beyond the pubertal period. Earlier age at menarche has been associated with increased risk of both gestational38 and type 2 diabetes39 in adulthood. The pubertal period, the gestational period, and the senescence all share the same tendencies to become hyperinsulinemic or to develop type 2 diabetes due to lower insulin sensitivity. A recent study by Hu et al.40 reports that childhood fasting insulin was associated with the risk of type 2 diabetes independent of fasting glucose and BMI. Thus, high childhood fasting insulin may be related to early puberty as well as increased risk of type 2 diabetes.
There is evidence that high levels of adrenal androgens are associated with early maturation,37,41 increased childhood growth,42 and hyperinsulinemia in girls.43 In the present study, the DHEAS levels was significantly higher in the early matured girls, but the difference disappeared after correcting for pubertal onset, indicating that this was due to maturational timing and not higher DHEAS levels per se. The DHEAS levels were not correlated to age at onset of breast development but borderline significantly to age at onset of pubic hair. In addition, lower DHEAS levels were correlated with higher PHV before puberty in the adjusted analysis. Thus, DHEAS levels in this cohort do not explain the higher fasting insulin and growth in early maturing girls.
Strength and limitations
The strength of the current study is the biannual evaluation of pubertal stages including breast palpation and pubic hair by direct inspection, growth parameters, and fasting blood sample over the course of 8 years. This enables the evaluation of growth velocity, PHV, fasting IGF-I and insulin levels in relation to age of pubertal onset. In addition, all clinical examinations were done by the same 3 physicians thorough out the study. The limitation was that fasting glucose was only determined on the first 4 rounds of the study which made it impossible to calculate surrogates of insulin sensitivity throughout the study period. However, none of the participant had high fasting glucose or were obese. Thus, in a cohort of normal-weight euglycemic children, the insulin level is the best proxy of insulin sensitivity. In addition, our cohort consists of white Caucasian girls born in Denmark from Danish parents with a middle to high socioeconomic status. Thus, other cohorts in different ethnicities and socioeconomic classes may reveal different results.
Conclusion
In summary, early maturing girls achieved similar final height as late maturing girls. Growth velocity during puberty was higher and seems to compensate for the shorter pre-pubertal growth period in the girls with early vs later pubertal onset. This effect could be caused by higher fasting insulin rather than IGF-I levels—independent of fat mass.
Funding
A.J. received support from EU HORIZON Europe ERC (Health) project: early prevention of obesity (eprObes), grant agreement no. 101080219.
Authors’ contributions
Kaspar Sørensen (Conceptualization [equal], Formal analysis [lead], Investigation [equal], Methodology [equal], Writing—original draft [lead], Writing—review & editing [equal]), Casper P. Hagen (Conceptualization [equal], Methodology [equal], Writing—review & editing [equal]), and Anders Juul (Conceptualization [equal], Investigation [equal], Methodology [equal], Project administration [lead], Writing—review & editing [equal]).
Data availability
Due to danish GDPR regulations individual data cannot be made publicly available or accessible to external collaborators.
References
Author notes
Conflict of interest: The authors have no conflict of interest.
