


Abstract
Several endocrine abnormalities were reported in children with Prader–Willi syndrome (PWS), including hypothyroidism. Growth hormone (GH) treatment may impact the thyroid hormone axis by direct inhibition of T4 or TSH secretion or by increased peripheral conversion of free T4 (FT4) to T3.
The objective of this study is to evaluate thyroid function during GH treatment in a large group of children with PWS.
Serum FT4, T3, and TSH are measured in a 2-year randomized controlled GH trial (RCT) and 10-year longitudinal GH study (GH treatment with 1.0 mg/m²/day [∼0.035 mg/kg/day]).
Forty-nine children with PWS were included in the 2-year RCT (median [interquartile range, IQR] age: GH group 7.44 [5.47-11.80] years, control group 6.04 [4.56-7.39] years). During the first 6 months, median (IQR) FT4 standard deviation score (SDS) decreased in the GH group from −0.84 (−1.07 to −0.62) to −1.32 (−1.57 to −1.08) (P < .001) and T3 SDS increased from 0.31 (−0.01-0.63) to 0.56 (0.32-0.79) (P = .08), while in the control group, FT4 and T3 SDS remained unchanged. In our 10-year GH study, 240 children with PWS (median [IQR] age: 1.27 (0.54-4.17) years] were included. Between 2 and 10 years, median (IQR) FT4 SDS remained unchanged, being −0.87 (−0.98 to −0.77) after 2 years and −0.88 (−1.03 to −0.74) after 10 years (P = .13). TSH SDS decreased from −0.35 (−0.50 to −0.21) after 2 years to −0.68 (−0.84 to −0.53) after 10 years (P < .001).
Our findings suggest that GH treatment decreases FT4 levels, due to increased peripheral conversion of FT4 to T3 in the first months of treatment, but thereafter, FT4 and T3 normalize and remain stable during long-term GH treatment in almost all children and adolescents with PWS.
This is the first randomized controlled GH trial in children with Prader–Willi syndrome (PWS) investigating the effects of 2 years of growth hormone (GH) treatment compared to no treatment on serum thyroid hormone levels. In addition, we describe the thyroid hormone levels during our prospective 10-year GH study in a large group of children with PWS. Our findings suggest that GH treatment decreases FT4 levels, due to increased peripheral conversion of FT4 to T3 in the first months of treatment, but thereafter, FT4 and T3 normalize and remain stable during long-term GH treatment in almost all children with PWS. Based on our findings, we recommend to measure T3 when the FT4 level is low in children with PWS, particularly during the first months of GH treatment.
Introduction
Prader–Willi syndrome (PWS) is a rare genetic disorder caused by the lack of expression of the paternally inherited imprinted genes on chromosome 15, due to a paternal deletion, maternal uniparental disomy (mUPD), imprinting center defect (ICD), or parental chromosomal translocation.1,2 Prader–Willi syndrome is characterized by muscular hypotonia, short stature, developmental delay, behavioral problems, and an abnormal body composition with high body fat percentage and a low lean body mass.2 Many symptoms in PWS may be explained by hypothalamic dysfunction.3
Several endocrine abnormalities have been described, including growth hormone (GH) deficiency and hypogonadism.4 Hypothyroidism has also been reported in children with PWS; however, data are conflicting. The reported prevalence of hypothyroidism in children with PWS ranges from 0% to 32%.4-9
Studies have shown that GH treatment is beneficial for children with PWS as it improves their body composition, linear growth, physical strength, and cognitive functioning.10-15 Growth hormone might, however, interact with the thyroid hormone axis, either via a direct inhibition of T4 or TSH secretion or via an increased peripheral conversion of free T4 (FT4) to T3.16 Some studies reported low FT4 levels in GH-treated children with PWS for which replacement therapy were prescribed.17,18 We previously reported a significant decrease of serum FT4 levels to low normal levels during 1 year of GH treatment, while it remained unchanged in untreated controls with PWS.6 Konishi et al.19 also described reduced FT4 levels in children with PWS aged 25-84 months during 18 months of GH treatment. However, Oto et al.9 found no change in FT4 levels during 2 years of GH treatment. There are no data of thyroid hormone levels in children with PWS who were GH treated for a longer period.
The primary aim of our study was to investigate the effect of 2 years of GH treatment on serum thyroid hormone levels in children with PWS compared to untreated children with PWS in a 2-year randomized controlled GH trial (RCT). We hypothesized that GH treatment in children with PWS would result in a decrease in FT4 and increase in T3 levels due to increased peripheral conversion of FT4 to T3 while these would remain unchanged in untreated controls with PWS. The secondary aim was to prospectively investigate serum thyroid hormone levels during 10-year GH treatment in children with PWS. We hypothesized that thyroid hormone levels would remain normal on the long term.
Methods
Patients
All participants were diagnosed with PWS by methylation analysis of the PWS region. Forty-nine children were included in our 2-year RCT between 2002 and 2007. They were randomly assigned to either a GH group receiving GH 1 mg/m²/day s.c. (∼0.035 mg/kg/day) or a control group. In addition, we included 240 children in our 10-year longitudinal GH study. All children were naïve to GH treatment at the start of the study. Eight patients receiving thyroxin replacement therapy at start of the study were excluded (8/248) but are described separately.
All participants were followed at the Dutch PWS Reference Center in Rotterdam and received multidisciplinary care by the PWS team in collaboration with pediatric endocrinologists and pediatricians in other Dutch hospitals. The study protocols were approved by the Medical Ethics Committee of the Erasmus University Medical Center. Written informed consent was obtained from parents and children older than 12 years. Assent was obtained from children younger than 12 years. The study was conducted according to the guidelines of the Declaration of Helsinki II.20
Design
This is a 2-year RCT and a 10-year longitudinal GH study. Children in the GH group and the 10-year longitudinal GH study were treated with 1.0 mg GH/m²/day (∼0.035 mg/kg/day). At each visit, GH dose was adjusted to their body surface area and serum insulin-like growth factor-1 levels were kept below 3 standard deviation score (SDS).
Anthropometrics
Standing height was measured in centimeters using a Harpenden stadiometer and supine length with Harpenden Infantometer (Holtain Ltd., Crosswell, United Kingdom). Measurements were performed by the PWS team. Body weight was measured in kilograms on a calibrated electronic digital scale (Servo Balance KA-20-150S; Servo Berkel Prior, Katwijk, The Netherlands). Height, weight, and body mass index (BMI) SDSs were calculated with Growth Analyzer RCT 4.1 (available at www.growthanalyser.org), based on Dutch reference values.21,22
Assays
Fasting blood samples were annually collected for assessment of FT4, T3, and TSH. Blood samples were measured in the Biochemical and Endocrine laboratories of the Erasmus University Medical Center, Rotterdam. Serum FT4, T3, and TSH levels were determined by Vitros Eci technology (Otrho-Clinical Diagnostics, Amersham, United Kingdom) before February 1, 2019, with intra- and interassay coefficient of variation (CV) of 3%-7% and 5%-10%, respectively. Between February 1, 2019, and October 1, 2022, Fujirebio Lumipulse G1200 technology was used, with a total CV of ≤7.1%. Thyroid hormone SDSs were calculated according to age-matched Dutch reference values.23
Statistical analysis
Statistical analyses were performed with SPSS version 27.0 (SPSS Inc. Chicago, IL). Clinical characteristics are presented as median (interquartile range [IQR]). Mann–Whitney U tests and χ2 tests were used to compare the baseline characteristics between the GH-treated patients and untreated controls. Sex and genotypic differences in thyroid hormone levels at baseline and differences between groups over time were calculated by Mann–Whitney U tests. Differences within groups were calculated using Wilcoxon signed rank test. The number of available data during our 10-year study at baseline, 6 years, and 10 years was 211/138/88 for FT4 and TSH, and at baseline and 6 years, it was 116/61 for T3. To take missing values into account, we used linear mixed model analyses to calculate changes over time, with thyroid hormone levels measured at each time point as dependent variable with an unstructured covariance matrix. The effects are presented as estimated marginal means (95% CI). The effects of age, sex, and genotype on thyroid hormone levels over time were investigated using these variables as factors (in case of nominal or ordinal variables) or covariates (in case of scale variables) in the model. Differences were considered significant if the P-value was <.05.
Results
Two-year RCT
Baseline characteristics
Table 1 shows the baseline characteristics of 49 children with PWS. Thirty children (15 boys, 15 girls) were included in the GH group. Median (IQR) age was 7.44 (5.47-11.80) years. Median (IQR) serum FT4 was −0.89 (−1.29 to −0.31) SDS, median (IQR) T3 was 0.24 (−0.26-0.90) SDS, and median (IQR) TSH was −0.27 (−0.53-0.34) SDS. Nineteen children (7 boys, 12 girls) were included in the untreated control group. Median (IQR) age was 6.04 (4.56-7.39) years. Median (IQR) FT4 was −0.51 (−1.03-0.34) SDS, median (IQR) T3 was 0.24 (−0.56-0.83) SDS, and median (IQR) TSH was 0.27 (−0.56-0.62) SDS.
Clinical characteristics and serum thyroid hormone levels before start GH treatment.
| 2-year RCT | 10-year GH study | ||||
|---|---|---|---|---|---|
| GH group | Control group | P-value | |||
| Number | 30 | 19 | 240a | ||
| Sex (M/F) | 15/15 | 7/12 | .37 | 128/112 | |
| Age (years) | 7.44 (5.47-11.80) | 6.04 (4.56-7.39) | .04 | 1.27 (0.54-4.17) | |
| Genetic subtype, N (%) | .72 | ||||
| Deletion | 14 (46.7) | 6 (26.3) | 119 (49.6) | ||
| mUPD | 11 (36.7) | 10 (52.6) | 99 (41.3) | ||
| ICD | 3 (10.0) | 1 (5.3) | 9 (3.8) | ||
| Subtype unknown | 2 (6.7) | 2 (10.5) | 13 (5.4) | ||
| Anthropometry | |||||
| Height (SDS) | −2.09 (−3.07 to −1.74) | −2.54 (−3.31 to −1.89) | .50 | −1.84 (−2.67 to −1.00) | |
| Head circumference (SDS) | −0.79 (−1.49 to −0.04) | −0.60 (−1.24 to 0.32) | .56 | −0.99 (−1.55 to −0.32) | |
| BMI (SDS) | 1.35 (0.13 to 2.28) | 1.13 (0.75 to 1.74) | .87 | −0.14 (−1.42-1.22) | |
| Body composition | |||||
| Fat percentage (SDS) | 1.79 (1.20-2.28) | 1.41 (1.09-1.74) | .11 | 1.34 (−0.08-1.88) | |
| Lean body mass (SDS) | −2.53 (−2.82 to −1.86) | −2.40 (−2.77 to −1.69) | .55 | −1.93 (−2.85 to −0.79) | |
| Thyroid function tests | |||||
| FT4 | pmol/L SDS | 15.8 (14.35-17.90) −0.89 (−1.29 to −0.31) | 17.15 (14.78-17.70) −0.51 (−1.03-0.34) | .47 | 15.3 (13.90-17.00) −1.03 (−1.42 to −0.56) |
| T3 | nmol/L SDS | 2.57 (2.28-2.95) 0.24 (−0.26-0.90) | 2.62 (2.21-2.92) 0.24 (−0.56-0.83) | .66 | 2.64 (2.34-2.92) 0.19 (−0.30-0.74) |
| TSH | mU/L SDS | 1.79 (1.55-2.55) −0.27 (−0.53-0.34) | 2.43 (1.53-2.97) 0.27 (−0.56-0.62) | .31 | 2.29 (1.64-3.45) 0.16 (−0.43-0.89) |
| T4 | nmol/L SDS | 94.5 (85.25-111.75) −0.19 (−0.68-0.44) | 100.50 (92.25-118.25) −0.49 (−1.03-0.34) | .74 | 97 (84.00-109.75) −1.08 (−1.80 to −0.14) |
Data expressed as median (IQR). In 10-year GH study, FT4 and TSH levels were available in 211 children and T3 and T4 levels were available in 116 children. Reference values23: FT4 (pmol/L): age 5 years, 13.96-24.81; age 8 years, 13.39-24.07; age 12 years, 12.72-23.28. TSH (mU/L): age 5 years, 0.56-5.41; age 8 years, 0.55-5.31; age 12 years, 0.53-5.16. T3 (nmol/L): age 5 years, 2.02-3.26; age 8 years, 2.01-3.11; age 12 years, 1.84-2.96.
Abbreviations: mUPD, maternal uniparental disomy; ICD, imprinting center defect; RCT, randomized controlled GH trial; GH, growth hormone; M/F, male/female; SDS, standard deviation score; BMI, body mass index; IQR, interquartile range.
aIncluding 30 of the RCT.
Median age was higher in the GH group compared to the untreated control group (P = .04). The other baseline characteristics and thyroid hormone levels were not significantly different between the GH and the control group.
Thyroid hormone levels during the 2-year RCT
Table 2 and Figure 1 show the course of serum thyroid hormone levels during 2 years of GH treatment in comparison with untreated controls. In the GH group, FT4 SDS significantly decreased in the first 6 months of GH treatment (P < .001), while it did not significantly decrease in the untreated controls (P = .07). At 2 years, FT4 SDS in the GH group was still significantly lower compared to baseline (P = .01), while it was not significantly different in the untreated controls (P = .17). The repeated measurement analysis showed that in the GH group, a younger age was associated with a higher FT4 SDS (ß = −.06, SE = 0.03, P = .03) during 2 years, while in the control group, no age effect was found. In both groups, no effect of sex or genotype on the course of FT4 SDS was found.
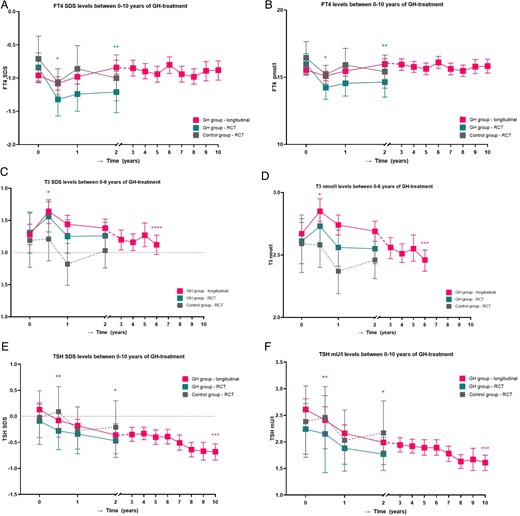
Thyroid hormone levels between 0 and 10 years of GH treatment. A. FT4 SDS levels between 0 and 10 years of GH treatment. B. FT4 pmol/L levels between 0 and 10 years of GH treatment. C. T3 SDS levels between 0 and 6 years of GH treatment. D. T3 nmol/L levels between 0 and 6 years of GH treatment. E. TSH SDS levels between 0 and 10 years of GH treatment. F. TSH mU/L levels between 0 and 10 years of GH treatment. Longitudinal changes in estimated marginal means with 95% CI in FT4 SDS (A), FT4 (B), T3 SDS (C), T3 (D), TSH SDS (E), and TSH (F) in GH treatment group from RCT (n = 30), control group from RCT (n = 19), and longitudinal GH group (n = 240). *P < .001; **P = .01. These P-values are compared to baseline. ***P < .001; ****P < .05. These P-values are compared to after 2 years of GH treatment.
Thyroid hormone levels during 2-year RCT and during first 2 years of longitudinal GH study.
| Baseline | After 6 months | P-valuea | After 1 year | After 2 years | P-valueb | |
|---|---|---|---|---|---|---|
| FT4 pmol/L | ||||||
| GH group RCT | 15.97 (15.16-16.77) | 14.23 (13.36-15.11) | 14.55 (13.60-15.50) | 14.64 (13.52-15.76) | ||
| Control group RCT | 16.45 (15.25-17.66) | 15.20 (14.51-15.89) | 15.91 (14.66-17.16) | 15.42 (14.19-16.65) | ||
| Longitudinal GH group | 15.53 (15.18-15.88) | 15.10 (14.74-15.46) | 15.46 (15.09-15.83) | 15.99 (15.61-16.38) | ||
| FT4 SDS | ||||||
| GH group RCT | −0.84 (−1.07 to −0.62) | −1.32 (−1.57 to −1.08) | .00 | −1.24 (−1.50 to −0.97) | −1.21 (−1.52 to −0.91) | .01 |
| Control group RCT | −0.71 (−1.04 to −0.37) | −1.06 (−1.25 to −0.86) | .07 | −0.86 (−1.20 to −0.51) | −1.00 (−1.34 to −0.65) | .17 |
| Longitudinal GH group | −0.96 (−1.06 to −0.87) | −1.08 (−1.18 to −0.98) | .07 | −0.98 (−1.09 to −0.88) | −0.84 (−0.94 to −0.73) | .11 |
| T3 nmol/L | ||||||
| GH group RCT | 2.61 (2.43-2.79) | 2.73 (2.60-2.86) | 2.56 (2.41-2.70) | 2.55 (2.43-2.67) | ||
| Control group RCT | 2.59 (2.36-2.82) | 2.58 (2.40-2.77) | 2.37 (2.19-2.55) | 2.46 (2.31-2.61) | ||
| Longitudinal GH group | 2.67 (2.58-2.76) | 2.85 (2.75-2.95) | 2.74 (2.66-2.82) | 2.69 (2.61-2.77) | ||
| T3 SDS | ||||||
| GH group RCT | 0.31 (−0.01-0.63) | 0.56 (0.32-0.79) | .08 | 0.25 (−0.01-0.51) | 0.26 (0.06-0.47) | .67 |
| Control group RCT | 0.19 (−0.23-0.61) | 0.21 (−0.13-0.54) | .79 | −0.18 (−0.51-0.14) | 0.03 (−0.24-0.30) | .35 |
| Longitudinal GH group | 0.28 (0.12-0.44) | 0.64 (0.45-0.82) | .00 | 0.44 (0.30-0.58) | 0.38 (0.24-0.52) | .94 |
| TSH mU/L | ||||||
| GH group RCT | 2.24 (1.77-2.72) | 2.15 (1.42-2.87) | 1.88 (1.58-2.18) | 1.77 (1.46-2.08) | ||
| Control group RCT | 2.38 (1.71-3.05) | 2.46 (1.87-3.04) | 2.03 (1.45-2.60) | 2.17 (1.57-2.77) | ||
| Longitudinal GH group | 2.61 (2.41-2.81) | 2.41 (2.17-2.66) | 2.16 (2.00-2.32) | 1.99 (1.83-2.14) | ||
| TSH SDS | ||||||
| GH group RCT | −0.09 (−0.41-0.23) | −0.28 (−0.64-0.07) | .11 | −0.34 (−0.63 to −0.06) | −0.47 (−0.79 to −0.14) | .37 |
| Control group RCT | −0.02 (−0.54-0.49) | 0.09 (−0.40-0.57) | .75 | −0.27 (−0.72-0.18) | −0.21 (−0.72-0.30) | .80 |
| Longitudinal GH group | 0.13 (0.00-0.26) | −0.08 (−0.23-0.08) | .01 | −0.18 (−0.31 to −0.06) | −0.36 (−0.50 to −0.21) | .00 |
Data are expressed as estimated marginal means (95% CI).
Abbreviations: RCT, randomized controlled GH trial; GH, growth hormone; SDS, standard deviation score.
aP-value of difference between 6 months and baseline.
bP-value of difference between 2 years and baseline.
The GH group showed an increase in T3 SDS during the first 6 months of GH treatment, albeit not significantly (P = .08), while it remained unchanged in untreated controls (P = .93). At 2 years, T3 SDS was not significantly different compared to baseline in both the GH and the control group (P = .67 and P = .35, respectively). During 2 years of GH treatment, the course of T3 SDS was lower in girls compared to boys, with a mean difference of 0.41 SDS (P = .02). In the control group, no effect of sex on the course of T3 SDS was found. In both groups, no effect of age and genotype on the course of T3 SDS was found.
In both the GH group and the control group, TSH SDS was not significantly different after 6 months and 2 years compared to baseline. In both groups, no effect of age, sex, or genotype on the course of TSH SDS was found.
Ten-year longitudinal GH study
Baseline characteristics
Table 1 shows the baseline characteristics of 240 children with PWS (128 boys, 112 girls). Median (IQR) age at start of GH treatment was 1.27 (0.54-4.17) years. Median (IQR) FT4 was −1.03 (−1.42 to −0.56) SDS.
We did not find any difference in FT4, TSH, and T3 SDSs between boys and girls. FT4 SDS was significantly lower in patients with a deletion compared to patients with a mUPD or ICD (P = <.001), with a median of −1.17 and −0.86 SDSs, respectively. T3 and TSH SDSs were not different between the genetic subtypes.
FT4 and T3 SDS levels did not correlate with age, but there was a weak inverse correlation between TSH SDS and age (−0.15, P = .03). FT4, T3, and TSH SDSs and T3/FT4 did also not correlate with BMI. FT4 and TSH SDSs were not correlated with nutritional phases in a subgroup of 27 children where these phases were determined. T3 SDS was not available in this subgroup.
Thyroid hormone levels during first 2 years of GH treatment
Because of the changes in thyroid hormone levels in our 2-year RCT, we first investigated the thyroid hormone levels during the first 2 years of GH treatment in the longitudinal study, but now in a much larger group of children with PWS. In addition, we compared this larger group with the untreated controls from our 2-year RCT.
Table 2 and Figure 1 show the course of thyroid hormone levels during the first 2 years of GH treatment. FT4 SDS decreased during the first 6 months, albeit not significantly (P = .07), but FT4 levels were not significantly different compared to untreated controls in our RCT (P = .99). At 2 years, FT4 SDS in the GH group was not significantly different compared to baseline and untreated controls (P = .11 and P = .13, respectively).
T3 SDS increased during the first 6 months, resulting in higher levels at 6 months compared to baseline (P < .001), but T3 levels were not significantly different compared to untreated controls (P = .10). At 2 years, T3 SDS in the GH group was not significantly different compared to baseline (P = .94), but T3 SDS was higher in the GH group compared to untreated controls (P = .01).
In the first 2 years of GH treatment, TSH SDS decreased (P < .001), but at 2 years, it was not significantly different between the GH group and the untreated controls (P = .60).
Thyroid hormone levels between 2 and 10 years of GH treatment
Table 3 and Figure 1 show the course of thyroid hormone levels from 2 to 10 years of GH treatment. Estimated mean (95% CI) FT4 SDS did not change during these 8 years of GH treatment, being −0.87 (−0.98 to −0.77) after 2 years and −0.88 (−1.03 to −0.74) after 10 years (P = .13). Estimated mean (95% CI) T3 SDS decreased from 0.37 (0.23-0.52) SDS after 2 years to 0.12 (−0.03-0.27) SDS after 6 years of GH treatment (P = .02). Estimated mean (95% CI) TSH SDS decreased, being −0.35 (−0.50 to −0.21) after 2 years and −0.68 (−0.84 to −0.53) after 10 years (P < .001). All thyroid hormone levels remained within the normal range during the 10 years of GH treatment.
Thyroid hormone levels during long-term GH treatment in 240 children with PWS.
| After 2 years | After 3 years | After 4 years | After 5 years | After 6 years | After 7 years | After 8 years | After 9 years | After 10 years | P-valuea | |
|---|---|---|---|---|---|---|---|---|---|---|
| FT4 pmol/L | 15.87 (15.49-16.24) | 15.95 (15.51-16.38) | 15.77 (15.36-16.18) | 15.63 (15.19-16.06) | 16.10 (15.65-16.56) | 15.62 (15.18-16.05) | 15.48 (15.06-15.91) | 15.79 (15.27-16.32) | 15.83 (15.31-16.35) | .13 |
| FT4 SDS | −0.87 (−0.98 to −0.77) | −0.85 (−0.97 to −0.73) | −0.90 (−1.01 to −0.78) | −0.94 (−1.06 to −0.82) | −0.80 (−1.06 to −0.82) | −0.94 (−1.06 to −0.82) | −0.98 (−1.09 to −0.86) | −0.89 (−1.04 to −0.75) | −0.88 (−1.03 to −0.74) | .13 |
| T3 nmol/L | 2.67 (2.59-2.76) | 2.56 (2.47-2.64) | 2.51 (2.44-2.59) | 2.55 (2.45-2.66) | 2.46 (2.37-2.54) | .00 | ||||
| T3 SDS | 0.37 (0.22-0.52) | 0.20 (0.04-0.35) | 0.16 (0.03-0.29) | 0.27 (0.09-0.46) | 0.12 (−0.03-0.27) | .02 | ||||
| TSH mU/L | 1.99 (1.83-2.15) | 1.94 (1.81-2.08) | 1.92 (1.79-2.05) | 1.89 (1.75-2.04) | 1.89 (1.75-2.04) | 1.78 (1.63-1.92) | 1.63 (1.50-1.76) | 1.67 (1.46-1.88) | 1.61 (1.46-1.75) | .00 |
| TSH SDS | −0.35 (−0.50 to −0.21) | −0.35 (−0.48 to −0.21) | −0.33 (−0.45 to −0.21) | −0.40 (−0.54 to −0.36) | −0.39 (−0.53 to −0.25) | −0.51 (−0.65 to −0.36) | −0.64 (−0.78 to −0.50) | −0.67 (−0.84 to −0.50) | −0.68 (−0.84 to −0.53) | .00 |
Data are expressed as estimated marginal means (95% CI).
Abbreviations: PWS, Prader–Willi syndrome; SDS, standard deviation score.
aP-value of the change from year 2 to 10 and from year 2 to 6 of GH treatment.
Patients with low FT4 levels at the start and during the 10-year study
The eight children that had been excluded from the 10-year study, because they were on thyroxin replacement therapy prior to the start of the study, were treated based on low FT4 levels. In 4 of them, T3 levels were measured before the start of thyroxin and these were all normal (Table S1).
Fifteen of the 240 participating children (6.3%) had a FT4 below −2 SDS at baseline, but only 1 patient (1/240, 0.4%) also had a T3 SDS below −2 SDS with a normal TSH SDS. During the first 2 years of GH treatment, 26/240 patients had once or occasionally a FT4 below −2 SDS, but all had a normal T3 SDS and TSH SDS. One patient started with thyroxin replacement therapy after 6 months of GH treatment at a regional hospital based on a FT4 SDS of −2.22. His T3 SDS was, however, −0.83. He had completely normal thyroid hormone levels after the stop of the thyroxin medication after a treatment period of 14 years. Between 2 and 10 years of GH treatment, 34 patients had once or occasionally a FT4 SDS below −2SDS, but all of them had T3 SDS and TSH SDS within normal range.
Discussion
To our knowledge, this is the first RCT in children with PWS investigating the effects of 2 years of GH treatment compared to no treatment on serum thyroid hormone levels. In addition, we describe the thyroid hormone levels during our prospective 10-year GH study in a large group of children with PWS. Our findings demonstrate that in the first 6 months of GH treatment, serum FT4 SDS significantly decreased in the GH group (P < .001), while T3 SDS increased (P = .08), indicating an increased peripheral conversion of FT4 to T3 after the start of GH treatment. In the untreated control group, FT4 and T3 SDS did not significantly change. The same course of FT4 SDS and T3 SDS was found during the first 6 months of 10-year GH study. From 2 up to 10 years of GH treatment, FT4 SDS levels remained stable and almost all children with PWS had FT4, T3, and TSH levels within the normal range. In the patients with a low FT4 level, all had normal TSH levels and only 1 also had a low T3 level, indicating that hypothyroidism is very rare in children with PWS. Based on our findings, we recommend to measure T3 when FT4 is low in children with PWS, particularly during the first months of GH treatment.
Our data show that the FT4 levels decreased in the first 6 months of GH treatment while T3 increased. FT4 and T3 did not significantly change in untreated controls. There are limited data about the effects of GH treatment compared to no treatment on thyroid hormone levels in children with PWS. We previously described in 4.5-year-old children with PWS a decrease in FT4 to low normal levels after 1 year of GH treatment, while T3 and TSH levels did not change and were normal.6 In the present study, we found only lower FT4 and higher T3 levels during the first months of GH treatment. A retrospective study showed that 1 month of GH treatment decreased serum FT4 levels in children with PWS and increased the ratio of FT3/FT4 and TSH levels.19 Studies in children with growth hormone deficiency (GHD) also showed a decrease in FT4 levels while T3 levels increased during GH treatment.16,24,25 All findings suggest that GH treatment increases the peripheral conversion of FT4 to T3 in the first months of treatment.
In our large 10-year study, FT4 SDS also decreased during the first months of GH treatment, but levels were similar after 2 years of GH treatment compared to baseline. Oto et al.9 also found similar FT4 levels in children with PWS after 1 and 2 years of GH treatment compared to baseline. Another study showed that after the change in the first month of GH treatment, all thyroid values returned to baseline levels after 3-12 months in children with GHD.24 Similarly, Seminara et al.26 showed temporary changes in FT4 and T3 levels in children with GHD, which disappeared during the second year of GH treatment.26 This suggests that the effect of GH treatment on the increased peripheral conversion of FT4 to T3 levels is transient.
Thyroid hormone levels during long-term GH treatment in children with PWS have not been reported. We found stable FT4 levels between 2 and 10 years of GH treatment and a decrease in T3 SDS toward more average values between 2 and 6 years of GH treatment. A study in children with GHD showed stable FT4 and T3 levels between 2 and 3 years of GH treatment.27 Our findings show that thyroid hormone levels remain stable and normal during long-term GH treatment in almost all children with PWS.
Twenty-five percent of the children had once or occasionally a FT4 SDS below −2 SDS during the GH treatment, but all had normal TSH levels and only 1 of 240 (0.4%) children also had a T3 level below −2 SDS. This occurred, however, only once. He started with thyroxin replacement therapy after 6 months of GH treatment, but had completely normal thyroid hormone levels after the stop of the thyroxin medication. The reported prevalence of hypothyroidism in children with PWS ranges from 0% to 32%,4-9 but in the various studies, a wide range of definitions was used to diagnose hypothyroidism. In previous papers, T3 levels are almost never reported. One study reported normal T3 levels in children with PWS who were diagnosed with hypothyroidism.28 In our study population, 12 patients were started with thyroxin replacement therapy by their pediatricians, based on low FT4 levels, but they did not have abnormalities in T3 and TSH levels at that point. The pediatricians decided not to cease the thyroxin medication, because there was insufficient data about thyroid hormone levels during long-term GH treatment and thyroxin replacement therapy was considered not to be harmful for children with PWS. Despite the importance of low FT4 levels in diagnosing hypothyroidism, our findings suggest that the combination of a moderately low FT4 level, along with a normal or slightly elevated T3 level and completely normal TSH level in children with PWS, may not justify the initiation of thyroxin replacement therapy.
Our studies have several strengths such as our 2-year RCT to investigate the effect of GH vs no treatment on the serum thyroid hormone levels in children with PWS. As the Dutch PWS Cohort study has been following patients with GH treatment since 2002, we could perform the first prospective 10-year GH study on serum thyroid hormone levels in a large group of children with PWS. There are some limitations. The number of children after 10 years was substantial but lower than at the start of GH treatment. This was due to the fact that children were GH treated for many years but not yet for 10 years. We took the missing values into account by using linear mixed model analyses to calculate changes over time. As serum T3 levels were not measured after 6 years of GH treatment, we could not evaluate T3 levels on the long term, but we do not expect considerable changes as levels remained stable between 2 and 6 years of GH treatment.
In conclusion, our findings suggest that GH treatment decreases FT4 levels, due to increased peripheral conversion of FT4 to T3 in the first months of treatment, but thereafter, FT4 and T3 normalize and remain stable during long-term GH treatment in almost all children with PWS. Based on our findings, we recommend to measure T3 when the FT4 level is low in children with PWS, particularly during the first months of GH treatment.
Acknowledgments
We express our gratitude to all children and parents for their enthusiastic participation in this study. We thank all collaborating pediatric endocrinologists, pediatricians, and other health-care providers.
Supplementary material
Supplementary material is available at European Journal of Endocrinology online.
Funding
This study was an investigator-initiated study, supported by an independent research grant from Pfizer. Pfizer was not involved in the conception or design of the study, nor in the collection, analysis or interpretation of data, writing the manuscript, or decision to submit the manuscript for publication.
Authors’ contributions
Demi Trueba-Timmermans (Conceptualization [lead], Data curation [lead], Formal analysis [lead], Writing—original draft [lead]), Lionne N. Grootjen (Writing—review & editing [supporting]), Gerthe Kerkhof (Supervision [supporting], Writing—review & editing [supporting]), Edmond Rings (Supervision [supporting], Writing—review & editing [supporting]), and Anita Hokken-Koelega (Project administration [lead], Supervision [lead], Writing—review & editing [supporting])
Conflict of interest: This is an investigator-initiated study for which A.C.S.H.-K. received an independent research grant from Pfizer for the 2-year randomized controlled GH study. The other authors declared no conflict of interest exists.
Data availability
The data sets generated during and/or analyzed during the current study are not publicly available but are available from the corresponding author on reasonable request.
