


Abstract
Women with premature ovarian insufficiency (POI) lack oestrogen, which is a key determinant of bone growth, epiphyseal closure, and bone tissue organisation. Although dual-energy X-ray absorptiometry (DXA)–derived areal bone mineral density (BMD) remains the gold standard for fracture risk evaluation, it does not fully characterise the skeletal abnormalities present in these women. Hence, we aimed to assess hip/femur anatomy, strength, and geometry and femoral alignment using advanced hip analysis (AHA).
We conducted a cross-sectional, case–control study including 89 women with spontaneous normal karyotype POI (s-POI) or iatrogenic POI (i-POI), aged 20-50 years compared with 89 age- and body mass index (BMI)–matched population-based female controls. Hip anatomy, strength, geometrical parameters, and femur alignment were measured using hip DXA images and Lunar AHA software. Femoral orientation angle (FOA) was quantified as the overall orientation of the femur with respect to the axis of the forces transmitted from the upper body.
The median age of POI diagnosis was 35 (18-40) years; the mean POI duration at the time of DXA was 2.07 (range 0-13) years, and 84% of POI women received oestrogen therapy. Areal BMD at all sites was significantly lower in the POI group (all P < .05). Indices of compressive and bending strength were lower in women with POI compared with controls, specifically the cross-sectional area (CSA, mm2) and section modulus (SM, mm3) (139.30 ± 29.08 vs 157.29 ± 22.26, P < .001 and 665.21 ± 129.54 vs 575.53 ± 150.88, P < .001, respectively). The FOA was smaller (124.99 ± 3.18) in women with POI as compared with controls (128.04 ± 3.80; P < .001) at baseline and after adjusting for height and femoral neck BMD.
Alongside lower BMD at multiple sites, the femora of women with POI demonstrate reduced strength and a misalignment with forces transmitted from the upper body. Further research is needed to establish the role of these newly identified features and their role in fracture risk prediction in this population.
Women with premature ovarian insufficiency (POI) lack oestrogen, which is important in the regulation of skeletal homeostasis, bone micro- and macroarchitecture, and determining skeletal fragility. As an adjunct to bone mineral density (BMD), evaluating dual-energy X-ray absorptiometry–derived advanced hip analysis (AHA) parameters that analyse the hip structure and geometry may provide additional information about bone health in this cohort. In this study, women with POI, due to spontaneous or iatrogenic causes, showed lower strength indices and altered femur geometry that may impact load transfer/mechanical loading and increased susceptibility to fractures. Further studies are needed to assess the utility of these parameters in fracture risk prediction in women with POI.
Introduction
Premature ovarian insufficiency (POI) is the loss of ovarian function before the age of 40 years and affects 3%-4% of women. Women with POI face multiple complications including infertility, compromised musculoskeletal health, increased cardiometabolic risk, and neurocognitive decline, but skeletal fragility is most feared.1 The reported prevalence of low bone mass in women with POI ranges from 8% to 15%, and its severity is related to the degree and duration of oestrogen deficiency.2,3 Women with early menopause (before 45 years) and POI also have an increased fracture risk compared with women who undergo menopause at the typical age: van Der Voort et al.4 reported a 1.5-fold greater fracture risk in women with POI compared with age-matched controls and a greater than 2-fold increase in vertebral5 and hip fracture risk6 has also been demonstrated in this cohort. Although significant progress has been made in identifying women with POI with low bone mass, large knowledge gaps in our understanding of bone fragility and fracture risk prediction in this cohort remain.
Traditionally, bone health assessment has relied on dual-energy X-ray absorptiometry (DXA), which provides 2D areal bone mineral density (BMD). However, DXA, while explaining 60%-80% of bone strength, lacks critical microarchitecture and geometry information. Moreover, low BMD does not seem to entirely explain the increased fracture risk, as many women with POI who sustain fragility fractures have T-scores > −2.5, while 10%-20% have normal BMD7; these data are similar to the fragility fracture statistics in women without POI8,9 and suggest that additional skeletal factors may contribute to fracture susceptibility. To date, bone microarchitecture in POI remains an understudied area, and bone geometry and strength have not been studied in these women.
The concept of skeletal fragility is evolving. Although previously considered synonymous with low bone mass, modern diagnostic techniques have enabled researchers to identify aberrant bone microarchitecture and bone disorganisation10 as additional significant pathogenic mechanisms responsible for skeletal fragility.10 Across the lifespan, oestrogen plays a significant role in bone growth, maturation, and remodelling11. It exerts its influence not only on acquiring bone mass and strength but also in shaping the organisation of skeletal tissue and fostering optimal interrelatedness between bones. A crucial aspect of this process is the requirement for precise alignment between bones, their components, and the body axes.10 In disorganised bone tissue, because components are incorrectly positioned, they abnormally transfer loads (forces) to each other causing damage. This triggers inflammation and a vicious cascade of events leading to abnormalities and fractures.10 Therefore, for an effective load transfer, it is essential that the femur is correctly positioned, demonstrating good alignment with the axis of forces transmitted from the upper body, which consistently have a vertical direction. It is noteworthy that the forces acting on the hip joint are predominantly vertical, given the relatively insignificant contribution of muscular components, as emphasised by Pauwels.12 In addition, a large cross-section of bone maximises compressive strength. To achieve these geometrical features, optimal longitudinal bone growth with a normal and well-timed epiphyseal fusion is needed, and oestrogen plays a key role in these processes13. The recognised spectrum of bone disease in POI women encompasses low bone mass14 and disrupted microarchitecture15; it is therefore cognisable that a reduction in oestrogen concentrations, as seen in POI women, will be associated with structural deficits, disrupted skeletal organisation, and misalignment.10 Despite the recognised impact of oestrogen on overall bone health, the effect of POI on bone geometry, strength skeletal organisation, and alignment of bones has not previously been studied. The primary objective of this study was to assess hip anatomy as a fundamental aspect of skeletal health and fragility among women with POI, expanding the investigation beyond the customary focus on BMDs.
Advanced hip analysis (AHA) is a useful technique that extends beyond areal BMD by analysing DXA-acquired hip images to obtain geometric, structural, and strength parameters.16 Existing data have shown a strong correlation between AHA-derived cortical parameters and quantitative computed tomography (QCT) of the hip for cross-sectional area (CSA), section modulus (SM), and cross-sectional moment of inertia (CSMI)17 and their ability to predict hip fractures.18,19 This technique is presently employed to assess hip geometry and strength parameters, aiding in our understanding of the increased risk of hip fractures within specific populations. In a study of osteoporotic fractures, Kaptoge et al.19 found that postmenopausal Caucasian women exhibited a notably lower hip SM and faster expansion of the proximal femur compared with men that may in turn lead to greater fragility in this group.19 Moreover, in patients with end-stage kidney disease (ESKD), Aleksova et al.20 demonstrated substantial reductions in cortical thickness (CT) at the femoral neck (FN), calcar, and femoral shaft, along with a higher buckling ratio (BR, 8.21 ± 4.6 vs 3.63 ± 1.42) when compared to age- and gender-matched controls. Additionally, several studies have employed AHA to identify an impaired skeletal load response in women with type 2 diabetes (T2DM), shedding light on the potential causes of increased fragility in this population.21–23
Advanced hip analysis not only provides geometry and strength indices but also assesses femoral alignment in relation to the vertical forces transmitted from the upper body, facilitating the evaluation of femoral load transfers from the upper body to the ground. In this study, we introduced the femoral orientation angle (FOA) as a measure of alignment, derived from the sum of angles alpha (α = the alpha angle denotes the alignment of the femoral shaft with the forces transmitted from the upper body) and theta (θ = angle of the intersection of the neck and shaft axes) to assess femur alignment (Figure 1), adapted from Ark et al.24 In addition to assessing BMD, our study aimed to compare hip structural, geometrical parameters, and femoral alignment between POI women and controls using AHA. We hypothesised that hypoestrogenism in women with POI would be associated with the following:
Reduced areal BMD.
Impaired skeletal/femur geometry with reduced compressive and bending strength.
Misalignment of the femur.
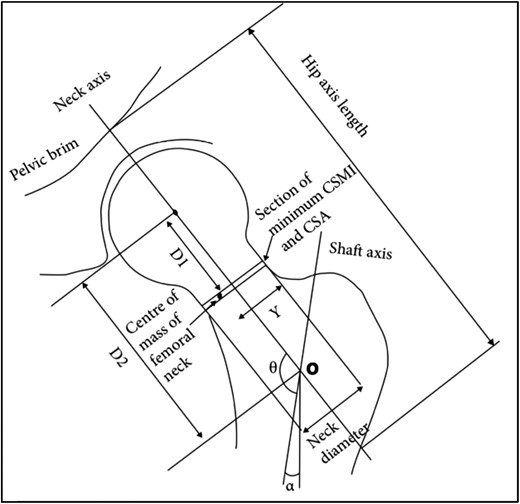
Diagram showing how geometric parameters were measured from 2D dual-energy X-ray absorptiometry (DXA) images in advanced hip analysis (AHA). Adapted from Ark et al.24
Methods
Study participants
Women with POI
Women aged 20-50 years with a diagnosis of POI who attended the Monash Health early menopause clinic between 2008 and 2022 and had 1 or more DXA scans at Monash Health were included in the study. Women with Turner syndrome (TS), hypogonadotropic hypogonadism, history of breast cancer, renal impairment with estimated glomerular filteration rate (eGFR) <50 mL/min, renal transplant, or those on antiresorptive therapy at the time of DXA scan were excluded (Figure 2). The study was approved by the Monash Health Human Research Ethics Committee (Reference number 07062A). Informed consent was obtained from all individual participants included in this study. All patients were informed that de-identified data were collected for research purposes and given an opportunity to opt out.
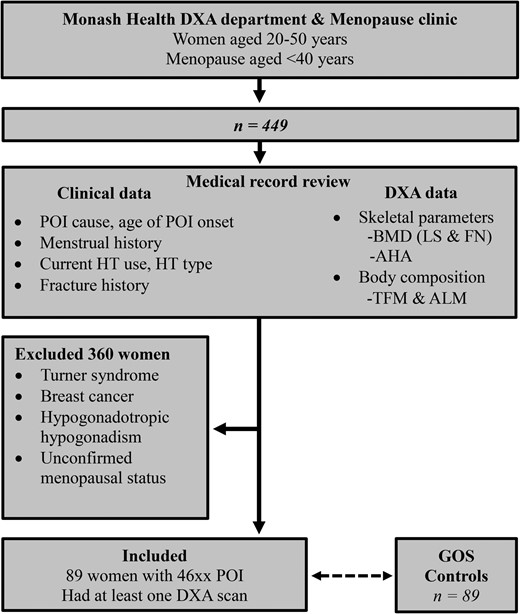
Study scheme. Twenty-seven patients had non-breast cancer malignancy, 27 patients had oophorectomies, and 17 had chemotherapy ± radiotherapy. BMD, bone mineral density; AHA, advanced hip analysis; HT, hormone therapy; ALM, appendicular lean mass; DXA, dual-energy X-ray absorptiometry; POI, premature ovarian insufficiency; GOS, Geelong Osteoporosis Study; FN, femoral neck; LS, lumbar spine; TFM, total fat mass.
Demographic and clinical data such as age, cause of POI, comorbidities, fractures, and medication use were verified from hospital medical records and the hospital radiology database. Additionally, details on hormone therapy (HT) use, including age at initiation and ongoing use at the time of DXA scanning, were also collected. All prevalent fractures were confirmed from medical records or from the hospital's radiology database. Participants’ height (m) and weight (kg) were measured with a wall-mounted stadiometer on the day of DXA scan.
During the study period, all DXA scans for the POI women were performed at Monash Health on a single Lunar Prodigy device (GE Healthcare, 133 Piscataway, NJ) using software version 11 to measure skeletal and body composition parameters. The DXA images were obtained following the standard protocol recommended by the manufacturer. To achieve consistent measurements of hip geometry across all individuals, a dedicated angled foot support was placed between the patient’s legs, abducting the leg to be scanned approximately 15° away from the midline. Subsequently, the whole leg was internally rotated through 25°, resulting in the greater trochanter anteriorly and the lesser trochanter posteriorly, and the FN was aligned parallel to the scanner tabletop. Proximal femur (left) morphological features were analysed using AHA, from DXA-derived hip images. Bone mineral density measurements were performed for the spine, left FN, and hip regions. Furthermore, whole-body DXA scans were conducted to assess body composition parameters, including total fat mass (TFM, in kg) and appendicular lean mass (ALM, in kg), and both parameters were also adjusted for height to yield fat mass index (FMI, TFM/height2 in kg/m2) and appendicular lean mass index (ALMI, ALM/height2 in kg/m2), respectively. The coefficient of variation (CV) for percentage body fat of a total body phantom measured weekly was 3.11%.
The AHA parameters were obtained from DXA proximal femur images utilising the GE Lunar DXA hip image software, originally developed by Beck et al.25,26 (Figure 1). This software enables the extraction of 2 key sets of information:
Geometric parameters of the femur, including CT and cortical ratios at the femur neck and shaft.
Strength measures within the FN region of interest (ROI), encompassing the following:
Cross-sectional area, providing an index of resistance to axial forces, representing the mineralised bone surface area in a cross-section.
Cross-sectional moment of inertia, serving as an estimate of resistance to bending forces in a cross-section.
Section modulus, an index of the strength of bending.
Buckling ratio, which serves as an index of susceptibility to local cortical buckling under compressive loads.
In this study, we also utilised the AHA method to measure the FN–shaft angle (θ) and the alpha angle (α). The alpha angle represents the angle formed by the femoral shaft axis in relation to the vertical line passing through point “O” (Figure 1). This point denotes the intersection between the FN and the femoral shaft axes. As the alpha angle is derived from 2 invariant axes—the vertical line passing through a single point (O) and the shaft axis, it is unlikely to be influenced by the patient’s position, soft tissue coverage, or variations in physical dimensions. By combining the θ and α angles, we derived the FOA, calculated as the sum of the neck–shaft angle and the vertical axis angle, i.e. FOA = α + θ. The FOA is an indicator of how the femur angulates to align with the forces transmitted from the upper body and thus indicates femoral alignment with upper body forces.
Controls
The data for control participants were obtained from the Geelong Osteoporosis Study (GOS), an Australian longitudinal, population-based study, which aims to define the epidemiology of osteoporosis and fracture risk in men and women; a comprehensive description of the study has been provided elsewhere.27 We selected 89 age- and BMI-matched control women from the GOS cohort. A Lunar DPX-L (Lunar; Madison, WI, United States) was used for the women's skeletal and body composition assessments, including lumbar spine (LS) BMD, FN BMD, TFM, and ALM.
Geometric parameters, indices of strength and FOA for controls, were obtained using AHA software25 that retrospectively analysed GOS images of the left femur. Body weight and height were documented at the time of DXA scan. Prevalent fractures were ascertained from history and confirmed radiologically where possible. The provision of de-identified data for this study was approved by the Human Research Ethics Committee of Barwon Health.
Statistical analysis
Categorical data were expressed as percentages and continuous data as mean ± SD or as median and 25th-75th interquartile range (IQR). Differences between groups were determined using the t-test for 2 groups and the ANOVA for multiple groups for normally distributed continuous variables with Bonferroni's method for post hoc analyses. The Mann–Whitney U test was used for non-parametric variables between the 2 groups and the Kruskal–Wallis for multiple groups. Chi-square and Fisher's exact test were used for categorical variables. P < .05 was considered statistically significant. Skeletal, body composition, and AHA parameters were adjusted for potential confounders including height and ethnicity using univariate general linear model (level of significance P < .05).
Results
Clinical characteristics
Eighty-nine women with POI were included in the analysis, and their demographics, clinical, DXA, and AHA parameters were compared with 89 age- and BMI-matched controls. Clinical characteristics of the participants are reported in Table 1. The POI group had an ethnically diverse population, including 64 Caucasian, 15 Asian, 6 South Asian as in Table 1, and 4 African subjects. In the POI group, 39 and 50 women had spontaneous normal karyotype POI (s-POI) and iatrogenic POI (i-POI), respectively. In the POI group, 50 and 39 women had s-POI and i-POI, respectively. Most women in the control group were Caucasian (99%) and were significantly taller than POI women.
Comparison of demographic data and body composition parameters between POI women and controls.
| Control n = 89 | All POI n = 89 | p-value* | s-POI n = 39 | i-POI n = 50 | p-value! | ||
|---|---|---|---|---|---|---|---|
| Age (years) | 34.79 (30.76-37.78) | 35.00 (30.00, 38.00) | .76 | 34.00 (29.00-37.00) | 35.00 (31.00-38.50) | .75 | |
| Ethnicity | Caucasian | 88a (99%) | 64 (72%) | <.001 | 24 (62%) | 40 (80%) | <.001 |
| Asian | 0 | 15 (17%) | 9 (23%) | 6 (12%) | |||
| African | 0 | 4 (4%) | 4 (10%) | 0 (0%) | |||
| South Asian | 0 | 6 (7%) | 2 (5%) | 4 (8%) | |||
| BMI (kg/m2) | 25.89 (22.59, 31.21) | 25.60 (22.10, 30.10) | .45 | 24.80 (22.10, 29.10) | 26.55 (22.25, 33.00) | .14 | |
| Height (m) | 1.65 ± 0.06 | 1.63 ± 0.075 | .008 | 1.61 ± 0.09 | 1.63 ± 0.06 | .005 | |
| Fracture history | 9 (10%) | 17 (19%) | .09 | 6 (15%) | 8 (16%) | .53 | |
| Hormone therapy useb | NA | 72/86 (83.72%) | NA | 28/39 (74%) | 46/50 (93%) | .020 | |
| Bone density | |||||||
| LS BMD (g/cm2) | 1.23 (1.16, 1.34) | 1.12 (1.01, 1.22) | <.001c | 1.11 (0.97, 1.22) | 1.13 (1.05, 1.25) | <.001c | |
| FN BMD (g/cm2) | 1.03 ± 0.12 | 0.96 ± 0.17 | <.001c | 0.93 ± 0.16 | 0.98 ± 0.17 | .003c | |
| Total hip BMD (g/cm2) | 1.05 ± 0.12 | 0.97 ± 0.16 | <.001c | 0.94 ± 0.16 | 0.99 ± 0.17 | <.001c | |
| Body composition | |||||||
| ALM (kg) | 19.23 (17.62, 21.17) | 16.32 (14.18, 19.30) | <.001 | 15.95 (14.31, 17.98) | 16.952 (14.10, 19.40) | <.001 | |
| ALMI (kg/m2) | 7.01 (6.46, 7.56) | 6.17 (5.52, 6.89) | <.001 | 6.19 (5.57, 6.82) | 6.15 (5.50, 7.10) | <.001 | |
| TFM (kg) | 25.61 (19.54, 36.75) | 26.18 (20.61, 35.79) | .70 | 26.12 (19.54, 33.14) | 26.39 (21.032, 38.24) | .57 | |
| TFMI (kg/m2) | 9.32 (7.24–13.79) | 10.53 (7.93, 12.93) | .31 | 10.38 (7.90, 12.93) | 10.60 (7.98, 14.78) | .38 | |
Abbreviations: POI, premature ovarian insufficiency; s-POI, spontaneous premature ovarian insufficiency; i-POI, iatrogenic premature ovarian insufficiency; BMI, body mass index; LS, lumbar spine; BMD, bone mineral density; FN, femoral neck, ALM, appendicular lean mass; ALMI, appendicular lean mass index; TFM, total fat mass; TFMI, total fat mass index. Bold values suggest significant p values. p-value*, level of significance between control and all POI group; p-value!, level of significance between control, s-POI and i-POI groups.
aEthnicity was unknown for 1 woman.
bTotal n = 54; s-POI = 22, i-POI n = 32; data not available in n = 6.
cRemained significant after adjusting for height.
In the POI group, 11 were smokers; 1 had coeliac disease, 1 had transient hyperthyroidism, and 1 had a history of steroid use (<3 months). Among the i-POI participants, 4 had non-gynaecological malignancies, 13 had bilateral oophorectomies, and 13 had chemo ± radiotherapy. The average age of menarche in the POI group was 13 years, and the duration of amenorrhoea before the DXA scan was 2 years. Most women with POI (n = 72/86) were using HT; menopausal hormone therapy (MHT) was used by 78%, and 22% of women used the combined oral contraceptive pill (COCP). Areal BMD at all sites, including LS, FN, and total hip, was significantly lower in the POI group (all P < .05); among these, differences at the FN and the total hip remained significant after adjustment for height. The ALMI was also lower in the POI group (P < .001), although the FMI did not differ significantly between the controls and POI participants.
To account for the diverse ethnicities within our cohort, we conducted supplementary analyses of skeletal and body composition factors, focusing on specific subgroups. We compared Caucasian, Asian, and all non-Caucasian women with POI to our control group consisting solely of Caucasian individuals. Consistent with the overall findings in the entire POI cohort, the analysis of the controls with POI subgroups showed significantly lower BMD at L1-L4, FN, and total hip and a lower ALMI, while the TFMI did not show any significant difference among the groups (Table 2).
Subgroup analyses of skeletal and body composition parameters in controls vs POI women according to ethnicities.
| Parameters | Control | Caucasian POI | p-value* | Non-Caucasian POI | p-value! | Asian POI | p-value# | |
|---|---|---|---|---|---|---|---|---|
| BMD (g/cm2) | Spine | 1.23 (1.16, 1.34) | 1.13 (1.03, 1.23) | <.001 | 1.08 (0.98, 1.160) | <.001 | 1.02 (0.95, 1.10) | <.001 |
| FN | 1.03 ± 0.12 | 0.98 ± 0.17 | .039 | 0.92 ± 0.16 | .003 | 0.87 ± 0.15 | <.001 | |
| Total hip | 1.05 ± 0.12 | 0.99 ± 0.17 | .018 | 0.92 ± 0.13 | <.001 | 0.88 ± 0.11 | <.001 | |
| Body composition | ALMI (kg/m2) | 7.01 (6.46, 7.56) | 6.38 (5.76, 6.91) | <.001 | 5.72 (5.38, 6.30) | <.001 | 5.67 (5.38, 6.21) | <.001 |
| TFMI (kg/m2) | 9.33 (7.24, 13.79) | 10.81 (8.04, 14.09) | .122 | 9.96 (7.78, 11.76) | .91 | 7.92 (5.59, 9.80) | .15 | |
Abbreviations: POI, premature ovarian insufficiency; BMD, bone mineral density; FN, femoral neck; ALMI, appendicular lean mass index; TFMI, total fat mass index. Bold values suggest significant p-value values.p-value*, level of significance between control, and Caucasian POI group; p-value!, level of significance between control and non-Caucasian POI and p-value#, level of significance between control and Asian POI groups.
Seventeen women in the POI group had a history of documented fractures; fracture details were available for 13/17 women, and the age groups were defined following Holloway et al.28 age categories for GOS cohort profiling. Among the 13 women with POI, 5 experienced traumatic fractures during midlife (25-50 years), 1 during young adulthood at the age of 20, 4 had fractures during childhood (0-12 years), and 3 experienced fractures during adolescence (13-19 years). Notably, only 1 woman sustained fractures after the onset of POI, which occurred after a skiing injury, involving the ankle and wrist. One participant had an L1 compression fracture with unknown circumstances, while others had traumatic fractures. In the control group, 9 women experienced fractures, with the majority of these being lower limb fractures. Most of these fractures occurred during midlife (7/9), with 1 each reported during adolescence and young adulthood. No hip fractures were reported in either POI or control subjects.
AHA parameters
Table 3 demonstrates the height- and ethnicity-adjusted mean values of AHA variables. The geometric parameters, including the hip axis length, BR, and CT at the neck did not differ significantly between the controls and POI participants (all P > .05). However, measures indicative of bone strength such as CSA, CSMI, and SM at the neck were significantly lower in the POI group than in the controls. Additionally, FOA was significantly smaller in women with POI. Impairment of these AHA parameters (CSA, CSMI, SM, and FOA) remained significant after adjusting for height and ethnicity.
AHA-derived skeletal parameters in controls vs POI women.
| Control n = 89 | All POI n = 89 | p* | ph | pe | s-POI n = 39 | i-POI n = 50 | p! | ph | pe | ||
|---|---|---|---|---|---|---|---|---|---|---|---|
| Geometrical parameters | |||||||||||
| Neck | Cortical width (mm) | 5.50 ± 2.20 | 5.11 ± 1.73 | .78 | .42 | .44 | 4.94 ± 1.60 | 5.23 ± 1.84 | .33 | .91 | .63 |
| Cortical ratio (%) | 18.69 ± 7.60 | 17.88 ± 5.79 | .91 | .56 | .72 | 17.66 ± 5.52 | 18.04 ± 6.04 | .70 | .99 | .56 | |
| Shaft | Cortical width (mm) | 5.15 ± 1.24 | 4.74 ± 1.18 | .025 | .03 | .04 | 4.73 ± 1.20 | 4.74 ± 1.48 | .02 | .24 | .06 |
| Cortical ratio (%) | 17.38 ± 3.80 | 16.64 ± 3.85 | .27 | .65 | .16 | 16.17 ± 4.46 | 16.67 ± 4.05 | .32 | .56 | .30 | |
| Strength indices | |||||||||||
| CSA (mm2) | 157.29 ± 22.26 | 139.30 ± 29.08 | <.001 | <.001 | <.001 | 132.31 ± 28.88 | 144.74 ± 28.33 | <.001 | <.001 | <.001 | |
| CSMI (mm4) | 10605 ± 2784.45 | 8848.45 ± 2771.68 | <.001 | .002 | <.001 | 8038.82 ± 2671.53 | 9479.96 ± 2723.01 | <.001 | .002 | <.001 | |
| SM (mm3) | 665.21 ± 129.54 | 575.53 ± 150.88 | <.001 | .002 | <.001 | 532.75 ± 144.66 | 6.8.89 ± 144.66 | <.001 | .002 | <.001 | |
| SI | 1.58 ± 0.44 | 1.390 ± 0.30 | .001 | <.001 | .001 | 1.41 ± 0.30 | 1.37 ± 0.30 | .005 | .004 | .005 | |
| Buckling ratio | 3.35 ± 1.32 | 3.35 ± 1.26 | .50 | .98 | .88 | 3.39 ± 1.39 | 3.31 ± 1.16 | .96 | 1.00 | .98 | |
| Measures of femoral alignment with the upper body | |||||||||||
| Shaft alignment (α) | 1.24 ± 3.72 | −2.34 ± 4.30 | <.001 | <.001 | <.001 | −5.11 ± 4.49 | −1.32 ± 3.90 | <.001 | <.001 | <.001 | |
| Neck shaft angle (θ) | 126.79 ± 4.13 | 127.34 ± 4.88 | .59 | .47 | .29 | 128.02 ± 5.74 | 126.80 ± 4.07 | .60 | .26 | .11 | |
| FOA (α + θ) | 128.04 ± 3.80 | 124.99 ± 3.18 | <.001 | <.001 | <.001 | 124.36 ± 3.22 | 125.48 ± 3.09 | <.001 | <.001 | <.00 | |
p-value*, level of significance between control and all POI group; p-value!, level of significance between control, s-POI and i-POI groups. ph adjusted for height; pe adjusted for ethnicity. Statistically significant values are reported in bold.
Abbreviations: POI, premature ovarian insufficiency; s-POI, spontaneous premature ovarian insufficiency; i-POI, iatrogenic premature ovarian insufficiency; AHA, advanced hip analysis; CSA, cross-sectional area; CSMI, cross-sectional moment of inertia; SM, section modulus; SI, strength index; FOA, femoral orientation angle; α, angle of shaft axis with respect to vertical.
Discussion
Premature ovarian insufficiency is a hypoestrogenic state associated with compromised bone health and increased fracture risk compared with healthy premenopausal women.4,29 To date, data describing femur strength, geometry, and alignment in women with POI have been lacking. To our knowledge, this is the first study to demonstrate that POI is associated with reduced femoral strength and poor femur alignment in relation to the upper body forces when compared with age- and BMI-matched healthy, premenopausal women. The bone strength parameters remained significantly lower in POI participants, even after adjusting for FN BMD.
Several studies have explored skeletal strength and geometric parameters in relation to female hypogonadism associated with other causes. In a study of young females with anorexia nervosa (AN) aged 18-26 years, DiVasta et al.30 showed 11%-35% lower CSA and SM in women with AN compared with age-matched healthy controls. This finding was attributed to possible oestrogen and androgen deficiency, in addition to defective mechanical loading and metabolic changes. Studies analysing hip and femur strength in young female athletes using DXA-derived AHA and High-resolution peripheral quantitative computed tomography (HR-pQCT) showed that the beneficial effect of athletic activity on hip and femur strength was reduced in amenorrhoeic athletes compared with their eugonadal counterparts.31,32 Finally, Nagaraj et al.,33 in their study of longitudinal changes in hip geometry in the postmenopausal females, reported a deterioration in strength parameters that paralleled BMD changes in the perimenopausal period. Our findings align with these studies, as our data indicate that women with POI also exhibited lower strength indices, including CSA, CSMI, SM, and SI, signifying reduced resistance to axial and bending forces, which may increase their susceptibility to hip fracture.18,19
In our study, no significant difference was observed among the cortical parameters at any of the femoral sites. This contrasts with other conditions associated with female hypogonadism, such as the postmenopausal state and amenorrhoeic athletes who show lower cortical indices.19,31 It is possible that the cortical parameters in women with POI in this study did not significantly differ from the control women as most POI participants were taking HT, either as MHT or COCPs. No previous studies have assessed the effect of HT on hip geometry parameters in women with POI. Several studies have examined the effects of various HT formulations and doses on BMD. Doses of at least 2 mg oral oestradiol or continuous use of the 30 µg COCP appear required for maintenance of BMD34 but the ideal HT regimen remains undecided.35–38 As POI women had reduced strength parameters compared with controls, we can hypothesise that their HT dose was suboptimal and or was not commenced early enough to maintain strength parameters in the POI subjects. Additionally, improvement in strength parameters may require longer treatment duration to become evident. Furthermore, androgens also play a significant role in maintaining skeletal health; they can directly affect bone cells through androgen receptors or aromatisation into oestrogens, regulating bone remodelling. Moreover, androgens also contribute to bone formation through efficient mechanical loading, due to their anabolic effect on muscles. Women with POI have lower androgen concentrations than the normal age-matched premenopausal women,39 which may lead to a loss of the beneficial effects of androgens on bones and muscles, potentially affecting bone geometry and strength. Although the evidence regarding the positive effects of testosterone replacement on BMD in POI subjects is inconsistent and limited, this may be attributed to suboptimal dosing in previous studies.3,40,41 Further research is needed to elucidate the role of androgen replacement in improving bone health in women with POI.
Studies evaluating the impact of racial or ethnic differences on hip geometry showed a more favourable structural geometry at the hip in African Americans and Japanese, compared with Caucasian and Chinese American women. In a study of 1942 pre- and early perimenopausal women aged 42-52 years, including Caucasian (50%), African American (27%), Chinese (11%), and Japanese (12%) women, Danielson et al.42 showed that African American and Japanese women had a larger CSA and SM followed by Caucasian and Chinese women. Our study had women from multiple ethnicities (Table 1) in the POI group; after adjusting for ethnicity based on Caucasian vs non-Caucasian women, the differences in strength indices and FOA remained significant (Table 3).
To date, there have been no studies examining femur alignment with the upper body forces using the AHA technique in women with POI. In our study, we found that POI women exhibited a significantly lower FOA compared with healthy controls, indicating an abnormal femoral alignment. This compromised alignment may disrupt load transfer, leading to skeletal damage and increased bone fragility. While this association has not been previously described in women with POI, it has been established in cases of atypical femoral fractures (AFF), where inward angulation of the distal tibia in relation to the femoral shaft (genu varum) is linked to increased fracture risk.43 Abnormal alignment may also contribute to bone fragility in women with POI. This is an area that needs more research.
Fracture prevalence data in POI women remain limited. In a meta-analysis, Anagnostis et al.29 showed that early menopause is associated with increased fracture risk compared with normal age at menopause. Although their study did not show any distinct effect on any fracture site, Mallmin et al.,44 in their case–control study, showed an increased prevalence of Colles’ fracture in women with early menopause. We did not find a significant difference in fracture prevalence between the POI and control participants, which is likely explained by our relatively young cohort. As fracture risk is age dependent, increased fracture prevalence in POI women is likely to be seen in older cohorts of women with POI.
Our study is novel in demonstrating hip structure and geometry in women with POI. Dual-energy X-ray absorptiometry is part of routine care for women with POI, and AHA parameters can be easily accessible through DXA scans without involving additional radiation exposure. The presence of a control group enabled us to highlight significant differences in the proximal hip geometry among the POI and age- and BMI-matched healthy women.
There are limitations inherent to the AHA technique, including assumptions regarding shape and the relative distribution of trabecular and cortical bone within the ROI, which typically vary among individuals,45 as well as extraction of 3D measurements from 2D images. Nevertheless, DXA-derived hip geometry variables have shown a substantial correlation with the pQCT-measured parameters.46 Other limitations related to our study include the following: (1) our study is cross-sectional and based on retrospective data collection, (2) lack of details on HT dosage, and (3) ethnically diverse POI cohort compared to primarily Caucasian control population where previous AHA studies have demonstrated significant racial and ethnical differences.42,47 Although we attempted to adjust for ethnicity, due to multiple ethnicities in the POI group, it was statistically difficult to adjust for each. (4) The skeletal and body composition parameters were assessed on different devices in the control population (Lunar DPXL) and POI women (Lunar Prodigy); however, as stated by Huffman et al.,48 the Lunar Prodigy device tends to overestimate DPXL for BMD in the legs, bone mineral content (BMC) in the legs and trunk, and fat mass in the arms, particularly at higher values (P < .001). Consequently, considering these findings, it is reasonable to assume that the parameters measured in POI women might have been overestimated, potentially leading to even higher mean differences. (5) The FOA (α) was calculated from DXA scans performed in the recumbent position and may not represent femoral alignment in the vertical stance. (vi) The FOA represented morphological femoral alignment only, and the tissue disorganisation, ie, cortical vs trabecular ratios, was not available. This will be a subject of future studies. Tools to measure disorganisation of the bone component10 are currently being developed.
Conclusion
Women with POI have lower BMD and altered femur anatomy, strength, and geometry compared to age- and BMI-matched healthy women. The DXA-derived AHA parameters demonstrated that POI women had significantly reduced axial and bending strength. Additionally, the alignment of the femur with the forces transmitted from the upper body differed from the measurements observed in the control group. Prospective longitudinal studies are needed to assess AHA’s utility in determining the role of hip geometry and alignment in bone health assessment, fracture risk prediction, and optimising hormone replacement therapy in women with POI.
Funding
NS was supported by the Departmental scholarship from Monash University, Department of Medicine, School of Clinical Sciences.
Author contributions
Navira Samad (Conceptualization [lead], Data curation [lead], Formal analysis [lead], Investigation [lead], Methodology [lead], Project administration [lead], Resources [equal], Software [lead], Supervision [supporting], Validation [equal], Visualization [equal], Writing—original draft [lead], Writing—review & editing [equal]), Hanh Nguyen (Conceptualization [equal], Methodology [equal], Resources [equal], Supervision [supporting], Validation [supporting], Visualization [supporting], Writing—original draft [supporting], Writing—review & editing [supporting]), Jasna Aleksova (Conceptualization [equal], Formal analysis [supporting], Methodology [supporting], Resources [supporting], Supervision [supporting], Validation [supporting], Visualization [supporting], Writing—original draft [supporting], Writing—review & editing [supporting]), Julie Pasco (Conceptualization [supporting], Data curation [equal], Formal analysis [supporting], Methodology [supporting], Resources [equal], Supervision [supporting], Validation [supporting], Visualization [supporting], Writing—original draft [supporting], Writing—review & editing [supporting]), Mark A. Kotowicz (Conceptualization [supporting], Data curation [equal], Investigation [supporting], Methodology [supporting], Resources [supporting], Supervision [supporting], Visualization [supporting], Writing—original draft [supporting], Writing—review & editing [supporting]), Peter Ebeling (Conceptualization [equal], Data curation [supporting], Investigation [supporting], Methodology [equal], Resources [supporting], Supervision [supporting], Validation [supporting], Visualization [supporting], Writing—original draft [supporting], Writing—review & editing [supporting]), Amanda Vincent (Conceptualization [equal], Data curation [supporting], Formal analysis [supporting], Funding acquisition [lead], Investigation [supporting], Methodology [equal], Resources [supporting], Supervision [supporting], Validation [supporting], Visualization [supporting], Writing—original draft [supporting], Writing—review & editing [supporting]), Roger Zebaze (Conceptualization [equal], Data curation [supporting], Formal analysis [supporting], Investigation [supporting], Methodology [equal], Resources [equal], Software [equal], Supervision [equal], Validation [equal], Visualization [supporting], Writing—original draft [supporting], Writing—review & editing [supporting]), Frances Milat (Conceptualization [equal], Data curation [supporting], Formal analysis [supporting], Funding acquisition [supporting], Investigation [supporting], Methodology [equal], Project administration [supporting], Resources [equal], Software [supporting], Supervision [equal], Validation [equal], Visualization [equal], Writing—original draft [supporting], Writing—review & editing [equal])
Ethics approval
The study was approved by the Monash Health Human Research Ethics Committee (reference number 07062A). All procedures performed involving human participants were in accordance with the ethical standards of the institutional and/or national research committee and with the 1964 Helsinki Declaration and its later amendments or comparable ethical standards. The data underlying this article will be shared on reasonable request to the corresponding author.
Acknowledgments
We acknowledge the contribution of Professor Boyd Strauss in the DXA analysis of a proportion of women with POI.
References
Author notes
Conflict of interest: None declared.
