


Abstract

Our goal was to evaluate gender representation among session leaders and abstract presenters at European cardio-thoracic surgical annual meetings.
We did a descriptive study of the gender distribution among session leaders and abstract presenters at 2 European cardio-thoracic international meetings from 2017 to 2022. Data from publicly available programmes were used to generate a list of session leaders and abstract presenters. The primary outcome was to evaluate the proportion of female sessions leaders at the annual meetings. Descriptive analyses were performed including the Cochran-Armitage trend test for linear trend of proportions.
A total of 1025 sessions of 11 annual meetings of the European Association for Cardio-Thoracic Surgery (EACTS) and the European Society of Thoracic Surgeons were examined. A total of 397 (13.2%) out of 3007 total session leaders and 955 (15.2%) out of 6251 abstract presenters were female. From 2017 to 2022, the proportions of both female session leaders and abstract presenters trended significantly [10.4% to 21.9% (P < 0.001) and 13.7% to 18.3% (P < 0.001), respectively]. The EACTS female members and female meeting attendees significantly increased from 2017 to 2022 [11.1% to 15.9% (P < 0.001) and 23.7% to 26.9% (P < 0.001)], respectively. Most of the women attendees at the EACTS and the European Society of Thoracic Surgeons meetings who were session leaders and speakers came from Germany, Italy, the United Kingdom and the United States.
Women are under-represented compared to men in leadership and speaking roles at European cardio-thoracic surgical annual meetings. In the past few years, an encouraging positive trend over time for female leadership roles has been noted; as a result, the proportion of female society members is represented at the annual meetings. However, a substantial gender gap still exists in leading roles of meeting attendees
INTRODUCTION
Previous studies unanimously reported that women were under-represented at scientific meetings, especially in surgical disciplines [1–5]. Even though women have gained gender parity at medical school, a huge disparity exists in academic leadership positions, especially in the surgical specialties. Women account for 40% of surgical residents; however, they represent only 20% of practicing surgeons and less than 10% of full professors of surgery. Women are relatively over-represented in areas such as obstetrics and gynaecology and paediatrics, whereas other areas such as cardiothoracic surgery have been male dominated for decades. Despite increasing numbers of women entering surgical training, women continue to comprise a small minority of cardiothoracic surgeons [6–8]. Women are less likely than men to receive academic promotion or achieve leadership positions [9]. The multifaceted phenomenon known as the leaky pipeline is the result of several factors, including less productivity (due to funding difficulties, inadequate mentorship, competition for grants), reduced work hours (often related to family responsibilities), work–life balance needs, unfavourable institutional environment, lack of female mentors and role models, poor self-confidence and underestimation at work [10]. The lack of women visible at scientific conferences could also contribute to the leaky pipeline effect. The goals of this study were to evaluate the gender representation among speaking and leader roles at 2 main European cardio-thoracic surgical annual meetings and to assess whether gender representation has changed over time.
MATERIALS AND METHODS
We performed a descriptive study of the gender distribution among session leaders and abstract presenters at annual international meetings held by the European Association for Cardio-Thoracic Surgery (EACTS) and the European Society of Thoracic Surgeons (ESTS) from 2017 to 2022. Data from publicly available programs were used to generate a list of session leaders, defined as moderators and panelists, and abstract presenters or speakers. If a female or a male session leader held more than 1 role in a given session, each role was counted separately; if a female or a male session leader held the same role multiple times throughout the conference, each appearance was counted separately. The gender of each session leader and each abstract presenter was verified by an Internet search or by e-mail contact. Sessions included for analysis were categorized based on their topic: adult cardiac, congenital cardiac and thoracic. Organizational membership data including annual programme planning committees, council members and boards of directors from 2017 to 2022 were requested and provided by EACTS and ESTS council members.
The primary outcome was to evaluate the proportion of female sessions leaders at annual European cardio-thoracic meetings from 2017 to 2022. Secondary outcomes included the evaluation of the proportion of female abstract presenters and the regional differences of the gender distribution among session leaders and abstract presenters at European cardiothoracic annual meetings. Descriptive analyses were performed including the Cochran-Armitage trend test for linear trend of proportions.
RESULTS
We reviewed and analysed 11 annual meetings of the EACTS and ESTS from 2017 to 2022 (Table 1). A total of 1025 sessions were examined, in which 396 (13.2%) out of 3007 total session leaders and 953 (15.2%) out of 6251 abstract presenters were female (Fig. 1). The proportions of female session leaders trended significantly from 10.4% (n = 70/671) to 21.9% (n = 92/419) from 2017 to 2022 (P < 0.001) (Fig. 2, left). In terms of types of session leaders, there was a statistically significant positive trend in the proportions of female moderators from 10.2% (n = 40/391) in 2017 to 17.6% (n = 38/215) in 2022 (P = 0.008) and of female panelists from 10.7% (n = 30/280) in 2017 to 26.4% (n = 54/204) in 2022 (P < 0.001). Women represented 12.8% (n = 266/2065) of session leaders in adult cardiac sessions, 7.4% (n = 19/256) in congenital cardiac sessions and 16.3% (n = 112/686) in thoracic sessions. The proportions of female session leaders showed a statistically significant positive trend from 9.9% (n = 45/451) in 2017 to 25.2% (n = 79/313) in 2022 (P < 0.001) for adult cardiac sessions, whereas no significant change occurred over time for congenital cardiac, from 5.3% (n = 3/57) to 8.1% (n = 4/49) (P = 0.32), and thoracic sessions, from 13.5% (n = 22/163) to 15.7% (n = 9/57) (P = 0.086) (Fig. 3). All-male-led sessions decreased significantly over time from 73.7% (n = 166/225) in 2017 to 41.3% (n = 60/145) in 2022 (P < 0.001). Congenital cardiac sessions had the highest proportion of all-male-led sessions (81.9%, n = 68/83), followed by adult cardiac (64.3%, n = 426/662) and thoracic (58.5%, n = 164/280) sessions. The proportions of all-male-led sessions decreased significantly in cardiac adult from 75.3% (n = 113/150) in 2017 to 33.3% (n = 37/111) in 2022 (P < 0.001) and thoracic from 68.3% (n = 41/60) in 2017 to 57.8% (n = 11/19) in 2022 (P = 0.002) sessions, whereas no change was observed in congenital cardiac sessions from 80% (n = 12/15) in 2017 to 80% (n = 12/15) in 2022 (P = 0.98).
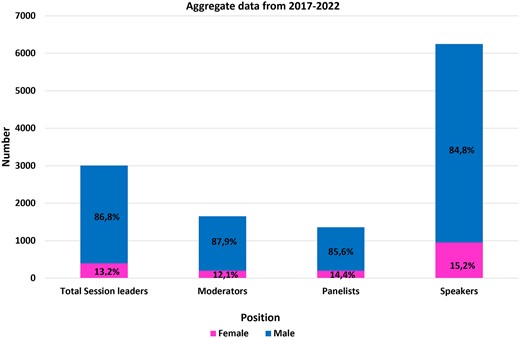
Gender distribution of sessions leaders and abstract presenters (speakers) at European cardio-thoracic annual meetings from 2017 to 2022.
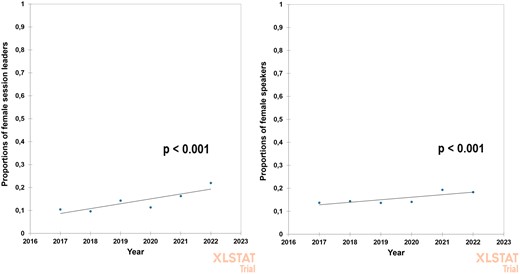
Left: proportions of female session leaders, defined as moderators and panelists, at European cardio-thoracic annual meetings. Right: proportions of female speakers at European cardio-thoracic annual meetings.
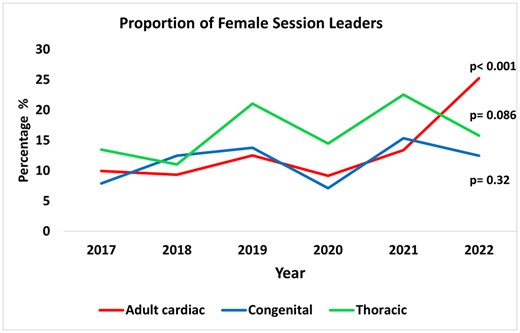
Proportions of female session leaders, defined as moderators and panelists, at European cardio-thoracic annual meetings according to topic session.
Proportions of female session leaders and speakers at European cardio-thoracic meetings from 2017 to 2022
| EACTS/ESTS meeting | 2017 | 2018 | 2019 | 2020 | 2021 | 2022 | Total | P for trend |
|---|---|---|---|---|---|---|---|---|
| Total cardiothoracic sessions | ||||||||
| Total sessions, n | 225 | 195 | 163 | 152 | 145 | 145 | 1025 | |
| All-male-led sessions, n (%) | 166 (73.7%) | 145 (74.3%) | 104 (63.8%) | 94 (61.8%) | 89 (61.4%) | 60 (41.3%) | 658 (64.2%) | <0.001 |
| Total moderators, n | 391 | 339 | 319 | 191 | 195 | 215 | 1650 | |
| Female moderators, n (%) | 40 (10.2%) | 35 (10.3%) | 45 (14.1%) | 12 (6.2%) | 30 (15.4%) | 38 (17.6%) | 200 (12.1%) | 0.008 |
| Total panelists, n | 280 | 244 | 247 | 221 | 161 | 204 | 1357 | |
| Female panelists, n (%) | 30 (10.7%) | 21 (8.6%) | 36 (14.5%) | 28 (12.6%) | 27 (16.7%) | 54 (26.4%) | 196 (14.4%) | <0.001 |
| Total session leaders, n | 671 | 583 | 566 | 412 | 356 | 419 | 3007 | |
| Female session leaders, n (%) | 70 (10.4%) | 56 (9.6%) | 81 (14.3%) | 40 (9.7%) | 57 (16%) | 92 (21.9%) | 396 (13.2%) | <0.001 |
| Total speakers, n | 1385 | 1147 | 953 | 1072 | 891 | 803 | 6251 | |
| Female speakers, n (%) | 190 (13.7%) | 165 (14.3%) | 130 (13.6%) | 151 (17.2%) | 170 (19.1%) | 147 (18.3%) | 953 (15.2%) | <0.001 |
| Adult cardiac sessions | ||||||||
| Total sessions, n | 150 | 122 | 100 | 95 | 84 | 111 | 662 | |
| All-male-led sessions, n (%) | 113 (75.3%) | 91 (74.6%) | 65 (65%) | 61 (64.2%) | 59 (70.2%) | 37 (33.3%) | 426 (64.3%) | <0.001 |
| Total moderators, n | 266 | 195 | 204 | 129 | 111 | 160 | 1065 | |
| Female moderators, n (%) | 27 (10.2%) | 21 (10.7%) | 31 (15.2%) | 5 (3.8%) | 11 (9.9%) | 34 (21.3%) | 129 (12.1%) | 0.02 |
| Total panelists, n | 185 | 222 | 155 | 165 | 120 | 153 | 1000 | |
| Female panelists, n (%) | 18 (9.7%) | 18 (7.5%) | 14 (9%) | 22 (13.3%) | 19 (15.8%) | 45 (29.4%) | 136 (13.6%) | <0.001 |
| Total session leaders, n | 451 | 417 | 359 | 294 | 231 | 313 | 2065 | |
| Female session leaders, n (%) | 45 (9.9%) | 39 (9.3%) | 45 (12.5%) | 27 (9.2%) | 30 (12.9%) | 79 (25.2%) | 266 (12.8%) | <0.001 |
| Total speakers, n | 936 | 729 | 621 | 668 | 463 | 614 | 4031 | |
| Female speakers, n (%) | 120 (12.8%) | 95 (13%) | 71 (11.4%) | 82 (12.3%) | 82 (17.7%) | 100 (16.3%) | 552 (13.7%) | 0.008 |
| Congenital sessions | ||||||||
| Total sessions, n | 15 | 13 | 14 | 16 | 10 | 15 | 83 | |
| All-male-led sessions, n (%) | 12 (80%) | 11 (84.6%) | 11 (78.6%) | 14 (87.5%) | 8 (80%) | 12 (80%) | 68 (81.9%) | 0.9 |
| Total moderators, n | 19 | 14 | 26 | 14 | 10 | 25 | 108 | |
| Female moderators, n (%) | 0 | 0 | 0 | 0 | 2 (20%) | 1 (4%) | 3 (2.7%) | 0.07 |
| Total panelists, n | 38 | 16 | 29 | 28 | 13 | 24 | 148 | |
| Female panelists, n (%) | 3 (7.9%) | 2 (12.5%) | 4 (13.8%) | 2 (7.1%) | 2 (15.4%) | 3 (12.5%) | 16 (10.9%) | 0.6 |
| Total session leaders, n | 57 | 30 | 55 | 42 | 23 | 49 | 256 | |
| Female session leaders, n (%) | 3 (5.3%) | 2 (7.7%) | 4 (7.3%) | 2 (4.7%) | 4 (17.4%) | 4 (8.1%) | 19 (7.4%) | 0.3 |
| Total speakers, n | 85 | 86 | 81 | 126 | 59 | 87 | 524 | |
| Female speakers, n (%) | 10 (11.8%) | 19 (22.1%) | 18 (22.2%) | 22 (17.5%) | 7 (11.8%) | 23 (26.4%) | 99 (18.8%) | 0.2 |
| Thoracic sessions | ||||||||
| Total sessions, n | 60 | 60 | 49 | 41 | 51 | 19 | 280 | |
| All-male-led sessions, n (%) | 41 (68.3%) | 43 (71.6%) | 28 (57.1%) | 19 (46.3%) | 22 (43.1%) | 11 (57.8%) | 164 (58.5%) | 0.002 |
| Total moderators, n | 106 | 130 | 89 | 48 | 74 | 30 | 477 | |
| Female moderators, n (%) | 13 (12.2%) | 14 (10.8%) | 14 (15.7%) | 7 (14.6%) | 17 (22.9%) | 3 (10%) | 68 (14.2%) | 0.1 |
| Total panelists, n | 57 | 6 | 63 | 28 | 28 | 27 | 209 | |
| Female panelists, n (%) | 9 (15.8%) | 1 (16.7%) | 18 (28.6%) | 4 (14.3%) | 6 (21.4%) | 6 (22.2%) | 44 (21.1%) | 0.5 |
| Total session leaders, n | 163 | 136 | 152 | 76 | 102 | 57 | 686 | |
| Female session leaders, n (%) | 22 (13.5%) | 15 (11%) | 32 (21.1%) | 11 (14.5%) | 23 (22.5%) | 9 (15.7%) | 112 (16.3%) | 0.08 |
| Total speakers, n | 364 | 332 | 251 | 278 | 369 | 102 | 1696 | |
| Female speakers, n (%) | 60 (16.5%) | 51 (15.4%) | 41 (16.3%) | 47 (16.9%) | 81 (21.9%) | 24 (23.5%) | 304 (17.9%) | 0.01 |
We recorded a total of 6251 abstract presenters; females represented 15.2% (n = 953/6251) of all speakers. The proportion of female abstract presenters increased significantly from 13.7% (n = 190/1385) in 2017 to 18.3% (n = 147/803) in 2022 (P < 0.001) (Fig. 2, right). The proportions of female abstract presenters trended significantly over time for adult cardiac from 12.8% (n = 120/936) in 2017 to 16.3% (n = 100/614) in 2022 (P = 0.008), and thoracic sessions from 16.5% (n = 60/364) in 2017 to 23.5% (n = 24/102) in 2022 (P = 0.01); the proportions of female abstract presenters in congenital cardiac sessions increased over time but the trend was not statistically significant, from 11.8% (n = 10/85) in 2017 to 26.4% (n = 23/87) in 2022 (P = 0.204).
Average session leader roles for men and women at each scientific meeting are illustrated in Table 2. No difference was found between men and women, except for adult cardiac sessions in 2022 (1.5 ± 0.8 vs 1.9 ± 1.6; P = 0.007).
Average session leader roles for men and women at European cardio-thoracic meetings from 2017 to 2022
| Adult cardiac | Congenital | Thoracic | |||||||
|---|---|---|---|---|---|---|---|---|---|
| Session leader roles/meeting (mean ± SD) | |||||||||
| EACTS/ESTS meeting | Male | Female | P | Male | Female | P | Male | Female | P |
| 2017 | 1.4 ± 0.8 | 1.5 ± 0.7 | 0.9 | 1.1 ± 0.4 | 1.0 ± 0 | 0.63 | 1.5 ± 0.8 | 1.5 ± 0.8 | 0.9 |
| 2018 | 1.4 ± 0.7 | 1.4 ± 0.8 | 0.9 | 1.0 ± 0 | 1.0 ± 0 | 0.9 | 1.3 ± 0.7 | 1.3 ± 0.5 | 0.74 |
| 2019 | 1.4 ± 0.8 | 1.5 ± 0.7 | 0.9 | 1.2 ± 0.4 | 1.0 ± 0 | 0.39 | 1.2 ± 0.5 | 1.3 ± 0.6 | 0.36 |
| 2020 | 1.5 ± 0.8 | 1.3 ± 0.6 | 0.28 | 1.1 ± 0.2 | 1.0 ± 0 | 0.74 | 1.1 ± 0.4 | 1.1 ± 0.3 | 0.87 |
| 2021 | 1.5 ± 0.8 | 1.5 ± 0.9 | 0.84 | 1.2 ± 0.4 | 2 ± 1.4 | 0.05 | 1.2 ± 0.5 | 1.4 ± 0.5 | 0.40 |
| 2022 | 1.5 ± 0.8 | 1.9 ± 1.6 | 0.007 | 1.3 ± 0.6 | 1.0 ± 0 | 0.41 | 1.4 ± 0.8 | 1.3 ± 0.8 | 0.78 |
EACTS: European Association of Cardio-thoracic Surgeons; ESTS: European Society of Thoracic Surgeons; SD: standard deviation.
Organizational membership data are illustrated in Table 3. The EACTS meeting registered a total of 22,954 meeting attendees from 2017 to 2022, of which 5792 were female (25.2%); however, the total number of females in leader roles from 2017 to 2022 was only 397 (13.2%) (P < 0.001). The EACTS female members significantly increased from 11.1% (n = 467/4216) in 2017 to 15.9% (n = 706/4433) in 2022 (P < 0.001), and ESTS female members also significantly increased from 14.7% (n = 232/1568) in 2018 to 20.5% (n = 352/1710) in 2022 (P < 0.001) (Fig. 4). Likewise female EACTS meeting attendance proportion significantly increased from 23.7% (n = 1065/4483) in 2017 to 26.9% (n = 885/3289) in 2022 (P < 0.001), and both trends were statistically significant. Data on annual meeting attendance were not provided by ESTS. The meeting programs of the EACTS are planned by the domains of the EACTS (Organization—EACTS) and the domain chairs are the ones who decide on moderators, panellists and invited speakers. EACTS annual meeting programme committee data and ESTS board of directors and programme committee members data were provided directly by EACTS and ESTS by e-mail.
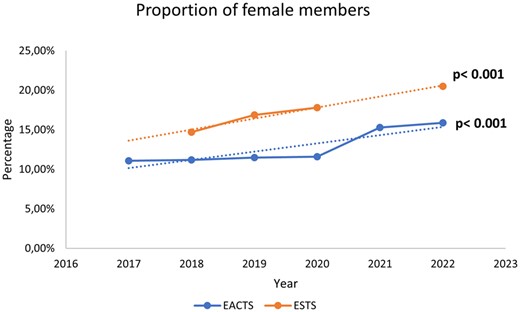
Proportions of female members of the European Association of Cardio-thoracic Surgeons and the European Society of Thoracic Surgeons from 2017 to 2022.
Organizational membership data of the European Association of Cardio-thoracic Surgeons and the European Society of Thoracic Surgeons from 2017 to 2022
| Organization | 2017 | 2018 | 2019 | 2020 | 2021 | 2022 | P for trend |
|---|---|---|---|---|---|---|---|
| EACTS | |||||||
| Total members, n | 4216 | 4268 | 4209 | 4094 | 4422 | 4433 | |
| Female members, n (%) | 467 (11.1%) | 476 (11.2%) | 484 (11.5%) | 474 (11.6%) | 677 (15.3%) | 706 (15.9%) | <0.001 |
| Meeting attendance, n | 4483 | 4028 | 3800 | 4876 | 2478 | 3289 | |
| Female meeting attendance, n (%) | 1065 (23.7%) | 985 (24.5%) | 867 (22.8%) | 1384 (28.3%) | 606 (24.4%) | 885 (26.9%) | <0.001 |
| Annual meeting programme committee, total members, n | 42 | 43 | 38 | 41 | 44 | 40 | |
| Annual meeting programme committee, female members, n, (%) | 3 (7.1%) | 3 (6.9%) | 4 (10.5%) | 4 (9.7%) | 5 (11.3%) | 7 (17.5%) | 0.1 |
| Council members, n | NA | NA | NA | NA | NA | NA | |
| Female council members, n (%) | NA | NA | NA | NA | NA | NA | – |
| ESTS | |||||||
| Total members, n | 1548 | 1568 | 1625 | 1644 | 1628 | 1710 | |
| Female members, n (%) | NA | 232 (14.7%) | 275 (16.9%) | 293 (17.8%) | NA | 352 (20.5%) | <0.001 |
| Meeting attendance, n | NA | NA | NA | NA | NA | NA | |
| Female meeting attendance, n (%) | NA | NA | NA | NA | NA | NA | – |
| Annual meeting committee, total members, n | 15 | 16 | 15 | 14 | 14 | – | |
| Annual meeting committee, female members, n (%) | 1 (6,7%) | 1 (6.3%) | 1 (6.7%) | 2 (14.3%) | 2 (14.3%) | – | 0.3 |
| Board of directors, total members, n | 18 | 18 | 16 | 15 | 17 | 15 | |
| Board of directors, female members, n (%) | 2 (11,1%) | 3 (16.7%) | 2 (12.5%) | 2 (13.3%) | 3 (17.6%) | 3 (20%) | 0.5 |
EACTS: European Association of Cardio-thoracic Surgeons; ESTS: European Society of Thoracic Surgeons.
The proportion of females on the EACTS annual programme planning committee increased from 7% (n = 3/42) in 2017 to 17.5% (n = 7/40) in 2022, but the trend was not significant (P = 0.11). Likewise, the proportion of females on the ESTS annual meeting committee increased from 6.7% (n = 1/15) in 2017 to 14.3% (n = 2/14) in 2021, but the trend was not significant (P = 0.33). The proportion of females on the board of directors increased from 111% (n = 2/18) in 2017 to 20% (n = 3/15) in 2022, but the trend was not significant (P = 0.5). Data on the gender composition of EACTS council members were solicited but not provided by the EACTS.
Regional analysis showed that the absolute number of female attendees at EACTS and ESTS meetings as session leaders and abstract presenters in the period 2017 to 2022 was higher for Germany (n = 192/1635, 11.7%), Italy (n = 169/1090, 15.5%), the United Kingdom (n = 159/971, 16.3%) and the United States (n = 129/1007, 12.7%) (Fig. 5, top). Countries with higher proportions of female session leaders and speakers were Spain (n = 88/345, 25.5%), Austria (n = 84/428, 21%), the Netherlands (n = 83/416, 199%,) and Canada (n = 49/327, 206%) (Fig. 5, bottom).
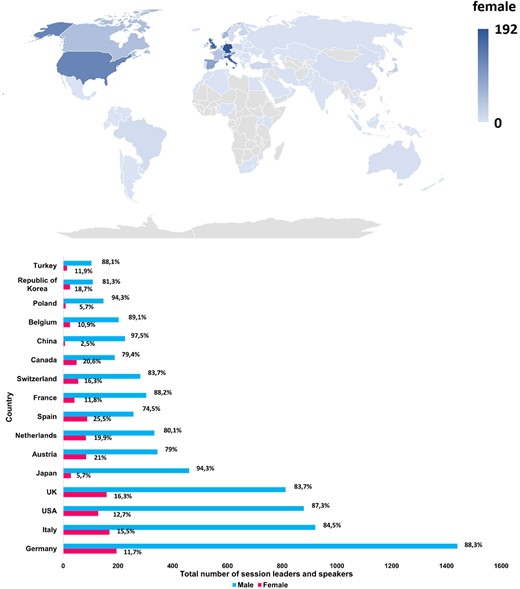
Top: world differences in total numbers of women attendees at European cardio-thoracic annual meetings as session leaders and speakers from 2017 to 2022. Bottom: gender and regional differences in total numbers of session leaders and speakers at European cardio-thoracic annual meetings from 2017 to 2022.
DISCUSSION
The results of our study confirm that women are under-represented at European cardio-thoracic surgery annual meetings in leadership and speaking roles because they account only for 13.2% of session leaders and 15.2% of abstract presenters. Unfortunately, this evidence is not big news. Previous studies already demonstrated that women fill significantly fewer leadership and speaking roles at medical [2] and surgical conferences [3, 4], especially cardio-thoracic surgery meetings [5]. Ruzycki et al. [1] reported for the first time a systematic study on gender inequities at medical and surgical conferences. The authors analysed 181 conferences, including 100 medical and 81 surgical specialty conferences, in Canada and the United States over a 10-year period and found that the mean proportion of women speakers significantly increased from 24.6% in 2007 to 34.1% in 2017 [1]. Additionally, the mean proportion of female speakers at medical specialty conferences was significantly 9.8% higher than the mean proportion of female speakers at surgical specialty conferences for all years analysed [1].
Arora et al. [2] expanded on previous findings by including 20 medical and surgical specialties across 5 regions, including Australasia, Canada, Europe, the United Kingdom and the United States, in a contemporaneous sample of 98 conferences from 2017 to 2018 and found that women represented 30.1% of speakers overall. When analysing surgical conferences only, the results are even lower. Gerull et al. [3] assessed the proportion of women speakers as moderators and panelists at surgical conferences of 14 American surgical societies in 2011 and 2016 and found that only 21.7% were women.
Our results are in line with those of Shemanski et al. [5], who showed that in cardiac and thoracic specialties women are even more under-represented. The authors analysed a total of 679 sessions over 20 meetings from 2015 to 2019 and found that only 13.1% of session leaders, including moderators, panelists and invited discussants, were women [5]. The proportion of total female session leaders trended positively over time from 9.6% in 2015 to 15.9% in 2019; however, when analysing the specialty topic sessions, the proportion of female session leaders trended significantly only for thoracic sessions from 20.6% in 2015 to 29.2% in 2019 [5]. Instead, we found a significant positive trend over time of female leadership roles only for adult cardiac sessions. However, although the number of female cardiac session leaders increased between 2017 and 2022, the average number of cardiac session leader roles that each woman had during the conference also increased from 1.5 in 2017 to 1.9 in 2022, meaning that very few new women were actually recruited as session leaders and that the same women were just circulated among different sessions, which can hardly be regarded as increased inclusivity.
In our study, overall, all-male-led sessions were 64.1%; however, we found a significant decrease in all-male-led sessions from 73.7% in 2017 to 41.3% in 2022. Congenital cardiac sessions had the highest proportion of all-male-led sessions (81.9%), and there was no significant decrease over time, followed by adult cardiac sessions (64.2%) and thoracic sessions (58.5%). The results regarding the congenital cardiac sessions are not obvious. Congenital cardiac surgery has a longer training time, and dedication to this specialty is more demanding than in other subspecialties. However, the overall number of congenital cardiac surgeons is low, which might explain why women have more difficulties to find a place in this subspecialty. Furthermore, training in congenital cardiac surgery often means that after a regular training in cardiac surgery, an additional training in this subspecialty is necessary, often extending training times to more than 8 years. The teams are often small; therefore, an additional academic career seems to be an even higher burden compared to larger teams, where more time is left for academic work. Tools for increasing the number of women entering an academic career in congenital cardiac surgery could be a reduction in training time and promoting a focused congenital cardiac surgery training with a reduced time in adult cardiac surgery.
Only adult cardiac sessions and thoracic sessions showed a significant decrease over time of the proportion of all-male-led sessions (from 75.3% in 2017 to 33.3% in 2022 and from 68.3% in 2017 to 57.8% in 2022, respectively). Similarly, in the study of Shemanski et al. [5], more than one-half of the sessions (57.4%) featured all-male session leadership, with adult cardiac sessions having the highest proportion of all-male-led sessions (70.4%), followed closely by congenital cardiac sessions (69%), whereas thoracic sessions had the lowest proportion of all-male-led sessions (38.5%). However, in this study, the proportion of all-male-led sessions did not decrease significantly over time for any specialty [5].
Casadevall et al. [11] first reported that having at least 1 woman member of the convening team correlated with a significantly higher proportion of invited female speakers and reduced the likelihood of all-male sessions and suggested that the inclusion of more women as conveners may increase the proportion of women among invited speakers at scientific meetings. Similarly, other reports [2–4, 12] showed that the proportion of women on the planning committee was significantly associated with the proportion of women speakers at the respective conferences. We found that the proportions of female chairs on the programme committees increased from 7.1% in 2017 to 17.5% in 2022 for the EACTS and from 6.7% in 2017 to 14.3% in 2021 for the ESTS. Even if the trend was not significant over time, the increase in the proportions of female chairs on the programme committees in both societies could explain the significant reduction in all-male-led sessions as well as the significant increase in female session leadership that was observed in our report. The increase in female membership from 11.1% in 2017 to 15.9% in 2022 for EACTS and from 14.7% in 2018 to 20.5% in 2022 for ESTS, as well as the increase in female attendance at the EACTS meetings from 23.7% in 2017 to 26.9%, could also have contributed to the observed positive trend in female leadership roles.
Even when women are well represented as conference speakers, there is attrition at the more prestigious plenary talks. Gerull et al. [3] found that among plenary session speakers at surgical conferences of 14 American surgical societies, only 19.4% were women and that 49.2% conferences had zero-women plenary sessions. Moreover, Zaza et al. [4] warned of a possible tokenism of women as speakers. They showed that women were more likely to be award presenters and introducers and to speak on topics considered “soft sciences” such as professionalism and advocacy and less likely to present on the “hard sciences” such as clinical topics, technical skills or scientific research.
Gender representation among speakers also varies by region, with European conferences having 28% lower odds of having female speakers compared with conferences in the United States [2]. In our study, most of the female session leaders and abstract presenters came from Germany (n = 192/1635, 11.7%), Italy (n = 165/1090, 15.5%), the UK (n = 159/971, 16.3%) and the United States (n = 129/1007, 12.7%); however, the proportions of female session leaders and abstract presenters were higher for Spain (n = 88/345, 25,5%), Austria (n = 84/428, 21%), the Netherlands (n = 83/416, 19.9%,) and Canada (n = 49/327, 20.6%). The reason for this discrepancy remains unknown. We can speculate that support received by women to achieve an academic career might not be equal to the support received by men in all countries.
The 2021 health statistics report of the Organization for Economic Cooperation and Development (OECD) showed that the proportion of female doctors has increased in all OECD countries over the past 2 decades [13]. In 2019, almost half of all doctors in OECD countries were female. The share of female doctors increased particularly rapidly from 2000 in the Netherlands, Spain, Denmark and Norway, where women accounted for more than half of all doctors in 2019. This increase is due to the growing numbers of women enrolling in medical schools as well as the progressive retirement of the more commonly male generations of doctors. Female doctors, however, tend to work more in general medicine and medical specialties like paediatrics and less in surgical specialties [13]. Gender equality and gender equity in medical practices represent 2 distinct entities. The fact that women accounted for nearly half of medical school students and graduates illustrates that gender equality finally has been achieved in this domain, with women having equal opportunity and access to a medical education. Gender equity, on the other hand, refers to fairness and justice for both genders when seeking professional opportunity. The lack of gender equity in medicine is apparent in many aspects of women’s professional careers.
Despite the increasing proportion of women applying to and graduating from medical schools, relatively few women are in leadership positions, and the disparity is more pronounced in academic medicine and especially in the surgical specialties. In the United States, women comprise only 20% of cardiothoracic surgery residents and only 7% of practicing cardiothoracic surgeons, and even fewer are in academic or leadership positions [14]. Women experience gender bias in surgical training and practice [15] and salaries [16]. Increased attention on gender disparity in health care has led to the development of interventions to promote gender inclusion, including instituting family-friendly policies; mitigating bias, discrimination, and harassment; and creating formal mentoring networks [17]. A fair number of female colleagues gave up the residency programme in due course because of the difficulties in achieving a work–life balance. Initiatives that look into the motivations of these drop-outs should be implemented in our societal agenda. All over the world, women are still responsible for more care duties, such as household and family care duties [18, 19]. This burden might have an influence on the wishes for or the possibility of pursuing an academic career for women. Some conferences offer on-site nurseries so that parents have access to childcare while participating in the conference. However, taking one’s children to conferences means that one is not free to enjoy the other benefits of conferences, such as dinners with colleagues and networking, activities which are considered extremely important for one’s career perspectives. Furthermore, improving the overall work–life balance for surgeons will benefit surgeons of all genders. There should be a change in the mode of work everywhere, i.e. also supporting men to increase the time they spend on family care. If men took over a part of the time spent on family care, such as parental leave, society would benefit, and the burden on the female would decrease. Legislation designed to achieve a more gender unbiased result would certainly facilitate the opportunity for a better work–life balance. These changes have already been implemented in different countries where parental leaves have been spread towards the couple and no longer only to the women [20]. Initiatives to facilitate breastfeeding at work or childcare facilities at work can also help support a more family friendly environment.
There is also a long way to go to achieve full equity, inclusion and diversity at scientific conferences. Spreading awareness of gender disparity is the first step to promote diversity and equity. The introduction of a code of conduct, including pledges to have no all-male panels and to invite an equal percentage of women and men as speakers could bring positive results [20]. Women comprised 29% of keynote speakers at Nature Conferences between 2016 and 2018 and that number increased to 48% in the 20 meetings that took place in 2020 and 2021 after the introduction of the code of conduct [21]. During the same period, women represented 43% of the members of conference organizing committees and 51% of speakers for short talks. Codes of conduct for scientific meetings, such as that introduced by Nature Conferences, should become the norm and could improve diversity, not just in attendance, but also in participation. Although these types of codes of conduct might increase the fear of decreasing the scientific quality, there is no evidence for that. It is usually said that the reason why there are so many all-male-led sessions is that there are not enough women who could fill the role of panellist or invited speaker. However, increasing the number of women on planning committees may increase the number of women in leadership positions. In 2021, all Nature Conferences were virtual, like almost all other scientific events. Initial reports suggest that online formats can be more inclusive than in-person events [22].
Because the medical school graduating class is 50% female, it has been suggested that scientific societies should strive for as close to 50% female representation as possible for invited speakers and moderators at scientific meetings, and some American surgical societies have already instituted such policies [14]. Studies have demonstrated that a single token minority is insufficient to evoke change, and for a minority group to be heard within a committee, a presence of at least 25% to 30% is required to achieve a “tipping point” [14].
Such strategies of inclusion and diversity should also be adopted in Europe, where female cardio-thoracic surgeons are under-represented at annual meetings and experience gender discrimination and report to have thought about leaving the specialty because of this discrimination [23]. The recently formed ESTS Women in General Thoracic Surgery Committee and the EACTS Women in Cardiothoracic Surgery (WiCTS) Committee are committed to provide mentorship for female cardiothoracic surgeons, enhance women’s educational and career development opportunities and inspire more women to fulfil their surgical career ambitions. The WiCTS committee was founded in 2020 upon the advice of the president of the EACTS and the council. It is the mission of the WiCTS to guide the association in its efforts to champion the role of women throughout the organization, identifying opportunities and making recommendations for EACTS to create a fair, equitable, diverse and inclusive culture in which women have equal opportunities in training, research and leadership [https://www.eacts.org/resources/women-in-cardio-thoracic-surgery/]. The role of the WiCTS is to increase the visibility of women in cardiothoracic surgery and support female surgeons on their career path. The WiCTS has conducted a survey about the impact of gender bias in cardiothoracic surgery that was published in 2022 [23]. Furthermore, a webinar series entitled “The Changing Face of Leadership: From Diversity to Inclusion” was organized, included 10 presentations on leadership and was a great success.
The EACTS and the ESTS recognized the importance of this topic, and an encouraging positive trend over time for female leadership roles has been shown. Further efforts and time are required to achieve gender balance. Possible concrete ways to ensure female inclusion in future conferences could be the presence of more female members on meeting programme committees, the end of all-male-led sessions and the invitations and the acceptance of the invitations of more women as moderators and panellists.
LIMITATIONS
One of the limitations of the study is that the overall number of submitted abstracts and the gender of the authors could not be identified. The review process of abstracts is devoid of author or institutional details, and the abstracts are judged solely on their quality. Therefore, there is no guarantee that the proportion of abstracts submitted by women is of a percentage similar to that of the selected ones. Due to the nature of the study, it was not possible to review all submitted abstracts and to look up the gender of the authors. The abstracts we reviewed had all been accepted for presentation, thus representing a potential bias. Furthermore, the number of invited speakers and their genders are unknown to us because they are not documented. It might have been that some women as well as some men refused to lead a session for whatever reason. However, it seems unlikely that a large number of one gender would have refused to take part in sessions that would increase their visibility and probably their career possibilities.
CONCLUSION
Women are under-represented compared to men in leadership and speaking roles at European cardiothoracic surgical annual meetings. In recent years, an encouraging positive trend over time for female leadership roles has been shown; as a result, the proportion of female society members is represented at the annual meetings. However, a substantial gender gap in leading roles still exists compared to the proportion of the genders of the meeting attendees
Cardio-thoracic surgery organizations are required to continue in their efforts to fill this gap. Acknowledging the issue is the first step in correcting it. Successful strategies for gender balance could be (but they should not be limited to) to (i) include more women on planning committees; (ii) stop all-male-led sessions; (iii) develop mentorship programmes for female cardiothoracic surgeons; (iv) provide public reports on organizational membership, session leader and meeting attendance demographics and periodical evaluations of the demographic trends.
FUNDING
This study received no specific grant from any funding agency in the public, commercial or not-for-profit sectors.
Conflict of interest: None declared.
DATA AVAILABILITY
The data underlying this article will be shared on reasonable request to the corresponding author.
Author contributions
Antonella Galeone: Conceptualization; Data curation; Formal analysis; Methodology; Project administration; Supervision; Writing—original draft; Annalisa Bernabei: Methodology, Data curation; Julie Cleuziou: Writing—review & editing; Vanessa Menezes: Data curation; Samina Park: Data curation; Jolanda Kluin: Writing—review & editing; Cecilia Pompili: Data curation; Supervision; Writing—review & editing.
