


Abstract
Pulmonary arterial hypertension (PAH) is associated with poor outcome after mitral valve replacement (MVR). We proposed to evaluate the effect of valve prosthesis patient mismatch (PPM) on pulmonary arterial (PA) pressure following MVR.
Five hundred patients who have undergone MVR were studied retrospectively. Postoperative PA systolic pressure (PASP) measured 6 months postoperatively by Doppler echocardiography was compared with preoperative values. PASP ≥ 40 mmHg was defined as PAH. Mitral valve effective orifice area was calculated by the continuity equation and indexed for body surface area. PPM was defined as indexed effective orifice area ≤ 1.2 cm2/m2. A multivariate model was constructed to ascertain the independent determinants of systolic PA pressure. Also, a propensity score model was constructed to overcome the baseline differences between the PPM and no PPM groups.
The incidence of PPM in this study was 37.2%. The average postoperative PASPs were 30.49 and 42.35 mmHg in the no PPM and PPM groups, respectively; (P < 0.001). Regression of PAH in the PPM and no PPM groups was 76.26% and 20.64%, respectively; (P < 0.001). The indexed effective orifice area correlated well with postoperative PASP (r = 0.71). The overall survival and freedom from cardiac death at 10 years were 79.8% and 85.3%; and at 20 years were 66.5% and 74.3%, respectively. Both, overall survival and the freedom from cardiac death were higher in the no PPM group than in the PPM group; (P < 0.001). Propensity score matching analysis yielded 112 pairs of the PPM and no PPM cohorts, which revealed higher overall survival and freedom from cardiac death in the no PPM group; (P = 0.028 and 0.012, respectively).
Mitral PPM is an independent predictor of persistent PAH after MVR along with associated morbidity and reduced survival.
INTRODUCTION
Prosthesis patient mismatch (PPM) in the aortic position has been extensively studied and is a widely accepted concept. Previous studies have reported that patients with PPM after aortic valve replacement have worse haemodynamics, lesser regression of left ventricular hypertrophy, increased cardiac events and higher mortality rates [1]. However, PPM following mitral valve replacement (MVR) has been less investigated. The first reported case of PPM in mitral position was published by Rahimtoola and Murphy in 1981, wherein a patient following MVR, continued to remain symptomatic with persistent pulmonary artery hypertension (PAH) and progressive right heart failure [2]. In subsequent studies, Dumesnil et al. [3–5] demonstrated the existence of a relationship between the indexed effective orifice area (iEOA) and the transvalvular pressure gradient in normally functioning prostheses implanted in the mitral position. These findings are consistent with the concept that PPM occurs when the EOA of the prosthesis is too small in relation to the patient’s body size, resulting in an abnormally high postoperative gradient [6].
Mitral PPM is independently associated with persistent pulmonary hypertension, increased incidence of congestive heart failure and reduced survival after MVR [7, 8]. Pulmonary hypertension regresses in an unpredictable manner after MVR and is frequently incomplete [5, 9]. The regression of left atrial and pulmonary hypertension is adversely affected by persistent gradients across mitral prostheses [5, 7, 10]. We, therefore, proposed to evaluate the effect of PPM on pulmonary arterial (PA) pressure following MVR.
MATERIALS AND METHODS
A retrospective analysis of 684 consecutive out-patients, who had previously undergone mechanical MVR was performed. This included patients operated upon between 1990 and 2016. Patients were excluded from the study if they had significant aortic valve disease, had undergone concomitant aortic valve replacement or had obvious prosthetic valve dysfunction. The final study group comprised of 500 patients. The mean age of the entire cohort was 39.04 ± 16.4 years, with a mean follow-up period of 8.15 ± 3.2 years (range: 6 months–26 years). Of these, 182 patients received a TTK Chitra (India) mechanical mitral prosthesis between 1992 and 2001. Subsequently, 148 patients received St. Jude Medical Standard prosthesis (St Jude Medical Inc, USA), 114 patients received ATS valve (ATS Medical, Inc, USA) and the remaining 56 patients received Sorin mechanical mitral prosthesis.
Postoperative PA systolic pressure (PASP) measured by Doppler echocardiography done 6 months postoperatively was available for all patients. It was compared with preoperative values. Subsequent, echocardiography was performed irregularly at the discretion of the operating surgeon and hence was not used for the study. The systolic PA pressure was calculated as described in previous studies [5, 7]. PAH was defined as a systolic PA pressure ≥40 mmHg [8].
Continuity equation (CE) was used to calculate the mitral valve EOA, EOACE [5, 11–13]. An iEOA ≤1.2 cm2/m2 defined PPM [2, 5, 6, 12, 14, 15], and, accordingly, the entire cohort was divided into 2 groups: PPM and no PPM.
Statistical analysis
The preoperative, operative and postoperative variables between the 2 groups were tested for statistical significance by t-test, χ2 test or Fischer exact test as appropriate. P-values <0.05 were considered statistically significant. Statistical analysis was performed using the SPSS statistical software (version 20.0; IBM Corp., NY, USA). The association of variables was analysed statistically with the Pearson correlation coefficient. A multivariate analysis was performed to ascertain the independent determinants of systolic PA pressure. Age, sex, time to follow-up, prevalence of atrial fibrillation (AF) and left ventricular ejection fraction (LVEF) ≤ 50% were included in the model, while other variables were entered, when P-value <0.10 in univariate analysis.
A propensity score model was constructed to minimize the effects of confounding variables between the 2 groups. The propensity score of having mitral PPM was calculated. The propensity score was used in 2 models: the inverse probability of treatment weighting (IPTW) adjusted multivariable analyses, and 1:1 propensity score matching. The P-value of the Hosmer–Lemeshow test and the c-statistic of the propensity score model were 0.628 and 0.964, respectively. In the IPTW adjustment, the weights for the patients with mitral PPM were the inverse of the propensity score, and the weights for the patients without mitral PPM were the inverse of 1 minus the propensity score. McNemar’s test and a paired t-test were performed for the comparison of the categorical and continuous variables, respectively, between the 2 propensity score-matched groups. Survival rates were estimated using the Kaplan–Meier method. Risk factors were analysed with Cox proportional hazard models for time-related events.
RESULTS
Patient demographics and preoperative characteristics are presented in Table 1. The mean age of all patients (n = 500) in the study was 39.04 ± 16.4 years (range: 17–65 years) with a mean follow-up period of 8.15 ± 3.2 years (range: 6 months–26 years). Female patients constituted 62.2% of the study population and mitral stenosis (53.6%) was the predominant valve dysfunction at the time of surgery. While 348 patients had not undergone any previous cardiac surgeries or interventions, the most frequently performed procedure previously was closed mitral commisurotomy in 93 patients. All variables such as age, sex, previous interventions and predominant valve lesions were comparable in the PPM and no PPM groups and statistically insignificant. Body surface area, however, assumed statistical significance (P = 0.02) between the 2 groups. The incidences of coronary artery disease, diabetes mellitus, systemic hypertension, pulmonary hypertension and LVEF ≤ 50% were also comparable between the 2 groups.
Preoperative characteristics and operative data
| Serial number | Variable | Complete cohort (n = 500) | No PPM (n = 314) | PPM (n = 186) | P-value |
|---|---|---|---|---|---|
| Preoperative characteristics | |||||
| 1 | Age (years) | 39.04 ± 16.4 | 38.51 ± 16.2 | 39.93 ± 16.6 | 0.35 |
| 2 | Sex | 0.53 | |||
| Female | 311 (62.2%) | 192 | 119 | ||
| Male | 189 (37.8%) | 122 | 67 | ||
| 3 | Body surface area (m2) | 1.53 ± 0.14 | 1.52 ± 0.14 | 1.55 ± 0.15 | 0.02a |
| 4 | Predominant mitral valve dysfunction | ||||
| MS | 268 (53.6%) | 165 | 103 | 0.54 | |
| MR | 145 (29%) | 92 | 53 | 0.85 | |
| MS + MR | 87 (17.4%) | 57 | 30 | 0.56 | |
| 5 | Atrial fibrillation | 164 | 98 | 66 | 0.33 |
| 6 | Previous interventions | ||||
| Open mitral commisurotomy | 24 | 14 | 10 | 0.64 | |
| Closed mitral commisurotomy | 93 | 57 | 36 | 0.54 | |
| Balloon mitral valvotomy | 68 | 42 | 26 | 0.84 | |
| Nil | 348 (69.6%) | 223 | 125 | 0.37 | |
| 7 | Coronary artery disease | 56 | 33 | 23 | 0.54 |
| 8 | Diabetes mellitus | 79 | 48 | 31 | 0.68 |
| 9 | Systemic hypertension | 83 | 54 | 29 | 0.64 |
| 10 | Pulmonary hypertension | 412 | 257 | 155 | 0.67 |
| 11 | LVEF ≤50% | 114 | 74 | 40 | 0.59 |
| Operative data | |||||
| 12 | Bypass time (min) | 98.4 ± 32.1 | 98.0 ± 33.0 | 99.1 ± 34.2 | 0.72 |
| 13 | Cross-clamp time (min) | 71.8 ± 24.3 | 71.1 ± 23.8 | 73.0 ± 25.6 | 0.40 |
| 14 | Concomitant procedures | ||||
| Tricuspid annuloplasty | 42 | 28 | 14 | 0.59 | |
| Atrial septal defect closure | 11 | 7 | 4 | 0.95 | |
| CABG | 23 | 15 | 8 | 0.81 | |
| Atrial fibrillation surgery | 138 | 85 | 53 | >0.99 | |
| LAA ligation | 138 | 87 | 51 | 0.94 | |
| 15 | Surgical technique | ||||
| Partial PML preservation | 388 | 246 | 142 | ||
| Total PML preservation | 112 | 68 | 44 | 0.27 | |
| 16 | Mechanical prosthesis (type) | ||||
| Chitra | 182 | 113 | 69 (37.91%) | 0.80 | |
| St. Jude | 148 | 92 | 56 (37.84%) | 0.85 | |
| ATS | 114 | 74 | 40 (35.09%) | 0.60 | |
| Sorin | 56 | 35 | 21 (37.50%) | 0.96 | |
| 17 | Mechanical prosthesis (size, mm) | <0.001a,b | |||
| 25 | 79 | 45 | 34 | ||
| 27 | 284 | 153 | 131 | ||
| 29 | 102 | 84 | 18 | ||
| 31 | 35 | 32 | 3 | ||
PPM: prosthesis patient mismatch; MS: mitral stenosis; MR: mitral regurgitation; LVEF: left ventricular ejection fraction; CABG: coronary artery bypass graft; LAA: left atrial appendage; PML: posterior mitral leaflet.
Statistically significant.
Mechanical prostheses sizes were regrouped into smaller (25 and 27 mm) and larger (29 and 31 mm) categories to allow Fischer exact test.
The mean bypass and cross-clamp times were 98.4 ± 32.1 and 71 ± 24.3 min, respectively. The most often associated procedures were left atrial appendage ligation and AF surgery (both 27.6%), followed by tricuspid annuloplasty (8.4%). The most commonly adopted chordal preservation technique was partial posterior mitral leaflet preservation in 77.6% cases. Total posterior mitral leaflet preservation was done in 22.4% cases, which were cases of isolated calcified mitral regurgitation, not amenable to repair. The operative technique was similar in both groups with intermittent everting mattress pledgeted sutures. The distribution of implanted valves and valve sizes are summarized in Table 1. The proportion of smaller sized (27 mm and smaller) valves implanted was 72.6% in the present study, which was significantly higher than 53.1 reported in a previous series [7].
In the propensity score matching analysis, 112 pairs were extracted by 1:1 manner using nearest neighbour matching without replacement. There were no differences assuming statistical significance in the preoperative characteristics and operative data between the propensity score-matched patients, except for the higher proportion of smaller sized (≤27 mm) valves implanted in the PPM group (P < 0.001), as shown in Table 2.
Preoperative characteristics and operative data of propensity score-matched patients
| Serial number | Variable | No PPM (n = 112) | PPM (n = 112) | P-value |
|---|---|---|---|---|
| 1 | Age (years) | 38 ± 15 | 40 ± 14 | 0.30 |
| 2 | Male | 44 | 40 | 0.58 |
| 3 | Body surface area (m2) | 1.53 ± 0.14 | 1.54 ± 0.13 | 0.58 |
| Risk factors | ||||
| 4 | NYHA Class ≥3 | 49 | 46 | 0.69 |
| 5 | Diabetes mellitus | 17 | 19 | 0.72 |
| 6 | Chronic renal failure | 2 | 1 | 0.56 |
| 7 | History of stroke | 6 | 8 | 0.58 |
| 8 | Coronary artery disease | 12 | 14 | 0.68 |
| 9 | Systemic hypertension | 19 | 17 | 0.72 |
| 10 | Atrial fibrillation | 35 | 40 | 0.48 |
| 11 | LVEF ≤50% | 26 | 24 | 0.75 |
| 12 | Pulmonary hypertension | 89 | 94 | 0.39 |
| 13 | Infective endocarditis | 8 | 5 | 0.39 |
| 14 | Significant tricuspid regurgitation (≥moderate) | 18 | 22 | 0.49 |
| Predominant mitral valve dysfunction | ||||
| 15 | MS | 59 | 63 | 0.59 |
| 16 | MR | 33 | 32 | 0.88 |
| 17 | MS + MR | 20 | 17 | 0.59 |
| 18 | Previous interventions | 41 | 45 | 0.58 |
| 19 | Atrial fibrillaton surgery | 29 | 32 | 0.65 |
| 20 | Tricuspid annuloplasty | 10 | 8 | 0.63 |
| 21 | Partial PML preservation | 88 | 85 | 0.63 |
| Mechanical prosthesis (type) | ||||
| 22 | Chitra | 40 | 42 | 0.78 |
| 23 | St. Jude | 33 | 34 | 0.88 |
| 24 | ATS | 26 | 24 | 0.75 |
| 25 | Sorin | 12 | 13 | 0.83 |
| 26 | Mechanical prosthesis (≤ 27 mm) size | 71 | 99 | <0.001a |
PPM: prosthesis patient mismatch; NYHA: New York Heart Association; LVEF: left ventricular ejection fraction; MS: mitral stenosis; MR: mitral regurgitation; PML: posterior mitral leaflet;.
Statistically significant.
The postoperative morbidity included congestive heart failure necessitating hospital admission (10.8%), AF requiring treatment (9.6%), anticoagulation related bleeding complications (6.4%) and stroke (3.6%), which were comparable between the 2 groups, except for a higher incidence of congestive heart failure in the PPM group in the univariate analysis; (P = 0.018). This significant higher incidence of congestive heart failure persisted even in the propensity score matched patients; (P = 0.037), as shown in Table 3.
Postoperative morbidity
| Serial number | Morbidity | Complete cohort (n = 500) | No PPM (n = 314) | PPM (n = 186) | P-value | |
|---|---|---|---|---|---|---|
| Complete cohort | ||||||
| 1 | Stroke | 18 | 11 | 7 | 0.88 | |
| 2 | Anticoagulation related bleeding complications | 32 | 20 | 12 | 0.97 | |
| 3 | Congestive heart failure requiring admission | 54 | 26 | 28 | 0.018a | |
| 4 | Atrial fibrillation requiring treatment | 48 | 26 | 22 | 0.19 | |
| Serial number | Morbidity | No PPM (n = 112) | PPM (n = 112) | P-value | ||
| Propensity score-matched patients | ||||||
| 1 | Stroke | 4 | 4 | >0.99 | ||
| 2 | Anticoagulation related bleeding complications | 7 | 6 | 0.78 | ||
| 3 | Congestive heart failure requiring admission | 8 | 18 | 0.037a | ||
| 4 | Atrial fibrillation requiring treatment | 10 | 13 | 0.51 | ||
PPM: prosthesis patient mismatch.
Statistically significant.
The incidence of PPM in the study was 37.2% (186/500). Smaller sized prostheses (≤27 mm) were implanted in 88.7% of patients with PPM, while valve sizes of >27 mm were associated with a PPM free rate of 84.7% (P < 0.001, Fischer exact test). All other operative parameters were similar and statistically insignificant between the 2 groups.
Patients with PPM had a significantly lower mitral valve EOA and iEOA compared with the no PPM group (P < 0.001). The PPM group also showed significantly higher peak and mean transvalvular gradients, PA pressure and prevalence of PAH (P < 0.001), as summarized in Table 4. The average postoperative PASP was 30.49 mmHg in patients without PPM vs 42.35 mmHg in patients with PPM. Regression of PAH was seen in 76.26% (196/257) of the patients without PPM, while patients with PPM showed a much lower regression of 20.64% (32/155); (P < 0.001), Fig. 1. Mitral valve iEOA ≤ 1.2 cm2/m2 had a sensitivity of 66.13% [95% confidence interval (CI): 58.84–72.89%] and a specificity of 80.57% (95% CI: 75.76–84.80%) in predicting PAH along with a positive likelihood ratio of 3.40 (95% CI: 2.66–4.36). Also, the iEOA correlated well with postoperative PASP [Pearson correlation coefficient (r) = 0.71]. The multivariate analysis revealed iEOA (P < 0.001), and mean transvalvular gradient (P = 0.03) as independent predictors of PAH. Both, time to follow-up and AF correlated weakly with the postoperative PA pressure (r = 0.29, 0.26; P= 0.05, 0.07; respectively).
Postoperative data
| Serial number | Variable | Complete cohort (n = 500) | No PPM (n = 314) | PPM (n = 186) | P-value |
|---|---|---|---|---|---|
| 1 | EOA (cm2) | 1.89 ± 0.4 | 2.16 ± 0.4 | 1.44 ± 0.4 | <0.001a |
| 2 | iEOA (cm2/m2) | 1.24 ± 0.3 | 1.42 ± 0.1 | 0.93 ± 0.1 | <0.001a |
| 3 | Pulmonary hypertension | 184 (36.8%) | 61 (19.4%) | 123 (66.1%) | <0.001a |
| 4 | PASP | 34.90 ± 8.6 | 30.49 ± 8.2 | 42.35 ± 8.4 | <0.001a |
| 5 | Peak transmitral gradient (mmHg) | 9.3 ± 4.1 | 7.5 ± 3.5 | 12.3 ± 4.3 | <0.001a |
| 6 | Mean transmitral gradient (mmHg) | 4.1 ± 2.1 | 3.2 ± 1.2 | 5.5 ± 1.5 | <0.001a |
| 7 | Atrial fibrillation | ||||
| Prevalence among those operated for AF | 24/138 | 13/85 | 11/53 | 0.68 | |
| Overall prevalence of AF | 41 | 21 | 20 | >0.99 | |
| 8 | LVEF ≤50% | 156 | 100 | 56 | 0.16 |
PPM: prosthesis patient mismatch; EOA: effective orifice area; iEOA: indexed EOA; PASP: pulmonary arterial systolic pressure; AF: atrial fibrillation; LVEF: left ventricular ejection fraction.
Statistically significant.
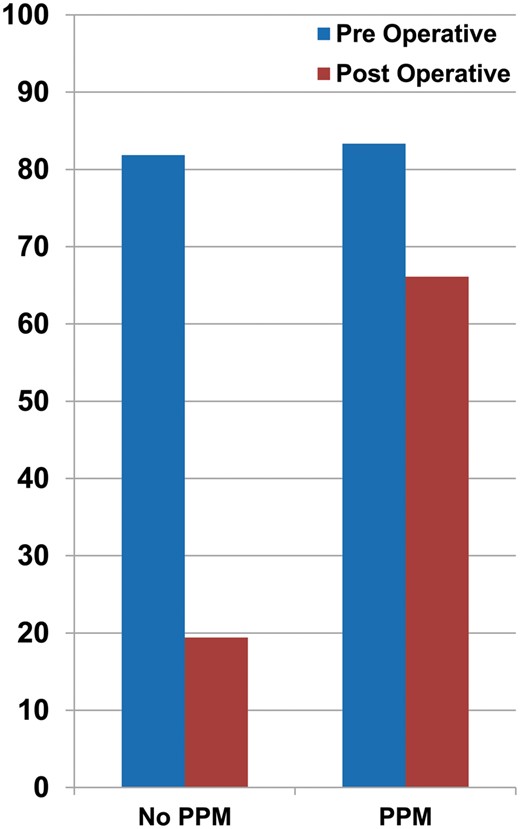
Prevalence of PAH (%) before and after MVR in the PPM versus no PPM group. PAH: pulmonary arterial hypertension; MVR: mitral valve replacement; PPM: prosthesis patient mismatch.
The overall survival rates at 10 and 20 years were 79.8% and 66.5%, respectively. The freedom from cardiac death at 10 and 20 years was 85.3% and 74.3%, respectively. Both, overall survival and the freedom from cardiac death were higher in the no PPM group than in the PPM group (Fig. 2); (P < 0.001).
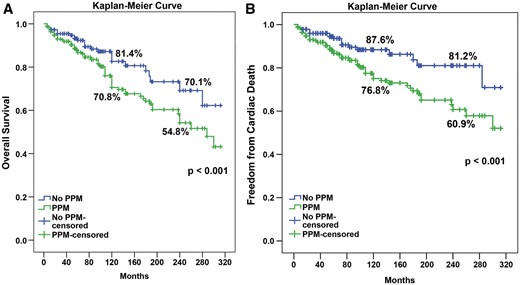
Kaplan–Meier curve for overall survival and freedom from cardiac death in PPM and no PPM groups. PPM: prosthesis patient mismatch.
The overall survival of the propensity score-matched patients at 10 and 20 years was 82% and 68.7%, respectively and freedom from cardiac death at 10 and 20 years was 89.7% and 85.9%, respectively. Both, overall survival and freedom from cardiac death were higher in the propensity score-matched no PPM group than in the PPM group (Fig. 3); ( P = 0.028 and 0.012, respectively).
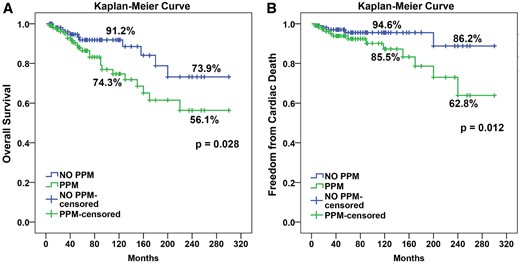
Kaplan–Meier curve for propensity score-matched patients for overall survival and freedom from cardiac death in PPM and no PPM groups. PPM: prosthesis patient mismatch.
The IPTW-adjusted Cox proportional hazards model for the overall survival demonstrated that mitral PPM was a significant risk factor for overall survival [P = 0.006, hazard ratio (HR) 1.894, 95% CI: 1.211–2.643]. The other factors affecting long-term survival were age, postoperative PAH, New York Heart Association functional class ≥ 3 and LVEF ≤ 50%. The IPTW-adjusted Cox proportional hazards model for freedom from cardiac death also showed that mitral PPM (P = 0.017, HR 1.947, 95% CI: 1.382–3.084), age, New York Heart Association functional class ≥ 3 and LVEF ≤ 50% were significant risk factors for long-term cardiac death, as shown in Table 5.
Inverse probability treatment weighting-adjusted cox proportional hazard analysis for overall survival and freedom from cardiac death
| Serial number | Variable | Hazard ratio (95% CI) | P-value |
|---|---|---|---|
| 1 | Factors affecting overall survival | ||
| 1.894 (1.211–2.643) | 0.006 | |
| 1.054 (1.039–1.069) | 0.002 | |
| 1.592 (1.126–2.383) | 0.007 | |
| 1.699 (1.180–2.541) | 0.004 | |
| 1.670 (1.129–2.684) | 0.024 | |
| 2 | Factors affecting freedom from cardiac death | ||
| 1.947 (1.382–3.084) | 0.017 | |
| 1.062 (1.038–1.078) | <0.001 | |
| 2.489 (1.428–3.785) | 0.003 | |
| 1.632 (1.108–2.443) | 0.010 | |
| 1.725 (1.137–2.776) | 0.019 | |
All preoperative and intraoperative variables were analysed and only significant factors in multivariate analysis are shown above.
CI: confidence interval; PPM: prosthesis patient mismatch; PAH: pulmonary arterial hypertension; NYHA: New York Heart Association; LVEF: left ventricular ejection fraction.
DISCUSSION
Since its first description in 1978 by Rahimtoola [14], and a description in 1981 by Rahimtoola and Murphy [2], PPM has been extensively studied, but mostly in the aortic position. The interest in PPM with MVR has only been documented since 2005 [5–8, 12, 15]. As PAH is commonly seen in patients with severe mitral valve disease, which is associated with decreased functional status and poor prognosis [10], its reversion is hence, an important objective of MVR. Because conventional hydrodynamic flow resistance is a function of the fourth power of the radius, prosthesis size rapidly decreases it and the larger mitral prostheses have been neglected as possible obstacles to blood flow. However, extreme PPM may occur with the same effect as in the aortic position: increase in upstream pressure. This increase in pressure may hinder the output out of the pulmonary vascular bed and have an effect on the functional status of the patient, and even on survival, after MVR [9, 10, 13, 16].
Mitral PPM may be likened to residual mitral stenosis, resulting in passive elevation of PA pressure secondary to elevated left atrial (LA) pressure [5, 9, 13]. An important effect of PAH is progressive right ventricular (RV) failure, which is associated with a grave prognosis. RV failure is a result of chronic pressure overload along with volume overload from the development of tricuspid regurgitation [16]. Alleviation of elevated LA pressure, and hence, of PAH is therefore, dependent on prosthesis and/or patient related factors [5, 9].
In 2005, Li et al. [5] from Laval University identified that persistent PAH following MVR occurs frequently, which is strongly associated with mitral PPM. These findings were identified in a series of 56 patients. They showed that iEOA was a predictor of pulmonary hypertension. Lam et al. [8] reported that the PPM after MVR was associated with recurrence of congestive heart failure and postoperative pulmonary hypertension independently. Magne et al. [7] reported that PPM after MVR was an independent predictor of mortality in case of severe PPM (iEOA < 0.9). All 3 studies used measured iEOA to define PPM.
The incidence of PPM varies according to the different methods of calculating EOA, including the continuity equation (CE), pressure half time method and use of reference EOA, ranging from 7% in the pressure half time method to 49% in the referred EOA method to 42–71% in the CE [11, 12, 15, 17] methods. Cho et al. [12] found that among the various methods used to define PPM, EOACE was the only predictor of postoperative haemodynamic parameters. Unfortunately, however, most previous studies on PPM after MVR used EOAIR to define PPM. EOAICE was used to define PPM in only 3 previous studies, all of which demonstrated clinical significance of PPM after MVR, including association with persistent pulmonary hypertension and late TR [11–13].
The present study is therefore the first large study (n = 500), including the continuity equation for the determination of EOA. The incorporation of a propensity score matched model further adds strength to our findings. Only the patients with a mechanical prosthesis were studied because they are less prone to idiosyncratic calcification and unpredictable changes in EOA over time than those receiving a bioprosthesis.
Among 500 patients in this study, the early 182 patients received domestic tilting disc valve (TTK Chitra) until 2001, due to poor-economic status of the patient population. Subsequently, newer generation bileaflet valves were implanted. The key finding in our study is that mitral PPM is strongly associated with the persistence of PAH following MVR. The prevalence of PAH dropped significantly from 81.85% to 19.43% following surgery in the no PPM group, while it continued to remain high in the PPM group (83.33% preoperatively vs 66.12% following surgery), Fig. 1.
Although the proportion of smaller sized mitral prosthesis (27 mm and smaller) implanted in the present study was higher (72.6% compared to 53.1%) than in the study by Magne et al. [7]; 78% of the patients in the study by Magne et al. [7] had some degree of PPM compared to 37.2% in the present study. The larger proportion of patients receiving smaller sized valves in the current study can be attributed to the smaller body surface area (BSA) of the population under study.
In the present study, to minimize the effects of confounding variables, a propensity score model was constructed and used in 2 ways: IPTW-adjusted analyses, and propensity score matching. The results of these 2 analytic methods revealed similar findings as in previous studies: long-term survival and freedom from cardiac death were worse in the PPM group than in the no PPM group [19].
The results of the present study indicate that, unlike other risk factors for PAH, mitral PPM may be prevented through a prospective strategy during surgery. While aortic root widening allows for implantation of a larger prosthesis in the aortic position [18], no such alternative is available in the mitral position. A preventive strategy is hence imperative. In order to achieve a postoperative iEOA >1.2 cm2/m2, emphasis must be laid on the implantation of the prosthesis having the largest EOA for any given size [20]. In this regard, preoperative planning to choose a prosthesis with a sufficient iEOA for each patient might be necessary to optimize the long-term outcomes of MVR.
Limitations
The present study draws data from a single institution. The study was retrospective in design and comprises of a unique population, predominantly young females with small BSA. Hence, the results cannot be extrapolated to general population. Propensity score matching extracted only 112 of 386 patients without PPM, leaving out too many patients. Further prospective studies are, therefore, necessary to determine the effect of PPM on the regression or progression of PAH.
CONCLUSIONS
Mitral PPM is an independent predictor of persistent PAH after MVR and is associated with increased morbidity and reduced survival. Hence, it is of paramount importance to have a preventive strategy that focuses on the implantation of the prosthesis having the largest EOA for any given size and repairing rather than replacing the valve whenever possible.
ACKNOWLEDGEMENTS
The Authors thank the Department of Cardiology, Lokmanya Tilak Municipal Medical College & General Hospital, Mumbai, for their assistance and cooperation.
Conflict of interest: none declared.
REFERENCES
Author notes
Awarded the best ePoster at EuroValve Congress 2017, Barcelona, Spain, 26–27 January 2017.
