


Abstract
Surgical left ventricular (LV) restoration (SVR) induces changes in LV systolic and diastolic function that may affect postoperative right ventricular (RV) function. This study aimed to evaluate the long-term effect of SVR on RV function, with specific focus on determinants and prognostic implications of RV dysfunction.
Eighty-six patients (age 60 ± 10 years, 73% male) with clinical and echocardiographic follow-up 2 years after SVR were included. RV dysfunction was defined as RV fractional area change <35%. The association between RV dysfunction at follow-up and clinical and echocardiographic characteristics and outcome was investigated.
RV dysfunction at follow-up was present in 40% of patients and was associated with worse preoperative RV fractional area change (39 ± 9 vs 46 ± 7%, P < 0.01), pulmonary hypertension (18 vs 4%, P = 0.03) and higher follow-up LV filling pressures (E/E' ratio 23 ± 8 vs 15 ± 8, P = 0.02). At follow-up, patients with RV dysfunction were more frequently in New York Heart Association Class III or IV (30 vs 12%, P = 0.04) and 5-year mortality, heart transplantation and LV assist device implantation rate was increased (49 vs 17%, P < 0.01) as compared to patients with normal RV function.
RV dysfunction after SVR was observed in 40% of patients and was associated with preoperative RV dysfunction, presence of pulmonary hypertension and an increase in LV filling pressures at follow-up. Patients with RV dysfunction after SVR had worse clinical functioning and outcome as compared to patients with normal RV function.
INTRODUCTION
Surgical left ventricular (LV) restoration (SVR) can improve functional status, LV systolic function and survival in selected heart failure patients with a postinfarction LV aneurysm [1, 2]. Especially if a postoperative end-systolic volume index of 70 ml/m2 or less is achieved, SVR in addition to coronary artery bypass grafting (CABG) yields a survival benefit compared to revascularization alone [2]. Although there is consistent evidence that SVR improves LV systolic function by reducing LV volume, previous studies suggested that the reduction in LV volume may worsen LV diastolic function [3–5]. This worsening in LV diastolic properties and the simultaneous improvement in LV systolic function, resulting in an increased cardiac output, may challenge right ventricular (RV) function after surgery. Three studies indeed showed that patients with preoperative RV dysfunction have worse outcome after SVR [6–8]. Garatti et al. [6] revealed that RV dysfunction prior to SVR was associated with a higher frequency of cardiac events postoperatively and decreased long-term survival. In another study, Kukulski et al. [7] demonstrated that patients with RV dysfunction who received CABG and SVR had significant higher mortality and cardiovascular hospitalization rates as compared to patients who received CABG alone. A previous study from our centre showed that preoperative RV dysfunction was an important determinant of postoperative survival in patients undergoing SVR [8]. Although these studies emphasized the implications of preoperative RV dysfunction, data on the evolvement of RV function after SVR are lacking. Therefore, this study aimed to evaluate the effect of SVR on long-term RV function. In addition, determinants and implications of RV dysfunction at follow-up after SVR were investigated.
METHODS
Study population
Patients who underwent SVR according to the technique described by Dor between January 2006 and January 2014 were eligible for inclusion. All patients had primary LV dysfunction with a postinfarction LV aneurysm and symptomatic heart failure despite optimal heart failure medication. A multi-disciplinary team decided on the indication to perform SVR. The original population was previously described [8]. As the aim of this study was to evaluate the long-term effect of SVR on RV function, exclusion criteria for the current analysis were: death before 2-year follow-up assessment (n = 33) and insufficient echocardiographic assessment to thoroughly evaluate RV function preoperatively or at follow-up (n = 24). As per institutional protocol, all patients underwent clinical and echocardiographic evaluation prior to surgery and regular postoperative follow-up. At 2-year post-SVR, clinical evaluation and echocardiography were repeated. Clinical data were prospectively collected in the departmental cardiology information system (EPD-Vision, Leiden University Medical Center, Leiden, Netherlands) and retrospectively analysed. The study was performed in accordance with the Helsinki declaration and approved by the institutional ethical committee. All patients gave informed consent for retrieval of clinical and echocardiographic data at follow-up.
Transthoracic echocardiography
Transthoracic echocardiography was performed in the left lateral decubitus and supine position. Images were obtained with a commercially available system (Vivid 7/E9 [General Electric-Vingmed, Horten, Norway]), digitally stored in cine-loop format and analysed using commercially available software (EchoPAC version 112.0.1; GE Vingmed Ultrasound AS). LV end-systolic and end-diastolic volumes were measured in the apical 4- and 2-chamber view to calculate LV ejection fraction (LVEF) using Simpson’s biplane technique [9]. LV volumes were indexed for body surface area to acquire the LV end-diastolic volume index and LV end-systolic volume index [9]. End-diastolic left atrial volume in the apical 4- and 2-chamber view was indexed for body surface area to obtain left atrial volume index (LAVI) [9]. Peak early diastolic mitral inflow velocity (E) was measured using pulsed wave Doppler in the 4-chamber view. Septal and lateral early diastolic mitral annulus velocities were measured using tissue Doppler imaging in the 4-chamber view. Peak early diastolic mitral inflow velocity was divided by the average of septal and lateral annular velocities (E') to acquire the E/E' ratio [10]. Patients who underwent mitral valve surgery were excluded for evaluation of LAVI and E/E' ratio, since mitral valve surgery for severe mitral regurgitation may importantly reduce LAVI and mitral annular velocities, independent from the effect of SVR [10]. For the assessment of RV function, RV end-systolic and end-diastolic areas were traced in the RV apical view and RV fractional area change (RVFAC) was calculated as the percentage decrease in RV area during systole. RV dysfunction was defined as RVFAC <35%, based on current recommendations [9]. Tricuspid annular plane systolic excursion (TAPSE) was measured in the RV apical view on M-mode recordings of the lateral tricuspid annulus in patients who did not undergo tricuspid valve surgery (n = 63) [11]. RV longitudinal peak systolic strain (RV LPSS) was measured in the basal, midventricular and apical segments of the RV free wall in patients in whom speckle-tracking assessment was feasible (n = 73) [9]. Global RV LPSS was calculated as the average of the 3 measurements. The RV end-diastolic diameter was measured in diastole in the RV apical view [9]. The maximum tricuspid regurgitant jet gradient was measured from continuous wave Doppler using the modified Bernoulli equation [11]. Right atrial pressure was based on the diameter and inspiratory collapse of the inferior caval vein in the subcostal view and estimated as 3, 8 or 15 mmHg [9]. Tricuspid regurgitant jet gradient and right atrial pressure were summed to acquire the systolic pulmonary arterial pressure. Pulmonary hypertension was defined as systolic pulmonary arterial pressure >50 mmHg [12].
Surgical left ventricular restoration
Details of SVR (endoventricular circular patch plasty according to Dor) were described previously [13, 14]. All operations were performed using cardiopulmonary bypass, aortic cross-clamping and intermittent warm blood cardioplegia. In summary, the LV cavity was entered through the infarcted myocardium and a Fontan-stich was placed at the transitional zone between macroscopically viable and scarred tissue. The residual LV cavity was sized using a mannequin balloon at 55 ml/m2 body surface area (TRISVR, Chase Medical, Richardson, TX, USA). The remaining defect was closed with a tailored patch. Concomitant procedures were performed when indicated.
Study end point
Patients were followed for the occurrence of the composite primary end point which included left ventricular assist device (LVAD) implantation, heart transplantation and death. Events were recorded through case record review and the national death registry.
Statistical analysis
Continuous variables are expressed as mean ± standard deviation when normally distributed, or otherwise as median and interquartile range (IQR). Categorical data are presented as frequencies and percentages. The paired Student-t-test and related samples McNemar test were used to assess differences in paired continuous and categorical data, respectively. Differences in unpaired data were assessed using the Student t-test for normally distributed continuous data, the Mann–Whitney U-test for non-normally distributed continuous data and the Chi-square test for categorical data. Kaplan–Meier curves for the composite end point were estimated for patients with normal RV function and RV dysfunction. A log-rank test was performed to assess differences between the curves. The independent association between RV dysfunction and the composite end point was assessed using multivariable Cox regression by estimating hazard ratios and 95% confidence intervals after adjusting for age and sex. P-values <0.05 were considered statistically significant. Statistical analysis was performed using SPSS for Windows (version 23.0, Armonk, New York, NY, USA).
RESULTS
Study population
Eighty-six patients (age 60 ± 10 years, 73% male) met the inclusion criteria and formed the study population. Preoperative clinical and surgical characteristics are shown in Table 1. All patients had ischaemic heart failure and preoperative New York Heart Association (NYHA) Class was III or IV in 46 patients (54%). Median duration between diagnosis of heart failure and time of surgery was 1.0 (IQR 0.5–3.1) year and median preoperative European System for Cardiac Operative Risk Evaluation (EuroSCORE) II was 4 (IQR 3–8). SVR was performed during an urgent heart failure admission in 13 (15%) patients. Mean aortic cross-clamping time was 138 ± 47 min. Concomitant to SVR, CABG was performed in 38 (44%) patients, mitral valve surgery in 43 (50%) patients, tricuspid valve surgery in 23 (27%) patients and ventricular tachycardia ablation in 40 (47%) patients. Of all patients who underwent CABG, 7 (18%) patients had single-vessel disease, 17 (45%) patients had double-vessel disease and 14 (37%) patients had triple-vessel disease. Revascularization involved grafting of the left anterior descending artery in 26 (68%) patients, grafting of the circumflex artery in 26 (68%) patients and grafting of the right coronary artery in 16 (42%) patients.
Baseline clinical and surgical characteristics of the study population
| n = 86 | |
|---|---|
| Clinical characteristics | |
| Age at operation (years) | 60 ± 10 |
| Male sex (%) | 73 |
| NYHA functional class III or IV (%) | 54 |
| Duration of heart failure (years) | 1.0 (IQR 0.5–3.1) |
| EuroSCORE II (%) | 4 (IQR 3–8) |
| Previous sternotomy (%) | 8 |
| Non-elective surgery (%) | 15 |
| Surgical characteristics | |
| Aortic cross-clamping time (min) | 138 ± 47 |
| Reduction rate (%) | 47 ± 18 |
| Concomitant procedures (%) | 87 |
| CABG (%) | 44 |
| Revascularization RCA (%) | 19 |
| MV surgery (%) | 50 |
| TV surgery (%) | 27 |
| VT ablation (%) | 47 |
CABG: coronary artery bypass grafting; EuroSCORE: European System for Cardiac Operative Risk Evaluation; MV: mitral valve; NYHA: New York Heart Association; RCA: right coronary artery; TV: tricuspid valve; VT: ventricular tachycardia; IQR: interquartile range.
Clinical and echocardiographic follow-up at 2 years
Clinical and echocardiographic characteristics prior to SVR and at 2-year follow-up are depicted in Fig. 1. At follow-up, the number of patients in NYHA Class III or IV had improved from 46 (54%) to 16 (19%, P < 0.01). Echocardiography revealed a reduction in both LV end-diastolic volume index (118 ± 47 to 77 ± 24 ml/m2, P < 0.01) and LV end-systolic volume index (88 ± 45 to 50 ± 19 ml/m2, P < 0.01). LVEF improved from 28 ± 7 to 36 ± 8% (P < 0.01). Simultaneously, however, RVFAC declined from 43 ± 9 to 36 ± 11% (P < 0.01). The number of patients with RV dysfunction (defined as RVFAC <35%) increased from 13 (15%) preoperatively to 34 (40%) at 2-year follow-up (P < 0.01). The decline in RVFAC was consistent with a decline in TAPSE (18 ± 3 to 15 ± 3 mm, P < 0.01) and a decline in RV LPSS (−25 ± 7 to −20 ± 7%, P < 0.01).
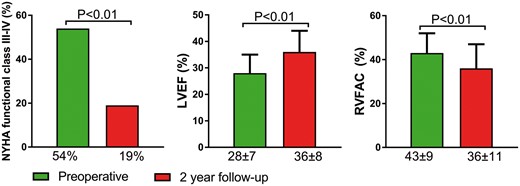
Clinical and echocardiographic characteristics preoperatively and at 2-year follow-up after surgical left ventricular restoration. NYHA: New York Heart Association; LVEF: left ventricular ejection fraction; RVFAC: right ventricular fractional area change.
Associates of right ventricular dysfunction at 2-year follow-up
Table 2 shows baseline clinical and surgical characteristics of patients with normal RV function and RV dysfunction 2 years after SVR. Patients with RV dysfunction at follow-up were more frequently male (85% vs 65%, P = 0.04), had a higher preoperative EuroSCORE II [5 (IQR 3–11) vs 4 (IQR 2–6), P = 0.04] and a longer aortic cross-clamping time (151 ± 55 vs 130 ± 40 min, P = 0.04) as compared to patients with normal RV function at follow-up. Of note, the reduction rate induced by SVR and the need for revascularization of the right coronary artery were similar between patients with and without RV dysfunction at follow-up. Table 3 shows echocardiographic measurements in patients with and without RV dysfunction 2 years after SVR. Patients with RV dysfunction at follow-up had a worse preoperative RVFAC (39 ± 9 vs 46 ± 7%, P < 0.01) and more frequently pulmonary hypertension preoperatively (18 vs 4%, P = 0.03) as compared to patients with normal RV function at follow-up. Preoperative LV volumes, LVEF, LAVI, E/E' ratio, RV end-diastolic diameter and presence of mitral regurgitation were not related to postoperative RV function. At 2-year follow-up, patients with RV dysfunction had a higher E/E' ratio (23 ± 8 vs 15 ± 8, P = 0.02) and, in line with preoperative measurements, more frequent pulmonary hypertension (27 vs 4%, P < 0.01) as compared to patients with normal RV function at follow-up. Of note, in patients with follow-up RV dysfunction the E/E' ratio had increased from 16 ± 7 preoperatively to 23 ± 8 at follow-up (P < 0.05). RV dysfunction at follow-up was not related to follow-up LV volumes, LVEF, LAVI, RV end-diastolic diameter and presence of mitral regurgitation.
Baseline clinical and surgical characteristics for patients with normal RV function versus RV dysfunction at follow-up
| RV function at follow-up | |||
|---|---|---|---|
| Normal (n = 52) | Dysfunction (n = 34) | P-value | |
| Clinical characteristics | |||
| Age at operation (years) | 59 ± 10 | 61 ± 9 | 0.43 |
| Male sex (%) | 65 | 85 | 0.04 |
| Duration heart failure (years) | 1.0 (IQR 0.4–2.3) | 1.6 (IQR 0.7–6.7) | 0.29 |
| EuroSCORE II (%) | 4 (IQR 2–6) | 5 (IQR 3–11) | 0.03 |
| Previous sternotomy (%) | 4 | 15 | 0.07 |
| Non-elective surgery (%) | 15 | 15 | 0.93 |
| Surgical characteristics | |||
| Aortic cross-clamping time (min) | 130 ± 40 | 151 ± 55 | 0.04 |
| Reduction rate (%) | 46 ± 18 | 49 ± 17 | 0.54 |
| Concomitant procedures (%) | 83 | 94 | 0.12 |
| CABG (%) | 39 | 53 | 0.19 |
| Revascularization RCA (%) | 13 | 26 | 0.13 |
| MV surgery (%) | 44 | 59 | 0.19 |
| TV surgery (%) | 19 | 38 | 0.05 |
| VT ablation (%) | 48 | 44 | 0.72 |
Bold values signifies statistical significance.
CABG: coronary artery bypass grafting; EuroSCORE: European System for Cardiac Operative Risk Evaluation; MV: mitral valve; RCA: right coronary artery; RV: right ventricular; TV: tricuspid valve; VT: ventricular tachycardia; IQR: interquartile range.
Echocardiographic characteristics preoperatively and at 2-year follow-up for patients with normal RV function versus RV dysfunction at follow-up
| RV function at follow-up | |||
|---|---|---|---|
| Normal (n = 52) | Dysfunction (n = 34) | P-value | |
| Preoperative echocardiography | |||
| LVEDVI ml/m2) | 115 ± 43 | 123 ± 54 | 0.49 |
| LVESVI (ml/m2) | 85 ± 39 | 94 ± 54 | 0.38 |
| LVEF (%) | 28 ± 7 | 27 ± 7 | 0.36 |
| LAVI (ml/m2)a | 33 ± 13 | 41 ± 13 | 0.07 |
| E/E' ratioa | 17 ± 8 | 16 ± 7 | 0.61 |
| RVFAC (%) | 46 ± 7 | 39 ± 9 | <0.01 |
| RVEDD (mm) | 33 ± 6 | 35 ± 5 | 0.16 |
| Mitral regurgitation (%) | 17 | 9 | 0.27 |
| Pulmonary hypertension (%) | 4 | 18 | 0.03 |
| Echocardiography at 2-year follow-up | |||
| LVEDVI ml/m2) | 74 ± 23 | 83 ± 24 | 0.08 |
| LVESVI (ml/m2) | 47 ± 18 | 55 ± 19 | 0.05 |
| LVEF (%) | 36 ± 9 | 34 ± 8 | 0.20 |
| LAVI (ml/m2)a | 29 ± 8 | 33 ± 9 | 0.16 |
| E/E' ratioa | 15 ± 8 | 23 ± 8 | 0.02 |
| RVFAC (%) | 43 ± 6 | 25 ± 7 | <0.01 |
| RVEDD (mm) | 34 ± 5 | 35 ± 5 | 0.25 |
| Mitral regurgitation (%) | 4 | 3 | 0.89 |
| Pulmonary hypertension (%) | 4 | 27 | <0.01 |
Bold values signifies statistical significance.
E/E': peak early diastolic mitral inflow velocity/early diastolic mitral annulus velocity; LAVI: left atrial volume index; LVEDVI: left ventricular end-diastolic volume index; LVEF: left ventricular ejection fraction; LVESVI: left ventricular end-systolic volume index; RV: right ventricular; RVEDD: right ventricular end-diastolic diameter; RVFAC: right ventricular fractional area change; MV: mitral valve.
In patients without MV repair.
Clinical implications of right ventricular dysfunction at follow-up
At 2-year follow-up, patients with RV dysfunction had more severe heart failure symptoms as compared to patients with normal RV function. In particular, 10 (30%) patients with RV dysfunction were in NYHA Class III or IV as compared to 6 (12%, P = 0.04) patients with normal RV function (Fig. 2). Furthermore, as depicted in Fig. 3, long-term outcome was significantly worse in patients with RV dysfunction as compared to patients with normal RV function; the 5-year mortality, heart transplantation and LVAD implantation rate was 49 vs 17% (P = 0.01). On multivariable Cox regression analysis, RV dysfunction remained independently associated with increased 5-year rate of the composite end point of all-cause mortality, heart transplantation and LVAD implantation (hazard ratio 3.92, 95% confidence interval 1.56–9.85, P < 0.01), after adjusting for age and sex.
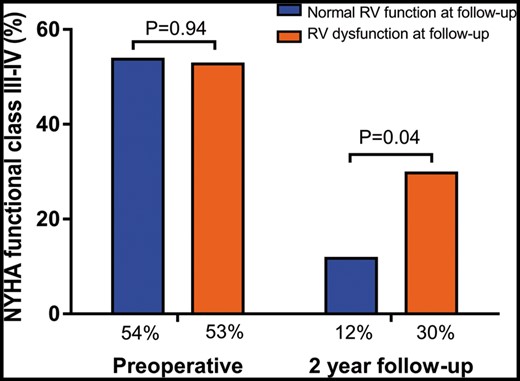
Prevalence of NYHA functional class III or IV preoperatively and at 2-year follow-up for patients with normal RV function versus RV dysfunction at follow-up. NYHA: New York Heart Association; RV: right ventricular.
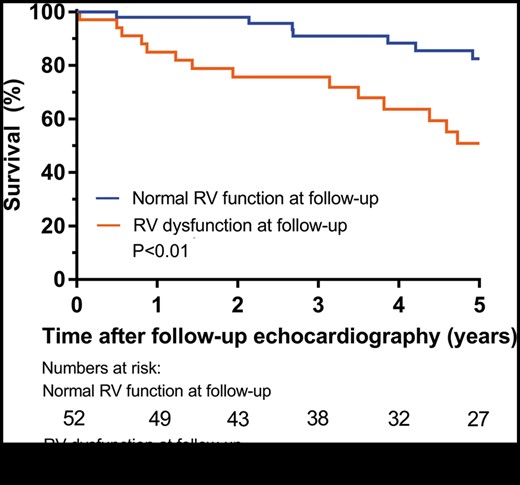
Kaplan–Meier curves for the composite end point of survival and freedom of heart transplantation and left ventricular assist device implantation in patients with normal RV function versus RV dysfunction at 2 years follow-up. RV: right ventricular.
DISCUSSION
The main findings of this study are: (i) SVR resulted in improvement in NYHA functional Class and LVEF at 2-year follow-up, but simultaneously a reduction in RV function was observed; (ii) RV dysfunction at follow-up was present in 40% of patients and was associated with worse preoperative RV function, the presence of pulmonary hypertension and higher follow-up LV filling pressures on echocardiography and (iii) patients with RV dysfunction at follow-up had more severe heart failure symptoms and impaired long-term outcome.
Surgical ventricular restoration in relation to right ventricular function
The currently observed beneficial effect of SVR on heart failure symptoms and LV systolic function is consistent with findings of previous studies [1, 2]. In particular, the percentage of patients in NYHA Class III or IV in the current study declined from 54% preoperatively to 19% at 2-year follow-up and LVEF improved from 28 ± 7 to 36 ± 8%. Simultaneously, however, RV function declined after SVR as evidenced by a worsening in RVFAC, TAPSE and RV LPSS. To our knowledge, the current study is the first to evaluate RV function after SVR, although 3 previous studies have already emphasized the implications of preoperative RV dysfunction on outcome after SVR. Garatti et al. [6] assessed the relation between preoperative RV function and clinical outcome in 324 patients undergoing SVR. RV dysfunction, defined as preoperative TAPSE <16 mm, was associated with a higher frequency of so-called ‘low-output syndrome’, postoperative inotropic support and intra-aortic balloon pump insertion. Patients with preoperative RV dysfunction had significantly lower freedom from cardiac events and worse 5- and 8-year survival. In another study, Kukulski et al. [7] visually classified RV function in 866 patients prior to SVR and found that preoperative RV dysfunction was associated with advanced LV remodelling and worse haemodynamic profiles. Moreover, the addition of SVR to CABG resulted in worse outcome in patients with RV dysfunction but not in patients with normal RV function preoperatively. A recent study from our centre assessed the implications of preoperative RVFAC <35%, TAPSE <16 mm and/or RV LPSS ≤−20% in 139 patients and found that all 3 parameters of RV dysfunction were associated with decreased 30-day survival after SVR. Furthermore, a higher number of impaired RV parameters per patient was associated with increased mortality [8]. In all previous studies, data regarding postoperative RV function were not presented.
Associates of right ventricular dysfunction after surgical ventricular restoration
In the current study, the prevalence of RV dysfunction increased from 15% preoperatively to 40% at 2-year follow-up (P < 0.01). Postoperative RV dysfunction was defined based on RVFAC because this measurement could be obtained in all patients, whereas assessment of TAPSE and RV LPSS was feasible in 73% and 85% of patients, respectively. Furthermore, RVFAC provides insight in global RV systolic function and previous data showed good correlation between RVFAC and RV ejection fraction measured by magnetic resonance imaging [15]. Several factors may have attributed to the observed reduction in RV function after SVR. Firstly, RV dysfunction after SVR could be related to a change in RV loading conditions induced by SVR. In particular, improvement in LV systolic function could have increased RV preload, while diastolic dysfunction after SVR may have caused chronic RV pressure overload. Indeed, in patients with RV dysfunction at follow-up, the E/E' ratio had increased from 16 ± 7 to 23 ± 8 (P < 0.05), indicating an increase in LV filling pressures and a decline in LV diastolic function. In contrast, in patients with a normal RV function at follow-up, the E/E' ratio remained unchanged. Two previous studies also described worsening LV diastolic properties in a subgroup of patients after SVR. Castelvecchio et al. [5] assessed echocardiographic LV function at hospital discharge after SVR in 146 patients and found worsening of diastolic function in 27 patients (18.4%). Di Donato et al. [4] observed a restrictive diastolic pattern on echocardiography in 28 (21.7%) out of 129 patients 7 months after SVR. Although both studies did neither evaluate diastolic function at long-term follow-up nor RV function at follow-up, the concept of worsening LV diastolic properties in a subgroup of patients after SVR is in line with the current study and could have resulted in RV dysfunction in a proportion of patients. Moreover, pulmonary hypertension could have contributed to RV dysfunction after SVR. Pulmonary hypertension can be the result of LV systolic and diastolic dysfunction and is an important cause of RV dysfunction in general [16]. In the current study, the prevalence of preoperative pulmonary hypertension was higher in patients with RV dysfunction at follow-up (27%) as compared to patients with normal RV function (4%, P < 0.01). Especially in patients with pre-existing pulmonary hypertension, it could be hypothesized that an additional increase in LV filling pressures induced by SVR may result in further elevation of RV afterload and can compromise RV function. Finally, it cannot be excluded that a negative effect of cardiac surgery itself on RV function may also have contributed to the current findings. Previous studies revealed worsening of RV functional parameters after CABG. For instance, Alam et al. [17] found a decrease in TV annular systolic velocity from 11.8 ± 2.4 to 9.7 ± 1.4 cm/s (P < 0.001) in a study of 35 patients 1 year after CABG. In another study, Raina et al. [18] compared echocardiographic RV function in 23 patients minimally 20 days after CABG. When compared to healthy controls, a reduction in TAPSE and RVFAC was observed, although RVFAC remained within normal range. Based on these findings, the authors concluded that the RV contractile pattern changes after cardiac surgery, with a relative loss of longitudinal shortening and gain in transverse shortening. Accordingly, the authors suggested to use global measures of RV function (such as RVFAC) rather than longitudinal measures (such as TAPSE and RV LPSS) when quantifying RV function after cardiac surgery. In line with this recommendation, in the current study RVFAC was used to quantify RV function after SVR. Nonetheless, all RV functional parameters in this study showed the same trend in preoperative and follow-up measures, indicating an overall change in RV function postoperatively. Of note, an effect of cardiac surgery itself on RV function cannot be excluded.
Clinical implications
This study demonstrated that RV dysfunction after SVR had significant implications on functional status and survival. In particular, patients with RV dysfunction 2 years after SVR had worse NYHA functional class and reduced freedom from the composite end point of implantation, heart transplantation and death at long-term follow-up as compared to patients with normal RV function. While RV dysfunction is an established determinant of outcome in the general heart failure population [19], to our knowledge, no previous study has reported on the prognostic implications of RV dysfunction after SVR. SVR should perhaps not be performed in patients at high risk for postoperative RV failure, based on the present data and previous studies [8–10]. In these patients, heart transplant and even LVAD implantation might be alternative treatment options, as previous studies showed that mechanical LV unloading decreases LV filling pressures and thereby reduces RV afterload [20, 21]. Nevertheless, LVAD implantation can also challenge postoperative RV function [22].
Limitations
Some limitations should be considered when interpreting these results. Firstly, the population comprised patients from a single centre with available follow-up 2 years after SVR. Selection bias might have occurred in this population with severe morbidity, as the availability of follow-up assessments could have been related to the patient’s clinical status. The most frequent cause of drop-out was death and also in alive patients health status might have been related with the ability to attend follow-up visits. Moreover, echocardiographic measurement of TAPSE could not be performed in patients after TV repair and speckle-tracking assessment was not available in all patients with echocardiographic follow-up in a different hospital. Nonetheless, the trend from preoperative to follow-up RV function was similar for all echocardiographic RV parameters. Further insight in the characteristics of RV myocardial function is relevant to understand the pathophysiology of RV dysfunction in LV disease. Furthermore, because of the retrospective nature of this study no information is available regarding similar heart failure patients who did not undergo SVR. Therefore, the effect of SVR on RV function in comparison to the natural course of cardiac function could not be assessed.
CONCLUSION
In conclusion, RV dysfunction at follow-up after SVR is relatively common and is associated with worse outcome. RV dysfunction after SVR was related to preoperative reduced RV function, pulmonary hypertension and an increase in LV filling pressures after SVR.
Funding
The Department of Cardiology receives unrestricted grants from Biotronik (Berlin, Germany), Boston Scientific (Marlborough, MA, USA) and Medtronic (Minneapolis, MN, USA). V.D. receives speaker fee from Abbott Vascular (Abbott Park, IL, USA).
Conflict of interest: none declared.
