


Abstract
One-lung ventilation (OLV) with general anaesthesia may increase adverse effects after thoracic surgery, specifically ventilator-induced lung injury. Spontaneous ventilation (SV) has no mechanical ventilation process, thus, we established a rabbit model to assess non-operative lung injury between OLV and SV.
Thirty-six rabbits were randomly divided into 6 groups: OLV and SV (0, 2 and 4 h). Blood gas analysis was performed after thoracic surgery. Lung tissue and bronchoalveolar lavage fluid were obtained from the non-operative lung. Pathological injury score in lung tissue and tumour necrosis factor α (TNF-α) level in bronchoalveolar lavage fluid using enzyme-linked immunosorbent assay were determined. Moreover, messenger RNA and protein of TNF-α in lung tissue were also determined by quantitative reverse transcriptase polymerase chain reaction and immunohistochemistry.
Compared with the OLV group, significantly higher partial pressure of carbon dioxide (47.78 ± 3.57 vs 38.95 ± 3.88 mmHg, P < 0.01) and partial pressure of oxygen (101.08 ± 13.1 vs 85.6 ± 11.07 mmHg, P < 0.01), as well as a significantly lower pathological injury score (6.83 ± 1.17 vs 8.83 ± 1.72, P < 0.05), TNF-α level in bronchoalveolar lavage fluid (290.32 ± 29.38 vs 368.43 ± 31.26 pg/ml, P < 0.01), TNF-α messenger RNA (6.31 ± 1.13 vs 8.6 ± 1.34, P < 0.01), immunostaining intensity in lung tissue were found at 4 h in the SV group. However, there are no significant differences between OLV and SV groups at 2 h (P > 0.05), except in TNF-α messenger RNA.
Based on this rabbit model, SV for thoracic surgery is not inferior to OLV in terms of lung injury. Considering our results, when performing time-consuming thoracic procedures under OLV, surgeons should more closely examine patients for non-operative lung injury postoperatively.
INTRODUCTION
Double-lumen endotracheal intubation under general anaesthesia can provide stable one-lung ventilation (OLV), ensuring an open and quiet surgical field [1]. Since the beginning of the 21st century, OLV with general anaesthesia has become a standard anaesthetic procedure for thoracic surgery [2]. However, several studies have reported that this method may lead to adverse complications after thoracic surgery, such as intubation-associated complications, ventilation-induced lung injury, cardiac function impairment and postoperative nausea and vomiting [3–5].
To prevent these complications of intubated general anaesthesia with OLV, spontaneous ventilation (SV) anaesthesia has been developed as an alternative choice in video-assisted thoracic surgery [5–7]. Although promising results of SV have been reported in selective patients, the pathophysiologic mechanisms to decrease the level of airway inflammation and postoperative respiratory complications in SV [7] remain unclear.
Certain studies have demonstrated that intubated general anaesthesia can induce lung injury in the ventilated lung [8, 9]. In an OLV model, the ventilated lung is the non-operative lung, while in an SV model, both lungs are ventilated during the operation. Since the tidal volume (VT) of the operative lung is relatively low due to the operative pneumothorax, the main ventilated lung is the non-operative lung. Thus, to better explore the effect of both SV and OLV on ventilated lung, we focused on the changes of the non-operative lung in each model.
Based on prior rabbit models in thoracic surgical [10, 11] and lung injury studies [12, 13], a rabbit model was established to assess the non-operative lung injury during OLV and SV. We hypothesized that SV is not inferior to OLV in terms of lung injury during thoracic surgery.
MATERIALS AND METHODS
Animals and grouping
The study protocol was approved by the Ethics Committee of the First Affiliated Hospital of Guangzhou Medical College. Thirty-six healthy New Zealand rabbits weighing 3.0 ± 0.3 kg were purchased from the Experimental Animal Center of Guangzhou province. The animals were randomly and evenly divided into either the SV group or the OLV group. Eighteen rabbits were allocated to each group. Then these 18 rabbits were also randomly divided into 0, 2 and 4 h time points, with 6 rabbits at each time point.
Establishment of the rabbit model
After 24 h fasting, all rabbits were anaesthetized with intravenous midazolam 0.1 mg/kg and 2% lidocaine. The rabbits were placed in a supine position. The external jugular vein was exposed, and the distal jugular vein was ligated. A 24–26-G puncture trocar was used and fixed by suture at the proximal artery to establish the vein channel. The same method was used for establishment of a carotid artery channel to connect with a monitoring transducer. The trachea was then isolated, sprayed with 2% lidocaine and cut at the third tracheal ring under the thyroid cartilage. Insertion of a No. 3.0 single-lumen endotracheal tube followed and was recorded with the depth of catheterization.
One-lung ventilation model
Rabbits in the OLV group were placed in a right supine position and mechanically ventilated using the following ventilator settings: inspiration pressure resulting in a VT of 10 ml/kg without positive-end expiratory pressure (PEEP); the actual measured VT was about 8 ml/kg because of the dead space of the respiratory tract; respiratory rate of 50 breaths/min; inspiratory-to-expiratory (I:E) ratio of 1:1; and fraction of inspiration (FiO2) of 0.4. After that, the rabbits were intravenously injected with 0.5 mg/kg atrocurium and pumped with 0.2 mg/h midazolam injection. Then a tracheal tube was inserted into the right lung and a 2-cm incision was made between the fifth and the sixth intercostal space under the left axilla. The adjustment of the depth of the tracheal tube was performed according to the observation of the thoracic cavity and the successful establishment of the model was identified after observation of the ventilation-induced atelectatic state of the left lung. Figure 1 shows how the tube is placed in the trachea for OLV and SV.
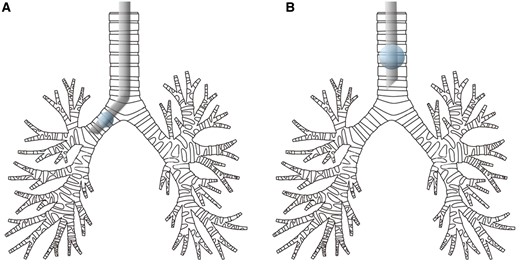
The location of the endotracheal tube for one-lung ventilation (A) and spontaneous ventilation (B).
Spontaneous ventilation model
Rabbits in the SV group were placed in a right supine position and ventilated using the ventilator settings: FiO2 of 0.4. After that, the rabbits were intravenously pumped with 0.2 mg/h midazolam injection. A 2-cm incision was then made between the fifth and the sixth intercostal space under the left axilla, and the successful establishment of the model was identified after observation of non-intubated ventilation of bilateral lungs.
For each group of rabbits, lung wedge resection was performed in the left upper lobe with about 0.5 × 0.5 cm volume tissue during surgery. Blood pressure, heart rate and blood oxygen saturation were monitored and maintained. After surgery, the blood gas sampling was performed by collecting about 2 ml of blood from the carotid artery to analyse partial pressure of oxygen (PaO2) and partial pressure of carbon dioxide (PaCO2).
Sampling
The time was started immediately after ventilation, and a 2-cm incision was made between the fifth and the sixth intercostal space under the right axilla after surgery. Biopsy was obtained from the right upper lung, fixed with 10% formalin or stored at −80°C. The animals were killed by air injection into the jugular vein. Bronchoalveolar lavage fluid (BALF) was obtained after surgery by 1 ml physiology saline flushing for 1 min and a total of 3 times after clamping of the left principal bronchus and endotracheal tube insertion into the right lung. After single-layer gauze filtration, BALF was centrifugated at 3000 rpm for 10 min, and the supernatant was kept at −80°C for further use. The inflammatory cytokine tumour necrosis factor α (TNF-α) level in BALF was measured by enzyme-linked immunosorbent assay according to manufacturer’s instructions.
Histological examination
A 0.5 × 0.5 × 0.5 cm volume tissue was obtained from the right upper lung of all rabbits and immersed in 10% formalin for fixation. All lung tissues were embedded in paraffin sectioned at 5 µm thickness and stained by haematoxylin and eosin. The lung tissues were observed under light microscopy, and 10 fields at ×200 magnification were randomly picked. The lung sections were allocated to the pathologist blinded to the study. The lung injury was assessed according to the following criteria: congestion, oedema, inflammation and haemorrhage (negative: 0; mild: 1; median: 2; strong: 3; severe: 4).
Quantitative reverse transcriptase polymerase chain reaction
Total RNA of lung tissue was extracted using TRIzol reagents. The quality and quantity of RNA were determined by spectrophotometer and agarose gel electrophoresis. One milligram RNA was used for reverse transcription, and quantitative reverse transcriptase polymerase chain reaction was performed using GoTaq qPCR Master Mix (Promega, Sunnyvale, CA, USA) with the following conditions: 95°C 3 min; 95°C 3 s and 60°C 30 s for 40 cycles. The quality of PCR products was examined through the use of a melting curve. Expression of the glyceraldehyde 3-phosphate dehydrogenase gene was assessed simultaneously in all samples as an internal control. Relative gene expression was determined by the 2–ΔΔCT method. The primer sequences used in this experiment were as follows: TNF-α: 5′-ACCACGTAGCCGTGTTCAG-3′ (sense) and 5′-GCCTAGGTCTGGGTGACAAC-3′ (antisense) and glyceraldehyde 3-phosphate dehydrogenase: 5′-AATCCCATCACCATCTTCCA-3′ (sense) and 5′-CCTGCTTCACCACCTTCTTG-3′ (antisense).
Immunohistochemistry
The expression of TNF-α level in rabbit lung tissue was assessed by immunohistochemistry method. Briefly, the section was deparaffinated with xylene, rehydrated and pretreated with microwave antigen retrieval procedure at 100°C for 5 min in 10 mM citrate buffer (pH 6.0). After incubation in 3% hydrogen peroxide for 6 min and washing with phosphate buffer saline for 3 times, the tissue sections were blocked using 50 μl goat serum for 30 min. The primary antibodies were then added, and the tissue sections were incubated at 4°C overnight. Antibodies used were as follows: anti-TNF-α (Abcam, Cambridge, MA, USA; dilution 1:100). After that, the horseradish peroxidase-conjugated streptavidin was added, followed by washing 3 times with phosphate-buffered saline. 3,39-Diaminobenzidine was used to visualize the immunostaining. After the tissue turned to yellow, the sections were washed, restained with haematoxylin containing 10% Meier, dehydrated and covered. The immunostaining results were evaluated by 2 pathologists independently in a double blind manner. A mean score value was used to express the results. Then the results were assessed by a semi-quantitative method according to the staining intensity and scope. The scores of intensity were as follows: negative: 1; weak positive: 2; positive: 3; and strong positive: 4. The staining scope was determined by randomly picking up 4 different fields under ×200 magnification and calculation of total cell and positive stained cells. The score of positive cell percentages were as follows: 0–25%: 1; 26–50%: 2; 51–75%: 3; and 76–100%: 4. The final score (s) was obtained by multiplying the staining intensity with scope and the positive ratio was as follows: −: ≤4; +: 4 < s ≤ 8; ++: 8 < s ≤ 12; and +++: 12 < s ≤ 16.
Statistical analysis
All analyses were performed with the SPSS software v. 22.0, and the data were expressed at mean ± standard deviation. Between-group comparison was performed using non-paired t-test and χ2 test. A P-value <0.05 was considered as statistical significance.
RESULTS
Blood gas analysis
Decreased PaO2 levels were found with the progress of injury and the lowest PaO2 was presented at 4 h. At 4 h, significantly higher PaO2 was found in rabbits from the SV group compared with OLV group (101.08 ± 13.1 vs 85.6 ± 11.07 mmHg, P < 0.01); however, no significant difference was found on PaO2 at 0 h (122.65 ± 18.7 vs 124.43 ± 14.89 mmHg, P = 0.86) and 2 h (115.5 ± 16.14 vs 114.1 ± 16.88 mmHg, P = 0.89) between the SV group and OLV group. Increased level of PaCO2 was found with the progress of injury and the highest PaCO2 was presented at 4 h. At 4 h, significantly higher PaCO2 was found in rabbits from the SV group compared with OLV group (47.78 ± 3.57 vs 38.95 ± 3.88 mmHg, P < 0.01); however, no significant difference of PaCO2 was found at 0 h (36.15 ± 3.14 vs 35.47 ± 2.87 mmHg, P = 0.7) and 2 h (38.33 ± 3.84 vs 36.63 ± 3.2 mmHg, P = 0.424) between the SV group and OLV group. All data described are shown in Fig. 2.
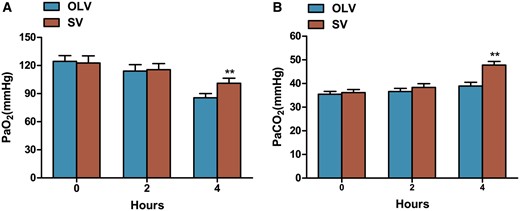
Mean arterial PaO2 and PaCO2 during surgery. Significantly higher PaO2 (A) and PaCO2 (B) were found at 4 h, but not at 0 or 2 h in rabbits from SV group compared with OLV group. Data were expressed as mean ± standard deviation. **P < 0.01 when compared with OLV group. OLV: one-lung ventilation; SV: spontaneous ventilation; PaO2: partial pressure of oxygen; PaCO2: partial pressure of carbon dioxide.
Pathological changes of lung tissue
The lung tissues from the SV and OLV groups were observed under light microscopy. As shown in Fig. 3A, significantly increased lung injury was found with the prolonged time of operation. The most severe condition manifested by increased congestion, pulmonary interstitial oedema, bleeding of alveolar cavity and accumulation and infiltration of neutrophils was found at 4 h. Haemorrhage in OLV was more serious than that of SV at 4 h. The pathological score is shown in Fig. 3B. A significantly lower pathological score was found at 4 h (6.83 ± 1.17 vs 8.83 ± 1.72, P < 0.05) in the SV group compared with the OLV group, whereas no significant difference was found on pathological score at 0 h (2 ± 0.63 vs 2 ± 0.89, P = 1) and 2 h (3 ± 0.89 vs 3.5 ± 1.05, P = 0.4) between the SV and OLV group.

Lung histology analysis to assess the lung injury. (A) Haematoxylin–eosin staining of lung tissue section at 0, 2 and 4 h. Significantly increased congestion, oedema, inflammation and haemorrhage were found at 4 h. Haemorrhage in OLV is more serious than that of SV at 4 h. (I) congestion; (II) oedema; (III) inflammation; (IV) haemorrhage (arrowhead). Original magnification: ×200. (B) Lung injury score to assess the lung tissue injury. A significantly lower lung injury score was found in rabbits from SV group compared with the OLV group at 4 h, but not at 0 or 2 h. *P < 0.05 when compared with OLV group. SV: spontaneous ventilation; OLV: one-lung ventilation.
Tumour necrosis factor α level in bronchoalveolar lavage fluid
The inflammatory cytokine TNF-α was determined by enzyme-linked immunosorbent assay. The results are shown in Fig. 4. With the prolonged operation time, the TNF-α level in BALF was gradually increased and reached to the peaked at 4 h. A significantly lower level of TNF-α was found in the SV group compared to the OLV group (290.32 ± 29.38 vs 368.43 ± 31.26 pg/ml, P < 0.01) at 4 h, whereas no significant difference was found at 0 h (181.34 ± 21.03 vs 181.38 ± 15.71 pg/ml, P = 1) and 2 h (223.16 ± 22.91 vs 237.26 ± 26.37 pg/ml, P = 0.346) on TNF-α level.
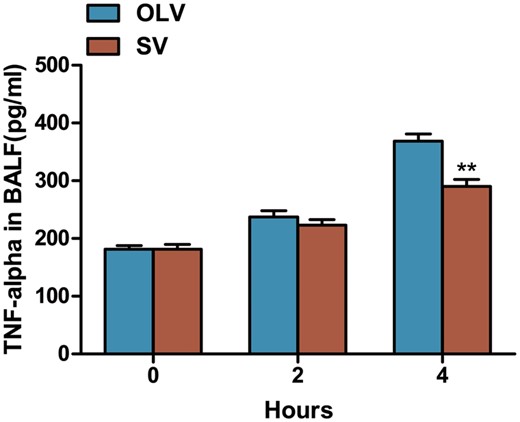
Assessment of TNF-α in BALF by ELISA. Data were expressed as mean ± standard deviation. A significantly lower TNF-α level was found at 4 h, but not at 0 or 2 h in rabbits from SV group compared with OLV group. **P < 0.01 when compared with OLV group. TNF-α: tumour necrosis factor α; BALF: bronchoalveolar lavage fluid; ELISA: enzyme-linked immunosorbent assay; SV: spontaneous ventilation; OLV: one-lung ventilation.
Tumour necrosis factor α messenger RNA expression in lung
The expression of TNF-α messenger RNA (mRNA) in the rabbit lung was detected by quantitative reverse transcriptase polymerase chain reaction. As shown in Fig. 5, increased level of TNF-α mRNA was found with the time progress and the highest level was found at 4 h. A significant lower level of TNF-α mRNA was found at 2 h (2.11 ± 0.54 vs 3.63 ± 0.48, P < 0.01) and 4 h (6.31 ± 1.13 vs 8.6 ± 1.34, P < 0.01) in the SV group compared to the OLV group.
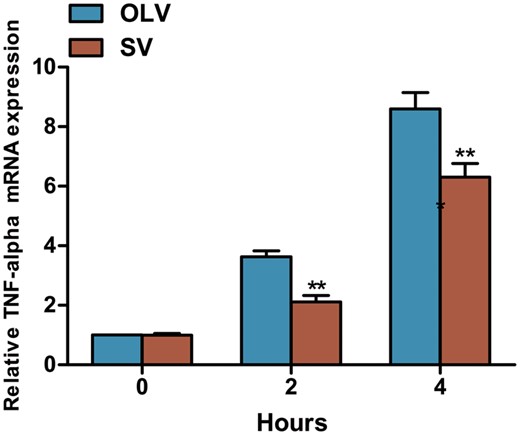
Assessment of TNF-α mRNA in lung tissue by quantitative reverse transcriptase polymerase chain reaction. Significantly lower TNF-α mRNA was found in lung tissue at 2 and 4 h, but not at 0 h in rabbits from SV group compared with the OLV group. **P < 0.01 when compared with OLV group. SV: spontaneous ventilation; OLV: one-lung ventilation; TNF-α: tumour necrosis factor α; mRNA: messenger RNA.
Immunohistochemical staining assessment of lung tumour necrosis factor α
As shown in Fig. 6, weak staining of TNF-α was found in the SV group and the OLV group at 0 h and a slight increased level of TNF-α was found at 2 h. At 4 h, positive staining of TNF-α in both groups while lower intensity of TNF-α staining was found in SV group than in the OLV group. The positive distribution of TNF-α in lung is shown in Table 1, which also suggests a lower level of TNF-α in the SV group compared to the OLV group at 4 h (P < 0.05 vs OLV).
TNF-α immunohistochemical staining
| Group | Time (h) | n | TNF-α | |||
|---|---|---|---|---|---|---|
| − | + | ++ | +++ | |||
| OLV | 0 | 6 | 5 | 1 | 0 | 0 |
| 2 | 6 | 0 | 2 | 4 | 0 | |
| 4 | 6 | 0 | 0 | 1 | 5 | |
| SV | 0 | 6 | 5 | 1 | 0 | 0 |
| 2 | 6 | 1 | 3 | 2 | 0 | |
| 4* | 6 | 0 | 1 | 5 | 0 | |
| Group | Time (h) | n | TNF-α | |||
|---|---|---|---|---|---|---|
| − | + | ++ | +++ | |||
| OLV | 0 | 6 | 5 | 1 | 0 | 0 |
| 2 | 6 | 0 | 2 | 4 | 0 | |
| 4 | 6 | 0 | 0 | 1 | 5 | |
| SV | 0 | 6 | 5 | 1 | 0 | 0 |
| 2 | 6 | 1 | 3 | 2 | 0 | |
| 4* | 6 | 0 | 1 | 5 | 0 | |
TNF-α: tumour necrosis factor α; SV: spontaneous ventilation; OLV: one-lung ventilation.
P < 0.05: at the same time point SV compared with OLV.
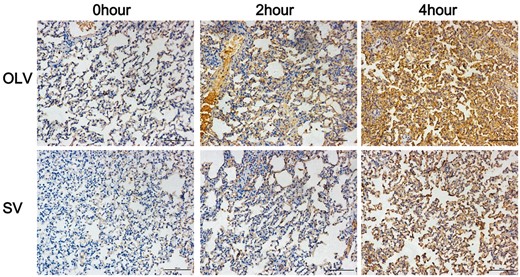
Assessment of TNF-α in lung tissue by immunohistochemical staining. Significantly lower immunostaining was found at 4 h, but not at 0 or 2 h in rabbits from SV group compared with OLV group. Original magnification: ×200. SV: spontaneous ventilation; OLV: one-lung ventilation; TNF-α: tumour necrosis factor α.
DISCUSSION
In the present study, we demonstrated that SV decrease non-operative lung injury compared with OLV at 4 h point, but no significant differences were found at 2 h. To the best of our knowledge, this is the first study to evaluate the effects of OLV and SV on lung injury during thoracic surgery in a rabbit model.
As a standard anaesthetic procedure for thoracic surgery [2], OLV can not only provide sufficient ventilation but also ensure a stable surgical field [1]. However, certain studies have concerns that this method might lead to adverse complications after thoracic surgery due to ventilator-induced lung injury [3, 5, 9].
In OLV, the pathophysiologic mechanisms of lung injury during thoracic surgery involved hyperperfusion and ventilator-induced lung injury [9]. These could lead to gas exchange impairment after thoracic surgery [14], thereby resulting in reduction of PaO2. Pathologically, lung injury could be manifested as destruction of alveolar interval and subsequent alveolar damage, including injury of lung epithelial, capillary leak, infiltration of inflammatory cell and oedema formation [8, 9, 15]. SV, however, preserves a more natural pathophysiologic status for respiratory muscle functions by avoiding muscle relaxants [16]. In addition, without mechanical ventilation, SV may improve the redistribution of pulmonary blood flow [17, 18] and induce less lung injury than OLV.
Rabbit models have been used in some studies of thoracic surgery [10, 11] and experimental models of lung injury [12, 13]. As an initiator of inflammation [19], our study used TNF-α as an index for inflammatory infiltration in the lung. Moreover, several studies revealed the severity of lung injury based on pathological score [20, 21]. Hence, based on the parameters of pathological score and expression of TNF-α, a rabbit model was used to assess the non-operative lung injury during OLV and SV.
In our study, pathological changes of lung tissue coincide with the results of the mRNA and protein level of TNF-α [19]. These data also indicate that the severity of lung injury is time dependent. Although no significant difference was observed at 2 h between the 2 groups, significant benefits were shown at 4 h in the SV group. Thus, SV may reduce lung injury of patients during thoracic surgery.
We chose 2 and 4 h time points for this study because of the difference between the calculated operative time and the actual anaesthetic time. Although most thoracic procedures can be completed within 2 h, given the time of operative preparation, waiting for the frozen section and anaesthesia, the entire surgical process can be extended to 4 h [5, 22]. The severity of lung injury depends on the settings, the duration of the mechanical ventilator, the duration of the mechanical ventilation applied to the lungs and the sensitivity of the lungs to lung injury [23]. In this study, at the 2 h time point, there was no significant difference between the OLV and SV groups except in TNF-α mRNA. At 4 h, we observed SV to have a superior protective effect on the non-operative lung compared with OLV. Thus, more sensitive detection methods and time points are needed in further studies to assess the actual degree of lung injury at different time points. Moreover, surgeons should more closely examine patients for non-operative lung injury postoperatively when performing time-consuming thoracic procedures under OLV. In addition, SV also has an advantage on the protective role of tracheal injury, cough and early eating in previous studies [5–7]. With further studies on the efficacy of SV on preventing lung injury, SV may be demonstrated as a preferred method for selected patients undergoing thoracic surgery.
In clinical practice, we observed a generally low VT under SV, which might lead to a low PaO2. However, we maintain a high PaO2 by elevating the fraction of FiO2. An acceptable PaO2 for rabbits under SV is 21% FiO2 [24]; the FiO2 of the SV group in this study is 40%. In OLV, VT (8–10 ml/kg) and zero PEEP [25, 26] or low VT (5 ml/kg, PEEP 5) [27, 28] are most commonly recommended for OLV to maintain arterial oxygenation and carbon dioxide elimination. Thus, in the OLV group, a VT of 10 ml/kg without PEEP was used. The actual measured VT was about 8 ml/kg due to the dead space in the respiratory tract.
In this study, the mechanism of higher PaO2 and higher PaCO2 in the SV group is different. The reason is the different pathophysiological mechanism of hypoxia and hypercapnia. First, higher PaO2 in SV may contribute to less lung injury and ischaemia–reperfusion injury than OLV [9]. As the diffusion capacity of CO2 is much greater than O2 [14], PaO2 is more sensitive to lung injury than PaCO2. Thus, PaO2 may decrease less significantly in SV than in OLV. Second, hypercapnia in SV may be the result of a low VT [29]. The higher PaCO2 observed in SV at 4 h is consistent with previous clinical studies [5]. They report that hypercapnia was permissive and did not affect the haemodynamics nor surgical procedures. Nonetheless, patients with poor cardiopulmonary function should be carefully examined before attempting this procedure.
Limitations
There are several limitations in this study. The size of a rabbit model is much smaller than the actual patient. First, the size of the rabbit tongue is long, thus it would be troublesome for the rabbit to maintain SV via a facemask. The size of the rabbit's throat is also small, thus there was no proper size of laryngeal mask for the rabbit to maintain SV. Hence, an endotracheal tube is still needed in SV. Second, the size of the rabbit's chest is also small, thus increasing difficulty in carrying out the operation. So we only performed a wedge resection of lung tissue instead of lobectomy on the rabbits. However, the focus of this study is on the lung injury inflicted during different ventilation methods. We created an environment as similar as possible in both groups so that the only difference would be the use of muscle relaxants and the action of SV itself to better evaluate how SV affects the non-operative lung. Further studies in larger animals such as porcine or canine models are needed for the study of SV. Despite these limitations, this study provided a unique opportunity to evaluate lung injury during SV and OLV, especially as few studies on SV regarding lung injury in thoracic surgery are performed on an animal model.
CONCLUSION
Based on this rabbit model, SV for thoracic surgery is not inferior to OLV in terms of lung injury. Moreover, we should more closely examine methods for preventing lung injury, especially in time-consuming thoracic surgery with OLV. Further research is required to better assess the protective effects of SV on the lung.
ACKNOWLEDGEMENTS
The authors wish to thank Ziyu Lin for her brilliant work on the surgical drafts and Lindsey Hamblin for her English proofreading.
Conflict of interest: none declared.
REFERENCES
Author notes
The first three authors contributed equally to this work.
