


Abstract
OBJECTIVES: Poor aerobic fitness is a potential modifiable risk factor for long-term survival and quality of life in patients with lung cancer. This randomized trial evaluates the impact of adding rehabilitation (Rehab) with high-intensity interval training (HIIT) before lung cancer surgery to enhance cardiorespiratory fitness and improve long-term postoperative outcome.
METHODS: Patients with operable lung cancer were randomly assigned to usual care (UC, n = 77) or to intervention group (Rehab, n = 74) that entailed HIIT that was implemented only preoperatively. Cardiopulmonary exercise testing (CPET) and pulmonary functional tests (PFTs) including forced vital capacity (FVC), forced expiratory volume (FEV1) and carbon monoxide transfer factor (KCO) were performed before and 1 year after surgery.
RESULTS: During the preoperative waiting time (median 25 days), Rehab patients participated to a median of 8 HIIT sessions (interquartile [IQ] 25–75%, 7–10). At 1 year follow-up, 91% UC patients and 93% Rehab patients were still alive (P = 0.506). Pulmonary functional changes were non-significant and comparable in both groups (FEV1 mean −7.5%, 95% CI, −3.6 to −12.9 and in KCO mean 5.8% 95% CI 0.8–11.8) Compared with preoperative CPET results, both groups demonstrated similar reduction in peak oxygen uptake (mean −12.2% 95% CI −4.8 to −18.2) and in peak work rate (mean −11.1% 95% CI −4.2 to −17.4).
CONCLUSIONS: Short-term preoperative rehabilitation with HIIT does not improve pulmonary function and aerobic capacity measured at 1 year after lung cancer resection.
TRIAL REGISTRY: ClinicalTrials.gov; No. NCT01258478; www.clinicaltrials.gov.
INTRODUCTION
Impairment in cardiorespiratory fitness (CRF) expressed as the peak oxygen uptake (VO2Peak) during cardiopulmonary exercise testing (CPET), has emerged as a valuable predictor of postoperative complications and long-term survival [1]. According to the European Respiratory Society and the European Society of Thoracic Surgery guidelines, patients with a VO2Peak <10 ml/kg/ml are declared unfit for major surgical resection and those with a VO2Peak <14–16 ml/kg/min are considered at high risk of early postoperative cardiopulmonary complications [2].
For surgical candidates with non-small cell lung cancer (NSCLC), a 2–4 weeks waiting time from diagnosis to resection offers the opportunity to optimize patient condition. Indeed, several studies have shown promising results in terms of improved CRF and early postoperative clinical outcome [3].
We have already reported the short-term effects of high-intensity interval training (HIIT) on CRF parameters and the early postoperative complication rate [4]. In the present analysis, we aimed to assess the safety and the benefits of preoperative HIIT compared with usual care. By reducing substantially the number of postoperative complications, we expected to provide sustained functional improvement among surviving patients. It is well-known that patients who experience major postoperative cardiovascular or respiratory complications are at higher risk of medium term mortality and higher risk of later complications. We followed the patients up 1 year after surgery and compared the clinical and functional changes that occurred in the usual care and HIIT groups.
METHODS
Study design
The Lung Cancer Rehabilitation Study was a prospective randomized open blinded end point controlled trial (PROBE) [5] using assessor blinding and intention-to-treat analysis. It was registered at the National Institutes of Health ClinicalTrials.Gov (NCT01258478) and conducted at the University Hospitals of Geneva (UHG) and the Hospital of Valais (HV). Reporting was guided by the principles outlined in the CONSORT (Consolidated Standards of Reporting Trials Statement) 2010 Statement.
Patients
After approval by the Local Ethics Committees (protocol n° 06–225), written informed consent was obtained from all eligible adult patients with proven or suspected NSCLC, stage IIIA or less. The criteria of resectability were based on the recommendations of the European Respiratory Society and European Society of Thoracic Surgery [2]. Exclusion criteria were any contraindication to perform CPET (e.g., uncontrolled cardiac disease, severe pulmonary hypertension, limitations impeding cycling) or the inability to adhere to a rehabilitation program.
Randomization
Consenting patients were randomized on a 1:1 basis into a Rehabilitation arm (Rehab) and a Usual Care arm (UC) using permuted block of 4. The randomization sequence was developed before the initiation of the trial and concealed until after enrolment.
Sample size
The main outcome of the initial trial was the early postoperative complication rate. Based on a previous cohort study, we assumed a baseline incidence of 22% major complications and expected a 50% reduction of postoperative morbidity after the introduction of preoperative rehabilitation [6]. Therefore, a sample of 178 patients per group was required (80% power; 2-sided test; type I error of 0.05) and to allow for dropouts, we intended to randomize 400 patients (200 per group). Given concerns regarding the occurrence of severe adverse events and a possible changing pattern of clinical outcome, 2 interim analyses were planned after the inclusion of 120 and 240 patients. Stopping/continuing rules were based on the following: severe adverse events related to the HIIT, changes in the rate of postoperative complications and inter-group difference in primary endpoint or in at least 2 secondary end-points. The first interim showed an overall incidence of 46% complications, therefore 44 additional patients were deemed necessary to complete the study.
Interventions
In the Rehab group, patients participated at up to 3 weekly HIIT sessions using a cycle ergometer and being supervised by respiratory physiotherapists. After a 5-min warm-up period at 50% of peak work rate (WRPeak) achieved during CPET. The patients then completed two 10 min long series of 15 s sprint intervals (at WRPeak, ‘all-out’ effort) interspersed by 15 s pauses and a 4-min rest between the 2 series. The patients then cooled down with a 5-min active recovery period at 30% WRPeak. The work rate was adjusted on each session to target near maximal heart rates towards the end of each series of sprints. All patients were given advice regarding active mobilization and risk factor management.
Lung resections were performed by open thoracotomy or video-assisted thoracoscopic surgery (VATS), and standardized perioperative interventions included antibiotic prophylaxis, restrictive fluid management, thoracic epidural analgesia and protective lung ventilation [6]. After surgery, patients were managed in a postanaesthesia care unit and were transferred to the surgical ward when the discharge criteria were met. Routine postoperative physiotherapy consisted in deep breathing using an incentive spirometer, coughing exercise and assistance with ambulation.
Measurements and outcomes
After enrolment, all patients underwent a symptom-limited CPET preceded by pulmonary function tests (PFTs) including lung volume (forced vital capacity [FVC], forced expiratory volume in 1 s [FEV1]) and carbon monoxide transfer factor adjusted for alveolar volume (KCO) that were also expressed as percentages of the predicted values for age, gender and height. At the end of the preoperative waiting period (after rehab or UC), the CPET was repeated. At 1 year after surgery, death was reported by contacting the patient or his physician (phone calls) and both CPET and PFTs were repeated.
The CPET was performed on an upright electronically braked cycle ergometer with breath-by-breath expired gas analysis (SensorMedics Model 2200 SP; Yorba Linda, CA; USA). VO2peak was determined as the highest average values over 20 s and WRPeak was identified at the highest exercise level maintained for 20 s [7].
On the day of enrolment, collected data included demographic and clinical data, diagnostic information, any comorbidities and results of lung functional and blood laboratory tests. Surgical and anaesthetic data were extracted from the electronic Patient Data Management System. Postoperatively, serious adverse events were reported according to a modified thoracic mortality and morbidity classification system [8].
The primary outcomes of the present analysis were the postoperative changes in CPET (VO2peak; WRpeak) and in PFTs (FVC, FEV1). Before surgery and at 1 year after resection, the physical performance status and dyspnoea were rated by the Zebra score (0–5 scale) and the Medical Research Council questionnaire (0–5 scale), respectively [9].
Predicted values of postoperative pulmonary function (ppoFEV1, pock, and pock) were derived using the anatomical method in which preoperative value is multiplied by the fraction of the functional lung segments expected to remain after lung resection. Accordingly, ppoFEV1 (FVC, DLCO) = prep FEV1× (19—n resected segments)/19 [10]. The actual postoperative recovery values of FEV1 and FVC were calculated as follows: measured postoperative value/predicted postoperative value × 100 (%). The actual ratio of postoperative functional loss to resected lung volume was calculated as follows: (measured postoperative value–predicted postoperative value)/predicted postoperative value ×100 (%).
Statistical analysis
All data were analysed using statistical software SPSS version 11.5 (SPSS Inc., Chicago, IL, USA) and tested with the Kolmogorov–Smirnov for normality. Summary descriptive statistics were expressed as frequencies (and percentages, %), medians (and interquartile range, IQ25–75%), or means (and 95% confidence interval (CI)). Intergroup differences were analysed by 2-sided unpaired t-test, Mann–Whitney test, or χ2 test where appropriate. The significance of pairwise difference and repeated measures was evaluated by Tukey's multiple comparison tests. Physiologically important changes were estimated as effect sizes using Cohen’s guidelines, whereby a value of 0.2 denotes a small, 0.5 a medium, and 0.8 a large effect size [11]. The effect sizes induced by the intervention was calculated by subtracting the mean changes in the UC group from the mean change in the Rehab group divided by the pooled standard deviation
RESULTS
Patients and procedures
Between October 2011 and October 2014, 189 patients were screened, 164 provided consent and 13 were excluded. Therefore, 151 patients were analysed regarding early postoperative clinical outcome, 77 in the UC group and 74 in the Rehab group; 104 patients presented at the 1 year follow-up visit (Fig. 1). The time delay from the date of enrolment to surgery was similar in the 2 groups (median of 26 days [IQ25–75%, 21–33] in the Rehab group and median of 25 days [IQ25–75%, 20–40] in the UC group). Adherence to the prescribed training sessions was 87 ± 18% (median 8 sessions, IQ25–75% [7–10]) in the Rehab group.
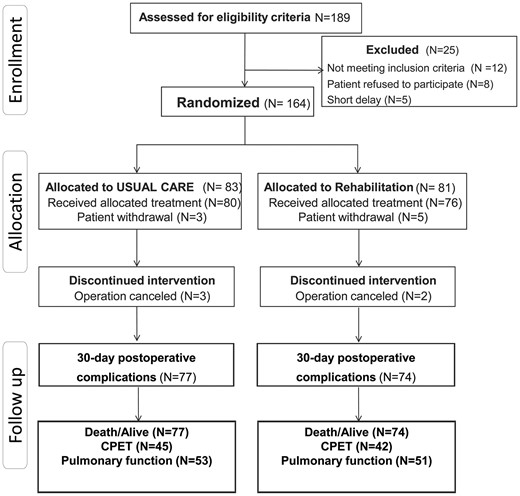
CONSORT flow diagram.
The 2 groups did not differ regarding preoperative patient characteristics (Table 1), lung cancer stages, surgical procedures and anaesthetic management (Table 2).
Baseline characteristics of the study population
| Variables | Usual care | Rehabilitation | P-value |
|---|---|---|---|
| (n = 77) | (n = 74) | ||
| Age, year | 64 (10) | 64 (13) | 0.74 |
| Body mass index, kg/m2 | 24.4 (4.1) | 25.0 (4.5) | 0.36 |
| Gender male | 50 (65) | 41 (55) | 0.64 |
| ASA classes 3 and 4 | 28 (36) | 22 (30) | 0.39 |
| Chronic obstructive lung disease | 27 (35) | 30 (41) | 0.51 |
| Hypertension | 32 (42) | 33 (45) | 0.74 |
| Diabetes mellitus | 11 (14) | 10 (13) | 1.00 |
| Coronary artery disease | 8 (10) | 10 (13) | 0.62 |
| Heart failure | 8 (10) | 8 (11) | 1.00 |
| Cardiac arrhythmias | 5 (6) | 3 (4) | 0.72 |
| History of stroke | 1 (1) | 6 (8) | 0.06 |
| Renal dysfunction (eGFR <60 ml/min) | 6 (8) | 4 (5) | 0.75 |
| Peripheral arterial disease | 13 (17) | 16 (22) | 0.54 |
| Revised cardiac risk index | 1 (1-2) | 1 (1-2) | 0.75 |
| Alcohol | 25 (32) | 15 (20) | 0.82 |
| Smoking | 0.45 | ||
| Current | 39 (51) | 28 (39) | |
| Past | 31 (40) | 43 (58) | |
| No | 7 (9) | 4 (5) | |
| Neoadjuvant chemotherapy | 9 (12) | 6 (8) | 0.59 |
Data presented as numbers (%), means (SD) analyses by unpaired Student t-test, or by Fisher’s exact test. ASA: American Society Association physical status classification; eGFR: estimated glomerular filtration rate; SD: standard deviation.
Surgical characteristics and perioperative data
| Variables | Usual care | Rehabilitation | P-value |
|---|---|---|---|
| n = 77 (%) | n = 74 (%) | ||
| Type of surgery | 0.71 | ||
| Pneumonectomy or bi-lobectomy | 17 (22) | 13 (18) | |
| Lobectomy | 45 (58) | 49 (66) | |
| Segmentectomy | 15 (19) | 12 (16) | |
| VATS | 14 (18) | 8 (11) | 0.20 |
| TNM cancer stage | 0.73 | ||
| Stage I | 40 (52) | 33 (44) | |
| Stage II | 27 (35) | 28 (38) | |
| Stage III | 10 (12) | 13 (18) | |
| Thoracic epidural analgesia | 70 (91) | 70 (95) | 0.53 |
| Patients requiring blood transfusion | 2 (3) | 9 (12) | 0.13 |
| Mean (SD) | Mean (SD) | ||
| Duration of surgery, min | 161 (54) | 160 (63) | 0.92 |
| Duration of anaesthesia, min | 245 (68) | 234 (76) | 0.35 |
| VT during OLV, ml/kg PBW | 6.2 (1) | 6.4 (1) | 0.35 |
| PEEP during OLV, cmH2O | 6 (1) | 6 (2) | 0.76 |
| PPlateau during OLV, cmH2O | 21 (8) | 22 (8) | 0.59 |
| FIO2 during OLV, % | 60 (13) | 66 (21) | 0.61 |
| Intraoperative fluids, ml/kg/h | 4.7 (1) | 5.2 (3) | 0.28 |
| IV fluids on POD1, ml | 1187 (682) | 1279 (1036) | 0.53 |
| Haemoglobin, on POD1, g/l | 11.8 (3) | 12.0 (3) | 0.61 |
| PaO2/FIO2 on POD1, % | 37 (17) | 39 (18) | 0.46 |
Data presented as n (%) analysed by Fisher’s exact test or mean (SD = standard deviation) analysed by unpaired Student t-test. FIO2: fraction of inspiratory oxygen; PEEP: positive end-expiratory pressure; PBW: predicted body weight; POD1: first postoperative day; OLV: one lung ventilation.
Before surgery, PFT and CPET parameters were similar in the 2 groups (Table 3). Noteworthy, rehabilitation resulted in significant improvements in CRF (mean VO2peak +17.7% [95% CI 4.6–12] (and mean WRPeak +9.0% [95% CI 4.5–12] whereas VO2Peak and WRPeak declined in the UC group during the preoperative waiting period (mean −6.3% [95% CI −2.9 to −9.7] and −4.9% [95% CI −2.0 to −7.8]). The effect size of the Rehab intervention was significant regarding VO2Peak (0.46, 95% CI 0.26–0.66) and non-significant regarding WRPeak (0.28, 95% CI −0.98–0.58). Postoperatively, preoperative rehabilitation was associated with a reduction in in-hospital pulmonary complications (23% vs 44% in the UC group P = 0.018) and a shorter stay in the postanaesthesia care unit (median −7 h, IQ25–75% −4 to −10).
Pulmonary function and cardiopulmonary exercise test before surgery
| Variables | Usual care | Rehabilitation | P-value |
|---|---|---|---|
| (n = 77) | (n = 74) | ||
| FVC, l | 3.61 (3.40–3.82) | 3.39 (3.17–3.61) | 0.15 |
| FVC, % pred | 104 (99–109) | 102 (98–106) | 0.44 |
| ppoFVC, l | 2.70 (2.51–2.99) | 2.58 (2.38–2.78) | 0.44 |
| FEV1, l | 2.45 (2.28–2.62) | 2.29 (2.10–2.48) | 0.23 |
| FEV1, % pred | 87.6 (83.3–91.9) | 85.8 (80.7–90.9) | 0.59 |
| ppoFEV1, l | 1.82 (1.82–1.96) | 1.75 (1.59–1.91) | 0.49 |
| KCO, mmol/min/kPa/l | 1.17 (1.09–1.25) | 1.27 (1.20–1.34) | 0.09 |
| KCO, % pred | 88.1 (83.6–92.6) | 90.4 (84.6–96.2) | 0.56 |
| ppoKCO, mmol/min/kPa/l | 0.88 (0.82–0.94) | 0.88 (0.84–0.92) | 0.43 |
| VO2Peak, at CPET 1, ml/kg/min | 20.4 (19.1–21.7) | 19.9 (18.6–21.2) | 0.56 |
| at CPET 2, ml/kg/min | 19.1 (17.9–20.3) | 21.1 (18.7–22.5) | 0.06 |
| VO2Peak, at CPET 1, % pred | 82 (78–86) | 83 (78–88) | 0.83 |
| at CPET 2, % pred | 76 (72–81) | 88 (82–94) | <0.01 |
| WRpeak at CPET 1, Watts | 99 (90–108) | 96 (88–104) | 0.42 |
| at CPET 2, Watts | 98 (89–107) | 102 (98–106) | 0.39 |
Data presented as mean (95% CI) and analysed by unpaired Student t-test. FVC: forced vital capacity; ppo FVC: predicted postoperative FVC; FEV1: forced expiratory volume in 1 s; ppoFEV1: predicted post-operative FEV1; KCO: diffusion capacity of carbon monoxide; ppoKCO: predicted postoperative KCO; VO2Peak: peak oxygen uptake; WRPeak: peak work rate; CPET1: cardiopulmonary exercise testing at baseline; CPET2: cardiopulmonary exercise testing 2–3 days before surgery (after usual care or rehabilitation).
At 1 year after lung cancer resection, a total of 12 deaths was reported and survival was similar in the 2 groups (90.9% in the UC and 93.2% in the Rehab group, P = 0.506). As shown in Figs 2 and 3, lung function parameters were well preserved 1 year after surgery compared with preoperative values, regardless of group allocation with non-significant changes in FVC (mean −4.9%, 95% CI −8.6 to −1.2 in the UC group and mean −6.2%, 95% CI −2.3 to −10.1 in the Rehab group; P = 0.705), in FEV1 (mean −6.6%, 95% CI, −3.6 to −9.6 in the UC group and mean −8.3%, 95% CI, −4.3–12.0 in the Rehab group; P = 0.565) and in KCO (mean 7.1%, 95% CI, 2.4–11.8 in the UC group and mean 4.4%, 95% CI 0.8–9.6 in the Rehab group; P = 0.553). Regarding CPET parameters, the 2 groups evolved similarly 1 year after surgery with significant reduction in VO2Peak (mean −12.8%, 95% CI −9.7 to −15.9% in the UC group and mean −11.5%, 95% CI −4.8 to −18.2 in the Rehab group) and in WRPeak (mean −12.1%, 95% CI −6.8 to −17.4 in the UC group and mean −10.1%, 95% CI −4.2 to −16 in the Rehab group) (Table 4). Changes in CPET parameters and PFTs were not different among patients receiving or not postoperative chemo/radiotherapy (both treatments, n = 13; radiotherapy, n = 12; and chemotherapy, n = 23). Patients who underwent pneumonectomy or bi-lobectomy presented greater decrease in FEV1 (median −16%, IQ25–75%, −7 to −22% vs median −3%, IQ25–75%, −12 ± 6% in lesser resection; P < 0.003) and VO2peak (median −17%, IQ25–75%, −25 to −10% vs median −10%, IQ25–75%, −19 to −1% in lesser resection; P = 0.044) at 1 year follow up. Perception of dyspnoea and rating of physical performance status were unchanged at 1 year post-surgery and similar in the 2 groups (Table 5).
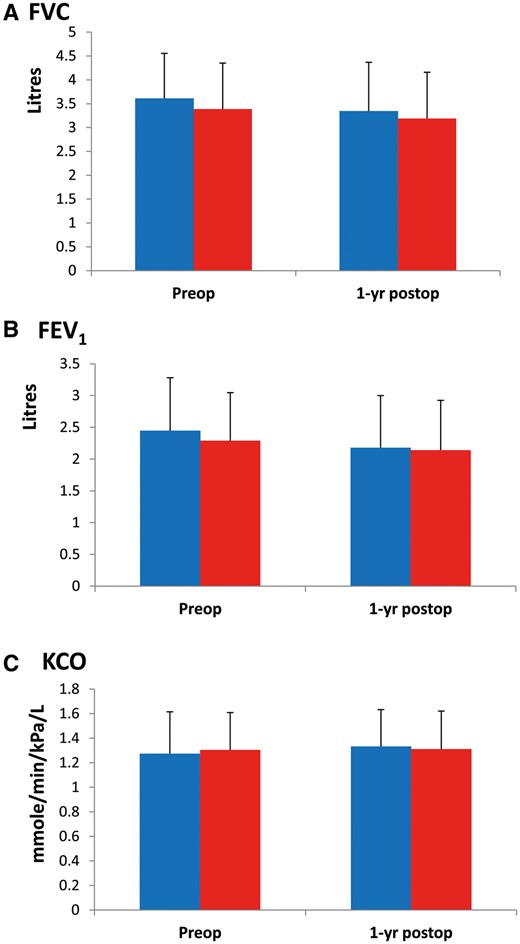
Preoperative and 1-year postoperative measurements of FVC (A), FEV1 (B) and KCO (C) in the UC ( ) and the Rehab group (
 ). No difference between the 2 groups, bars indicate standard deviation.
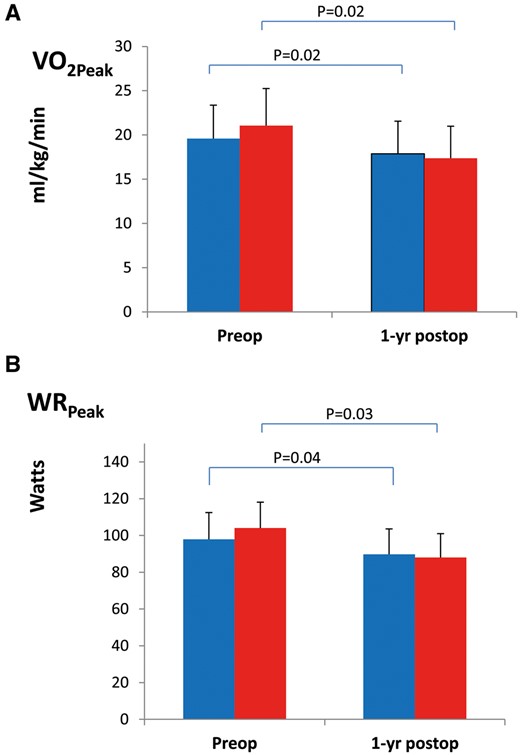
Preoperative and 1-year postoperative measurements of VO2peak (A) and WRpeak (B) in the UC () and the Rehab group (). P-values for intra-group comparison, preoperative baseline versus 1-year post-resection are shown on top, bars indicate standard deviation.
Changes in exercise capacity and pulmonary function in patients receiving usual care or rehabilitation
| Variables | Usual care | Rehabilitation | P-value |
|---|---|---|---|
| (n = 42) | (n = 4) | ||
| ΔVO2peak preop 1–2, ml/kg/min | −1.5 (−3.2 to 0.5) | +2.9 (1.1 to + 4.2) | <0.01 |
| ΔVO2peak preop-postop, ml/kg/min | −12.8 (−9.7 to -15.9) | −11.5 (-4.8 to -18.2) | 0.80 |
| ΔWRpeak preop 1–2, Watts | −4 (−9 to + 1) | +8 (+1 to + 15) | 0.02 |
| ΔWRpeak 1-year, Watts | −12.1 (−6.8 to −17.4) | −10.1 (−4.2 to −16.0) | 0.70 |
| ΔFVC 1-year, % | −4.9 (−8.6 to −1.2) | −6.2 (−2.3 to −10.1) | 0.69 |
| ΔFEV1 1-year, % | −6.6 (−3.6 to −9.6) | −8.3 (−4.6 to −12.0) | 0.56 |
| ΔDLCO 1-year, % | 7.1 (2.4 to 11.8) | 4.4 (−0.8 to 9.6) | 0.56 |
Data presented as mean (confidence interval 95%); 3
ΔpeakVO2 preop 1–2, preoperative change in peak oxygen uptake, after usual care or rehabilitation; 4
ΔVO2peak 1-year, change in peak oxygen uptake at 1 year after surgery; 5
ΔWRpeak preop 1-2, preoperative change in peak work rate after usual care or rehabilitation; 6
ΔWRpeak preop 1-2, change in peak work rate at 1 year after surgery; 7
ΔFVC 1-year, change in forced vital capacity at 1 year after surgery; 8
ΔFEV1 1-year, change in forced expiratory volume at 1 year after surgery; 9
ΔDLCO 1-year, change in diffusion capacity to carbon monoxide at 1 year after surgery
Assessment of dyspnoea and physical performance status
| Variables | Before surgery | One year after surgery | |
|---|---|---|---|
| MRC dyspnoea score | |||
| Usual care group (n = 53) | |||
| Median, IQ 25–75% | 1 (0–1) | 1 (0–1) | 0.78 |
| n (%) patients with score ≥2 | 12 (15.6) | 6 (11.5) | 0.30 |
| Rehabilitation group (n = 51) | |||
| Median, IQ 25–75% | 1 (0–1) | 1 (0–1) | 0.91 |
| n (%) patients with score ≥2 | 18 (24.3) | 8 (14.8) | 0.23 |
| Zubrod physical performance score | |||
| Usual care group (n = 53) | |||
| Median, IQ 25–75% | 1 (0–1) | 1 (0–1) | 0.83 |
| n (%) patients with score ≥2 | 5 (6.5) | 5 (9.6) | 0.33 |
| Rehabilitation group (n = 51) | |||
| Median, IQ 25–75% | 1 (0–1) | 1 (0–1) | 0.94 |
| n (%) patients with score ≥2 | 11 (14.9) | 8 (14.8) | 0.99 |
DISCUSSION
Preparing patients before lung cancer resection with a HIIT program did not improve clinical and functional outcome at 1 year after surgery. Although rehabilitated patients presented significant improvements in aerobic fitness parameters before surgery that were associated with a 45% reduction in postoperative pulmonary complications compared with usual care, there was no significant impact on survival nor changes in lung volumes, gas diffusion capacity and oxygen uptake at 1 year follow-up.
It is well known that sharp declines in FVC and FEV1 occur within the first 2 weeks after lung resection surgery that are followed by a variable recovery over the subsequent 3–6 months [12–14]. Postoperative impairment in ventilation and exercise capacity originate from a complex spectrum of interacting factors including the inhibiting effects of thoracic pain, the loss of pulmonary volume corresponding to the resected segments and the reduction in skeletal muscle mass and contractile performances [15–17]. Thus, decrease in postoperative oxygen uptake is larger than lung function loss. In our study, we observed at 1 year a 4% loss in FEV1, while VO2peak decreased by 16%.
In the current trial, the majority of patients underwent a lobectomy or lesser resection and we reported minimal changes in forced exhaled lung volumes, gas diffusion capacity and perceived breathlessness. Not surprisingly, the actual postoperative falls in FEV1, FVC and KCO were larger in patients with pneumonectomy and bi-lobectomy whereas patients undergoing lobectomy or lesser resection had unchanged PFTs at 1 year after surgery compared with preoperative assessment. In agreement with our findings, prior studies have reported no residual functional loss after lobectomy and a permanent loss of 15–20% FEV1 after pneumonectomy [18–21].
Despite preserving lung volume and gas exchange, surviving operated patients presented a 10–20% decline in VO2peak and WRpeak over the first year after lung cancer resection. This impairment in aerobic exercise capacity likely resulted from the combined effects of ageing and further postoperative deconditioning.
In this randomized controlled trial, the short-term preoperative HIIT involving respiratory and leg muscles failed to demonstrate long-term improvements in exercise tolerance, perception of breathlessness and physical performance status. HIIT has been demonstrated in animal models to be able to induce protective cardiopulmonary phenotypes and to enhance oxygen extraction in skeletal muscle by increasing capillary density, mitochondrial numbers and oxidative capacity [22, 23]. Traditional endurance training increases blood volume and improves cardiac output and muscle oxygen extraction. HIIT essentially skeletal muscle oxidative capacity without any changes in cardiac performance and blood-oxygen carrying capacity [24]. An important mechanism is an increase in the mitochondrial mass and the respiratory capacity within skeletal muscles [25]. These changes can be brought about by even a few sessions of HIIT [26]. Also, HIIT seems interesting on an economical level, as the cost of 1 session is only about 20 Euros.
Recently, Kim et al. [27] demonstrated the functional benefits of a 6-month home-based rehabilitation program that was started immediately after lung resection surgery. Interestingly, training exercises focused on respiratory muscles (20-min sessions, at least 3 times a day) led to improved inspiratory and expiratory forces and prevented the postoperative decline in FEV1 and FVC while mitigating pain and improving breathlessness. Lack of long-term postoperative training and the absence of a patient education program regarding everyday physical activity may explain the loss of oxygen uptake capacity in both UC and Rehab groups [28].
Limitations
There are several limitations to this study: (i) the low number of VATS cases done that does not fit to our current practice; VATS may generate less inflammation and enhance faster recovery; (ii) more meaningful results might have been obtained by targeting high risk patients with a VO2peak <16 ml/kg/min but inclusion into the trial would have been too slow. On the other hand, the beneficial effect of reducing postoperative pulmonary complications was present in all patients regardless of baseline oxygen uptake; (iii) although all patients or their doctors responded to phone calls, up to one-third failed to perform PFTs and CPET at follow-up for unknown reasons.
CONCLUSION
In conclusion, we demonstrate that a HIIT program limited to the preoperative period is not associated with better functional and clinical outcome 1 year after lung cancer surgery. Given the proven and dose-dependent benefits of physical training in preventing diseases and functional decline, the use of a dedicated aerobic based exercise program needs to be ascertained in randomized controlled trials, and should also include an arm with long term postoperative physical training and physical activity counselling.
ACKNOWLEDGEMENTS
We thank pulmonogists (Paola Gasche-Soccal, Jean-Paul Janssens, Frédéric Lador, Thierry Rochat, Jean-Marie Tschopp), oncologist (Nicolas Mach and Arnaud Roth), anaesthesiologists (Patrick Ravussin and Daniel Rudaz), respiratory physiotherapists (Sarah Fournier and Pierre-Yves Roberfroid) and technicians of the pulmonary function lab (Nathalie Geraudel) at the University Hospital of Geneva and the Hospital of Valais, for participating in patients screening and assistance during the study.
Funding
This is study was supported by the Centre de la Recherche Clinique of the University Hospital of Geneva and the Ligue Genevoise contre le Cancer.
Conflict of interest: none declared.
REFERENCES
APPENDIX. CONFERENCE DISCUSSION
Dr D. Waller (Leicester, UK): Congratulations on performing what Prof. Lim and I know to be a very difficult task, conducting a prospective, randomized, blinded, multi-disciplinary trial in thoracic surgery.
You came up with a negative result, and if I'm going to try and persuade my cash-strapped state healthcare system to invest in more physiotherapy, I really need some more evidence to justify it. So why do you think you had a negative result in the long-term? I will ask you to consider 3 areas.
Was there an inadequate training regimen? You talked about high-intensity training. Should you have concentrated more on endurance training in a different way with a different physiotherapy regimen?
Do you think it was the wrong target population? Only 15 of the 151 patients had COPD. Their preoperative lung function was amazingly good compared with the patients I operate on, with FEV1s around 88% of predicted. That applies to only a very small percentage of the patients we operate on. A very high VO2 max, 80-odd percent predicted preoperatively. Also, there were very few patients who had video-assisted lung resections: only 22 had a VATS lung resection. So, do you think you could have targeted a different population and may have seen a better result?
Finally, do you think you used the wrong assessment tools in the long-term assessment? More clinically relevant things may have been readmission rates and, of course, related to the patient, quality of life measures may well have been more useful.
So, can you consider those three areas in relation to why you may have seen a negative result: the inadequacy of a different training regime, with a different target population you may have a different result, and a different assessment tool in the long-term? But, nonetheless, an excellent study.
Dr Karenovics: In the short preoperative time period, it would be difficult to achieve significant improvements with a different training method such as endurance training, because it relies on improvement of cardiac output and muscle oxygen extraction, et cetera, whereas high-intensity interval training probably increases capacity to extract oxygen by increasing mitochondrial mass and respiratory capacity within skeletal muscles. It would certainly be good to continue exercise after surgery–maybe with a different sort of training.
I completely agree that lung function in this group was very good. Actually, only 25% of patients in each group had a VO2 maximum below 15. In order to obtain a more significant result, it would be interesting to focus on those patients. And that is what we do now in clinical practice: we only refer patients who seem a bit borderline for a resection.
With regard to VATS, it is true that was very low. Now it is very different: we have an 85% VATS resection rate. And what was the last part of your question?
Dr Waller: In the long-term, could you have looked at different assessments of effectiveness, especially things like readmission rates, hospital infection complications, and particularly health-related quality of life?
Dr Karenovics: There was no difference between the 2 groups with respect to readmission or quality of life, et cetera. But then again, it was only a very short intervention, which was discontinued.
Dr E. Lim (London, UK): What was the primary outcome on which you based your sample size calculation?
Dr Karenovics: The sample size was calculated to demonstrate a 50% reduction in postoperative complications. Based on previous results, we expected a complication rate of about 20–25% but found at interim analysis that it was 50%. So, we ended up with a smaller sample size than was initially planned.
Dr S. Bölükbas (Wuppertal, Germany): It is our aim to navigate our patients through the postoperative period without complications, and you showed us that your pulmonary complications were fewer in the experimental group compared to the control group. However, you had an atelectasis rate of 12% in the experimental arm, which is quite good, but in the control arm it was 40%, which is quite high. How do you explain this difference? In terms of management, do you perform bronchoscopic clearance of the bronchial tree at the end of the surgery? What was the distribution of current smokers in both groups?
Dr Karenovics: I can't remember the proportion of current or former smokers. I can explain the difference between the 2 groups by the improvement of the inspiratory muscle strength and performance in the rehabilitation group. I can't explain why in the other group it is so high. It is just the way it was; maybe if you look carefully for a problem, you’ll find it more often.
Dr A. Brunelli (Leeds, UK): A very interesting study. This is one of the few rehab studies demonstrating some benefit, at least in terms of postop complications. I wonder whether you have considered doing a health economics analysis comparing the costs and benefits of instituting a rehab programme such as this?
Dr Karenovics: It would be very interesting but, no, so far we haven't.
Dr Brunelli: This may perhaps justify the institution of such a programme with your administration.
Dr S. Tenconi (Leicester, UK): It is just a practical question, because I am running a similar study, and I am struggling a bit with patients who were receiving preop or postop chemotherapy. These are quite wide inclusion criteria. You included patients with N1 or N2 disease.
My question is, do you normally do preop chemotherapy in your institution for N2 patients, and, if that is the case, how do you schedule your intervention in those patients? Or if you do postop chemotherapy in N1 and N2 disease, have you seen any differences in your results in this group of patients?
Dr Karenovics: We have both scenarios. If the patient receives preoperative chemotherapy, the exercise programme would start at the end of the chemotherapy prior to surgery, and, no, there was no difference between those patients and other rehabilitated patients.
Dr E. Lim: Can I ask 1 possibly final question. You demonstrated very nicely the survival curves at high, medium and low VO2 max levels. It is associated with differences in survival. That is quite well known. But what I am really interested in finding out is, do you think this is modifiable? Do you think that going for rehabilitation in pushing your VO2 max up to that level actually influenced survival, or is it a reflection of your baseline VO2 max from the outset?
Dr Karenovics: It is difficult to tell. Obviously we could increase the oxygen uptake with exercise. So we could hope it will have an impact. But then obviously there are patients who will not respond to exercise preoperatively–approximately 20–25% did not respond to the exercise programme–and so there certainly will be patients who simply cannot achieve such a high oxygen uptake or who will not respond. But those that do respond, and ideally continue exercise afterwards, might improve their survival.
Author notes
Presented at the 24th European Conference on General Thoracic Surgery, Naples, Italy, May 29– June 1, 2016.
