


Abstract
OBJECTIVES: More than 20% of lung cancer patients develop a recurrence, even after curative resection. We hypothesized that relapse may arise from the dissemination of circulating tumour cells (CTCs). This study evaluates the significance of CTC detection as regards the recurrence of non-small-cell lung cancer (NSCLC) in surgically resected patients. Secondly, we investigated the association between CTCs and the uptake of 18F-fluorodeoxyglucose (FDG) by the primary tumour on a positron emission tomographic (PET) scan.
METHODS: In this single-centre prospective study, blood samples for analysis of CTCs were obtained from 102 patients with Stage I–IIIA NSCLC both before (CTC1) and 1 month after (CTC2) radical resection. CTCs were isolated using immunomagnetic techniques. The presence of CTCs was correlated with the maximum standardized uptake value (SUVmax) measured on preoperative FDG PET/computed tomographic scans. Recurrence free survival (RFS) analysis was performed.
RESULTS: CTCs were detected in 39.2% of patients before and in 27.5% 1 month after the operation. The presence of CTCs after the operation was significantly correlated with SUVmax on PET scans, pathological stage and surgical approach. Only SUVmax was an independent predictor for the presence of CTC2 on multivariate analysis. Postoperative CTCs were significantly correlated with a shorter RFS (P = 0.005). In multivariate analysis, the presence of CTC2 was associated with RFS, independent of disease staging.
CONCLUSIONS: Detection of CTCs 1 month after radical resection might be a useful marker to predict early recurrence in Stage I–III NSCLC. The SUVmax value of the primary tumour on preoperative PET scans was associated with the presence of CTC 1 month after the operation.
INTRODUCTION
Despite recent advances, the outcomes of patients with lung cancer remain poor globally [1]. In the early stages of non-small-cell lung carcinoma (NSCLC), surgical treatment is considered the most effective treatment. However, a large number of recurrences are observed even after complete resection [2].
Tumour-node-metastasis (TNM) staging represents the most important factor for determining prognosis and deciding on the best treatment. However, it provides incomplete biological information and, in many cases, no explanation for the differences in recurrence in the early stages and overall survival. Therefore, there is an urgent need for prognostic biomarkers able to predict the risk of recurrence in lung cancer patients after curative resection, thereby identifying those more likely to benefit from adjuvant therapy [3, 4].
Among different promising biomarkers, detection and characterization of circulating tumour cells (CTCs) in the blood of cancer patients have lately attracted increasing interest. Recent evidence supports the observation that cancer is disseminated by the spread of tumour cells from the primary tumour into the bloodstream. Detection of these CTCs is associated with a worse prognosis and a higher risk of relapse [5]. Additionally, the characterization of CTCs may provide a molecular profile of a tumour, representing tumour heterogeneity even better than a single tumour biopsy [6, 7].
Otherwise, molecular imaging, mainly positron emission tomography (PET), plays a fundamental role in the management of patients with lung cancer. A PET/computed tomography (CT) scan is routinely performed for staging, restaging, treatment planning and follow-up [8]. PET imaging using the tracer 18F-fluorodeoxyglucose quantifies the metabolic function of the tumour, differentiating metabolically highly active from less active tumour tissues and therefore offering an opportunity for non-invasive, in vivo tissue characterization.
Studies have shown that the degree of FDG uptake by the tumour, as assessed with the maximum standardized uptake value (SUVmax), is a significant prognostic factor in NSCLC, related to the metastatic potential of the tumour [9, 10]. Both the detection of CTCs and PET scans may play complementary roles as non-invasive assays to obtain biological information related to tumour proliferation and metabolic activity [11]. However, few studies have investigated the correlation between uptake value on PET scans and CTCs.
With this background, our first aim was to evaluate the significance of the detection of CTCs in relation to the recurrence rate in surgically resected NSCLC. Secondly, we investigated the association between CTCs and primary tumour FDG uptake on PET scans.
METHODS
We performed a single-institution prospective study, including 102 consecutive patients who underwent curative resection for previously untreated NSCLC at Virgen de las Nieves University Hospital (Granada, Spain) between November 2012 and February 2015. Peripheral blood samples were collected from each patient before and 1 month after surgery for CTC analysis. Pretreatment PET/CT scans, as part of the initial staging, were obtained for 95 patients. There was a control group of 25 healthy volunteers.
All patients underwent anatomical pulmonary resection and systematic lymph node dissection with curative intent. No patient had received induction therapy or had concurrent or prior malignancy in the previous 5 years. Perioperative death was an exclusion criterion. Informed consent was obtained from each patient, and the study was approved by the local ethics committee.
Indication for adjuvant treatment was established by the local tumour committee according to the guidelines of the American Society of Clinical Oncology. Adjuvant treatment was initiated after the second determination of CTCs.
The follow-up schedule was that usually performed for resected NSCLC and comprised a first clinical visit 1 month after surgery, then once in every 3 months in the first year and finally once in every 6 months from the second to the fifth years. At least 1 chest CT scan was performed every 6 months and 1 PET/CT study was done per year [12].
Circulating tumour cell analysis
Peripheral blood samples were collected before the operation (CTC1) (2–16 h before) and 1 month after (CTC2) and sent to the GENyO Centre for immunomagnetic analysis of the CTCs.
Blood samples were collected in 10-ml CellSave Preservative Tubes (Veridex, LLC, Johnson & Johnson Company, New Brunswick, NJ, USA), stored at room temperature and processed within 72 h of collection. Samples were processed according to the protocol previously established [13] (Supplementary Material, Text 1).
The samples were first processed by density gradient centrifugation. For CTC enrichment, we used the Carcinoma Cell Enrichment and Detection Kit with MACS Technology (Miltenyi Biotec, Bergisch Gladbach, Germany). CTCs were identified by immunocytochemical methods and visualized under a direct light microscope to perform the combined cytomorphological and immunophenotypic assessments. Citoqueratin (CK)-positive cells were identified by immunohistochemical assays and signals were detected by chromogenic and fluorescent assays. Epithelial tumour cells were identified and counted based on their red staining [12] (Fig. 1).

Circulating tumour cell (CTC) from a NSCLC patient, marked with an anti-Cytokeratin antibody, revealed with an Alkaline-Phosphatase antibody using freshly prepared Fast Red TR/Naphthol AS-MX substrate and observed with a confocal microscope Zeiss LSM 710.
Statistical analysis
Patients were considered CTC positive if at least 1 CTC was isolated. CTCs were assessed both as continuous variables and as binary qualitative variables (presence/absence). Categorical variables were compared by the Fisher’s exact test and continuous variables by the t-test and analysis of variance.
Receiver-operating characteristic (ROC) curve analysis was performed to determine the optimal cut-off of the SUV value on the PET scan for prediction of the presence of CTCs.
A possible correlation between CTCs and clinicopathological characteristics was analysed, and multivariate logistic regression analyses were performed including variables statistically significant in univariate analyses. A stepwise backward selection was performed.
Clinical outcomes were evaluated in terms of recurrence-free survival (RFS), which is defined as the interval between the date of surgery and the date of relapse expressed in number of months. To calculate recurrence-free probability, patients who died without recurrence were censored.
For univariate analyses, RFS survival rates were estimated using the Kaplan–Meier method, and differences were determined using the log-rank test. Multivariate analysis was performed using the Cox’s proportional hazard regression model. P-values <0.05 were considered statistically significant. Statistical analyses were carried out using SPSS/PC ver. 21.0.
RESULTS
A total of 102 consecutive patients with NSCLC were enrolled in this study. Main patient characteristics and surgical details are summarized in Table 1. Lobectomy was the most frequent resection technique, performed using video-assisted thoracic surgery in 42.2% of cases. A preoperative FDG PET/CT scan was performed in 95 patients. The mean SUVmax value of the primary malignancy was 11± 5.7 (mean ±SD).
Clinicopathological and treatment-related characteristics of patients with non-small-cell lung cancer included in the study
| n (%) | |
|---|---|
| Gender | |
| Men | 89 (87.3) |
| Women | 13 (12.7) |
| Age (years) | |
| Mean ± SD | 66.2 ± 8.6 |
| <70 | 60 (58.8) |
| ≥70 | 42 (41.2) |
| Smoking status | |
| Ex-smoker | 63 (61.8) |
| Never smoked | 10 (9.8) |
| Current smoker | 29 (28.4) |
| PET (SUVmax) | |
| Mean ± SD | 11.0 ± 5.7 |
| <11 | 54 (52.9) |
| ≥11 | 41 (40.2) |
| NA | 7 (6.9) |
| Surgical approach | |
| Thoracotmy | 59 (57.8) |
| VATS | 43 (42.2) |
| Type of resection | |
| Lobectomy | 76 (74.5) |
| Pneumonectomy | 18 (17.6) |
| Segmentectomy | 8 (7.8) |
| Histology | |
| Adenocarcinoma | 47 (46.1) |
| Squamous cell carcinoma | 50 (49) |
| Other | 5 (4.9) |
| Pathological stage | |
| IA | 24 (23.5) |
| IB | 24 (23.5) |
| IIA | 23 (22.5) |
| IIB | 12 (11.8) |
| IIIA | 19 (18.6) |
| N status | |
| N0 | 75 (73.5) |
| N1 | 15 (14.7) |
| N2 | 12 (11.8) |
| Tumour size (cm) | |
| Mean ± SD | 3.9 ± 2.1 |
| ≤3 cm | 44 (43.1) |
| >3 cm | 58 (56.9) |
| Adjuvant chemotherapy | |
| Yes | 39 (38.2) |
| No | 63 (61.8) |
| Adjuvant radiotherapy | |
| Yes | 6 (5.9) |
| No | 96 (94.1) |
PET: positron emission tomography; SUVmax: maximum standardized uptake value; VATS: video-assisted thoracic surgery; N: node; SD: standard deviation; NA: not available.
CTCs were detected in blood samples from 40 (39.2%) of the 102 patients before the operation and in 28 cases (27.5%) 1 month after the operation (Fig. 2).
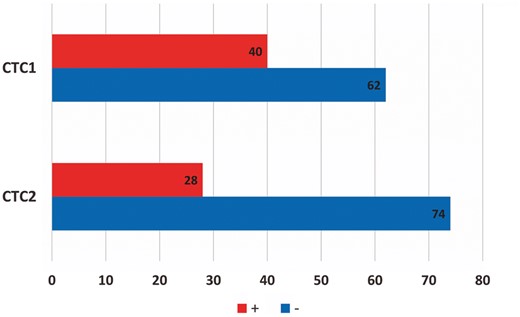
CTC positive (+) and negative (−) patients before (CTC1) and after the operation (CTC2). CTC: circulating tumour cells.
For CTC-positive patients, the mean level of CTCs was 5.4 ± 13 (mean ± SD) per 10 ml before and 2.8 ± 2.1 after the operation. Dynamic changes in the numbers of CTCs were also evaluated. We found that most patients with CTCs at baseline presented a decrease in the second detection (34 of 40), from a mean number of detected cells of 5.8 ± 14.1 before to 0.4 ± 0.8 1 month after the operation (P = 0.031; Supplementary Material, Fig. S1).
An increase was observed in 20 patients (mean number of CTCs before the operation was 0.6 ± 1.6 vs 3.2 ± 2.3 after the operation, P < 0.001); 1 showed no change; in 47 cases, no CTCs were detected at any point. No CTCs were found in the control group.
The relationship between the presence of CTCs and clinicopathological characteristics was investigated; no significant correlation with the first detection was found (Table 2).
Detection status of CTCs before and after surgery, according to clinicopathological characteristics
| CTC1 | CTC2 | |||||
|---|---|---|---|---|---|---|
| Positive n (%) | Negative n (%) | P-value | Positive n (%) | Negative n (%) | P-value | |
| Age (years) | ||||||
| <70 | 20 (33.3) | 40 (66.7) | 0.16 | 20 (33.3) | 40 (66.7) | 0.12 |
| ≥70 | 20 (47.6) | 22 (52.4) | 8 (19.0) | 34 (81.0) | ||
| Gender | ||||||
| Men | 38 (42.7) | 51 (57.3) | 0.073 | 24 (27.0) | 65 (73.0) | 0.75 |
| Women | 2 (15.4) | 11 (84.6) | 4 (30.8) | 9 (69.2) | ||
| PET (SUVmax) | ||||||
| ≤9.4 | 18 (37.5) | 30 (62.5) | 0.77 | 5 (10.4) | 43 (89.6) | <0.001 |
| >9.4 | 20 (42.6) | 27 (57.4) | 21 (44.7) | 26 (55.3) | ||
| Mean ± SD | 11.6 ± 6.8 | 10.6 ± 4.9 | 0.44 | 14.1 ± 5.9 | 9.9 ± 5.2 | 0.001 |
| Histological characteristics | ||||||
| Adenocarcinoma | 14 (29.8) | 33 (70.2) | 0.1 | 12 (25.5) | 35 (74.5) | 0.82 |
| Other | 26 (47.3) | 29 (52.7) | 16 (29.1) | 39 (70.9) | ||
| p TNM stage | ||||||
| I | 21 (43.8) | 27 (56.3) | 0.42 | 8 (16.7) | 40 (83.3) | 0.027 |
| II-III | 19 (35.2) | 35 (64.8) | 20 (37) | 34 (63) | ||
| Tumour size (cm) | ||||||
| ≤3 | 16 (36.4) | 28 (63.6) | 0.68 | 10 (22.7) | 34 (77.3) | 0.38 |
| >3 | 24 (41.4) | 34 (58.6) | 18 (31.0) | 40 (69.0) | ||
| Mean ± SD | 3.9 ± 1.9 | 3.9 ± 2.2 | 0.93 | 4.4 ± 2.3 | 3.8 ± 2.0 | 0.17 |
| Nodal status | ||||||
| N0 | 30 (40) | 45 (60) | 0.82 | 20 (26.7) | 55 (73.3) | 0.8 |
| N1–N2 | 10 (37) | 17 (63) | 8 (29.6) | 19 (70.4) | ||
| Surgical approach | ||||||
| VATS | 18 (41.9) | 25 (58.1) | 0.69 | 7 (16.3) | 36 (83.7) | 0.043 |
| Thoracotomy | 22 (37.3) | 37 (62.7) | 21 (35.6) | 38 (64.4) | ||
| Type of resection | ||||||
| Other | 35 (41.7) | 49 (58.3) | 0.3 | 25 (29.8) | 59 (70.2) | 0.38 |
| Pneumonectomy | 5 (27.8) | 13 (72.2) | 3 (16.7) | 15 (83.3) | ||
PET (n = 95).
CTC1: circulating tumour cells status before surgery; CTC2: circulating tumour cells status 1 month after surgery; PET: positron emission tomography; SUVmax: standardized uptake value; SD: standard deviation; TNM: tumour, node, metastasis; N: node; VATS: video-assisted thoracic surgery.
Nevertheless, the presence of CTCs 1 month after the operation was significantly correlated with FDG PET/CT uptake. According to a receiver-operating characteristic curve analysis, the SUV cut-off point was set at 9.4 (sensitivity: 80.8%, specificity: 62.3%; Supplementary Material, Fig. S2). A total of 44.7% of patients with a high SUVmax had CTC2 compared with 10.4% for patients with lower uptake. Moreover, the SUVmax mean value was significantly higher in CTC2-positive patients (14 ± 5.9 vs 10 ± 5.2 for CTC2-negative patients).
The presence of CTC2 was also correlated with pathological stage; we observed a detection rate of 37% for Stages II–III compared with 16.7% for Stage I. Finally, with the surgical approach, the prevalence of CTCs was higher after thoracotomy (35.6%) than after the video-assisted thoracic surgery approach (16.3%).
In the multivariate logistic regression analysis, only the SUVmax value on the PET scan was associated with the presence of CTCs after the operation [odds ratio (OR): 1.13; 95% confidence interval (CI) 1.03–1.23; P = 0.011] (Supplementary Material, Table S1).
A total of 36 (35.3%) patients developed recurrence during the follow-up period (median follow-up: 19 months, range: 3–34). First sites of failure were local only in 10 cases; local and distant in 6; and distant in only 10.
For the entire cohort, the 1-year RFS rate was 71.5%. A possible influence of CTC detection on RFS was investigated: the presence of CTCs before the operation did not correlate with recurrence. However, the presence of CTCs after the operation was significantly associated with a shorter RFS (1-year RFS rate of 52.1% for CTC2-positive patients compared with 79.1% for CTC2-negative patients after the operation, log-rank test P = 0.005; Fig. 3).
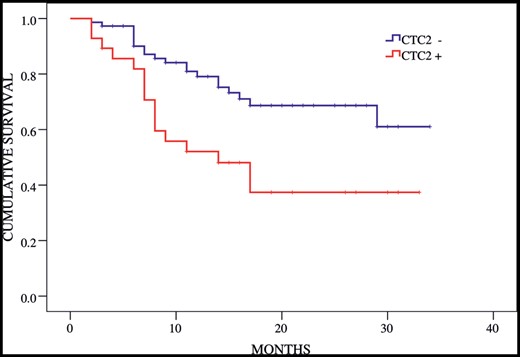
Recurrence free survival according to circulating tumour cell (CTC) status postoperatively (CTC2). Log-rank test P = 0.005.
In univariate Cox’s regression analysis along with the presence of CTC2, pathological Stages II and III showed more frequent disease progression than Stage I. Nodal status N1–N2 and tumour size also had a significant effect on RFS. According to multivariate analysis, both pathological stage and the presence of CTC2 were significantly independent prognostic factors for RFS (Table 3).
Univariate and multivariate Cox proportional hazards regression analysis for recurrence free survival
| Univariate | Multivariate | |||||
|---|---|---|---|---|---|---|
| HR | 95% CI | P-value | HR | 95% CI | P-value | |
| Age (years) | ||||||
| <70 | 1.33 | 0.67–2.62 | 0.42 | |||
| ≥70 | ||||||
| Gender | ||||||
| Women | 1.20 | 0.47–3.1 | 0.7 | |||
| Men | ||||||
| PET (SUVmax) | ||||||
| ≤9.4 | 0.35 | |||||
| >9.4 | 1.38 | 0.7–2.72 | ||||
| Histological classification | ||||||
| Adenocarcinoma | 0.98 | |||||
| Other | 0.99 | 0.52–1.91 | ||||
| p TNM stage | ||||||
| I | ||||||
| II | 2.31 | 1.02–5.2 | 0.044 | 2.44 | 1.04–6.01 | 0.041 |
| III | 4.94 | 2.11–11.57 | <0.001 | 3.63 | 1.38–9.59 | 0.004 |
| Tumour size (cm) | 1.27 | 1.10–1.46 | 0.001 | |||
| N status | ||||||
| N0 | 0.002 | |||||
| N1–N2 | 2.94 | 1.51–5.75 | ||||
| Surgical approach | ||||||
| VATS | 0.69 | 0.35–1.39 | 0.3 | |||
| Thoractomy | ||||||
| Type of resection | ||||||
| Other | 0.12 | |||||
| Pneumonectomy | 1.86 | 0.87–3.96 | ||||
| Adjuvant chemotherapy | ||||||
| Yes | 1.62 | 0.84–3.11 | 0.15 | |||
| No | ||||||
| Adjuvant radiotherapy | ||||||
| Yes | 2.40 | 0.85–7.05 | 0.087 | |||
| No | ||||||
| CTC1 | ||||||
| + | 0.98 | 0.50–1.91 | 0.953 | |||
| − | ||||||
| CTC2 | ||||||
| + | 2.45 | 1.27–4.72 | 0.008 | 2.75 | 1.33–5.89 | 0.011 |
| − | ||||||
HR: hazard ratio; CI: confidence interval; PET: positron emission tomography; SUVmax: standardized uptake value; TNM: tumour, node, metastasis; N: node; VATS: video-assisted thoracic surgery; CTC1: circulating tumour cell status before surgery; CTC2: circulating tumour cell status 1 month after surgery.
In this study, the presence of at least one CTC after the operation was correlated with prognosis independently of the number of cells detected. The CTC2 count as a continuous variable was not significantly correlated with prognosis [hazard ratio (HR) 1.1; 95% CI 0.99–1.31; P = 0.066].
Finally, we investigated the influence of the detection of CTCs only in Stage I patients. A subgroup analysis was performed including 48 patients in Stage I: According to Cox’s regression analysis for RFS, the presence of CTC2 was the only significantly correlated variable (HR 3.9; 95% CI 1.1–14.1; P = 0.036; Supplementary Material, Table S2).
DISCUSSION
To our knowledge, this study is the first to report a significant association between the detection of CTCs and tumour FDG PET/CT uptake in the early stages of NSCLC. We performed CTC analysis on Stage I-III NSCLC patients who underwent radical resection. Patients with higher FDG uptake were more likely to be positive for CTCs after the operation (OR: 1.13; 95% CI 1.03–1.23; P = 0.011).
Only a few studies have assessed the association between CTCs and FDG uptake in epithelial tumours. The first studies, performed on patients with metastatic breast cancer, described an association between extensive bone metastases detected by PET/CT and an increased number of CTCs [14]. In patients with advanced NSCLC, Punnoose et al. [15] examined the change in CTC levels in response to treatment and found a correlation between a decrease in the CTC count and a radiographic response using either FDG-PET or the Response Evaluation Criteria in Solid Tumors. Finally, Nair et al. [16], in a multicentre study of 71 patients with all stages of NSCLC, explored a possible correlation between CTCs detected by a non-epithelial cell adhesion molecule-based technique and FDG uptake. They were unable to find a significant association with CTCs detected before treatment.
We also did not find a correlation with the first detection before surgery, but we did so in the second determination performed 1 month after the operation. This second determination also correlated with other clinicopathological characteristics, including pathological stage and surgical approach. But only FDG-PET uptake by the tumour was independently associated with the presence of CTCs after the operation in the multivariate analysis. Interestingly the presence of CTCs in this second detection was also significantly correlated with prognosis.
Previous clinical studies have reported the prognostic value of CTC detection in different epithelial tumours [13, 17]. In a recent meta-analysis of the prognostic significance of CTCs in patients with NSCLC, the detection of CTCs was significantly associated with shorter overall survival and progression-free survival [18]. It has been proposed that, in advanced stages of the disease, the numbers of CTCs are correlated with prognosis and response to treatment [19]. In the early stages, a few studies have suggested that CTC detection can also help to predict prognosis. Hofman et al. [20] showed that an elevated CTC count preoperatively in patients with resectable NSCLC was an indicator of a poorer prognosis, associated with reduced disease-free and overall survival.
In our previous study, which included 56 patients, the detection of CTCs after surgery was correlated with early relapse and a shorter disease-free survival [12]. These results are confirmed in the present study. With a median follow-up of 19 months, patients with CTCs after the operation were more likely to develop an early recurrence (HR 2.8; 95% CI 1.3–5.9; P = 0.011).
In some previous reports, CTCs were detected during or immediately after surgical resection, some in samples from the pulmonary vein. In those reports, the prevalence of CTCs was higher in the pulmonary vein than in the peripheral samples; several investigators described an increase in the CTC count right after resection [21]. The possible involvement of the cells detected immediately after the operation in subsequent disease progression remains unknown, and no prognostic significance has been reported thus far.
The impact of the sequence of pulmonary vessel ligation on prognosis and release of CTCs has also been investigated. Some studies suggest that the pulmonary vein might be ligated first to reduce the rate of haematogeneous cancer cell dissemination [22]. However, other research studies showed conflicting results, and, based on long-term studies, there is no evidence to suggest that the sequence of vessel ligation has an influence on oncological outcomes or survival [23].
It is known that a large number of cells can be shed into the bloodstream during the operation, but a number of them are apoptotic and many are eliminated by the immune system. Accordingly, in animal models, only 0.1% of tumour cells remain viable 24 h after intravenous administration. Therefore, it is possible that a CTC count taken immediately after the operation could be overestimated.
In this study, CTCs were detected in the peripheral blood and the second determination was perfomed at least 3 weeks after the operation. For a biomarker to be useful in the clinical setting, it should be easily evaluated in a non-invasive way. The detection of CTCs in peripheral blood meets these requirements; in addition, the test can be repeated during the follow-up period, thereby offering the opportunity for real-time monitoring that could guide treatment decisions and target therapies.
We also highlight the importance of detecting the CTCs more than once, before and after the operation at least, to observe dynamic changes and mainly because post-surgical detection seems to be better correlated with prognosis. In a study by Yoon et al. [24] of 79 surgically resected patients with NSCLC, CTCs detected postoperatively were associated with disease progression.
In our study, we performed the second detection at least 3 weeks after the operation to avoid the influence of surgical manipulation on CTC levels. As we described previously, we found a significant correlation with a shorter RFS.
These results suggest that testing for the presence of CTCs might help to identify patients with a higher risk of relapse after complete resection. The presence of CTCs 1 month after the operation might be correlated with the presence of residual disease, representing a factor to consider when planning adjuvant treatment. It would be especially important in the Stage I group, where we also found an association between postoperative CTCs and a worse prognosis.
In this study, the presence of CTCs was associated with recurrence independently of the pattern of failure. Despite CTCs having been traditionally correlated with distant failure, recent theories suggest that their presence could also be related to local recurrence. It has been recently highlighted that CTCs can recolonize the primary tumour site from which they were initially detached by a phenomenon called ‘tumour self-seeding’ [7].
Limitations
This study has clear limitations, including the small sample size and the limited observation time. A longer follow-up period would be necessary to evaluate the influence of CTC detection on overall survival.
Another important limitation to acknowledge is the method used for CTC detection. A number of techniques have been described for CTC isolation, some of them based on physical properties and others, the most commonly employed, on specific biological features such as the expression of tumour cell markers. In this study, CTC determination was based on the expression of epithelial markers by the tumour cells, which might imply an underestimation of the real CTC count.
Recent investigations suggest that during metastasis, some tumour cells may undergo a phenotypical change, losing some epithelial features and adopting a more mesenchymal phenotype that facilitates vascular invasion and their transition into the bloodstream [7]. This change, epithelial mesenchymal transition, is characterized by a complete or partial loss of epithelial markers and an increase or gain of some mesenchymal markers. It is not thought to be an all or nothing process, and many CTCs express both epithelial and mesenchymal markers. It is likely that these subpopulations with more mesenchymal properties are not properly detected by current methods and that the real CTC count might therefore be underestimated. Hence, in future studies, a panel of markers including mesenchymal markers such as vimentin or slug will be used to detect different subpopulations of CTCs.
Low numbers of cells have been detected in this study. Because the CTC count is usually lower in the early stages than in the advanced stages, the detection of CTCs is particularly challenging. In a study by Hashimoto of patients with Stage I to Stage IV NSCLC who had an operation, only 1 cell was detected in the peripheral blood of 2 of the 30 patients using the CellSearch Circulating Tumor Cell Kit [21]. Considering the high specificity of the technique used by our group and our goal of avoiding false negatives, we considered patients in whom we detected at least one CTC to be CTC-positive.
CONCLUSION
In conclusion, this study shows a correlation between the postoperative presence of CTCs and the uptake of FDG by the primary tumour on a PET/CT scan. Both techniques provide valuable information about the biological characteristics of early stage NSCLC not evaluated by the tumour stage. In addition, the presence of CTCs after the operation was associated with early recurrence and a shorter period of recurrence-free survival, suggesting the possible utility of the detection of CTCs as a marker of a higher risk of relapse in patients with early stage NSCLC. Further research including multicentre studies is now warranted to validate the clinical utility of the detection of CTCs in patients with resected NSCLC.
SUPPLEMENTARY MATERIAL
Supplementary material is available at EJCTS online.
Funding
This work was supported by the Department of Health and Social Welfare of the Regional Government of Andalusia [PI-0294-2012] and by a predoctoral research contract of the University of Granada (Spain).
Conflict of interest: none declared.
REFERENCES
APPENDIX. CONFERENCE DISCUSSION
Dr P. Filosso(Torino, Italy): Did you find any correlation between the presence of CTC in the blood of the patient and the possible induction therapy? I mean, for example, if you found CTC in the bloodstream, did you undertake any kind of adjuvant treatment for such a patient because they were observed to be at high risk of relapse or recurrence?
Dr Bayarri-Lara: Concerning the first question, we excluded patients with induction therapy to try to get a homogeneous population. Regarding adjuvant therapy, yes, of course, one of the objectives of this study is to find another more specific indication for adjuvant therapy, but probably clinical trials are needed to indicate adjuvant therapy with CTC. It is too soon to indicate adjuvant therapy according to CTC presence.
Dr Filosso: And did you find a particular kind of histological tumour subgroup in which CTC may be present after the intervention?
Dr Bayarri-Lara: In the univariate analysis between CTCs and different histological characteristics, we didn't find a correlation in this study. We found a correlation with pathological stages, with surgical approach, and with PET scan. Only PET scan was found to be an independent prognostic factor for CTC presence after surgery.
Dr A. Turna(Istanbul, Turkey): Which antigens did you use for the characterization of CTCs and what was the false positive rate for these antigens? Did you characterize the normal cells such as epithelial cells or lymphocytic cells?
Dr Bayarri-Lara: It is a very good question. Our method in this study is based on the expression of epithelial markers, and we are using antibodies against cytokeratin cells. So strictly speaking we are detecting circulating epithelial cells, it is true. Obviously we are not detecting some cells because it is known that actually CTCs are a heterogeneous population, there are different populations, and maybe we are losing a part of these cells using just epithelial markers.
Currently we are performing a larger determination of CTCs using mesenchymal markers to detect subsets that suffer a phenotypical change that consisted of losing some epithelial markers and gain in mesenchymal markers that is named epithelial mesenchymal transition. So, yes, it is true, we could have false negatives but, even so, we have found a specific correlation with prognosis.
Dr F. Detterbeck(New Haven, CT, USA): I wasn't clear. Did some of your patients get adjuvant therapy?
Dr Bayarri-Lara: Yes, that is true.
Dr Detterbeck: So then your study doesn't work as a potential selection for adjuvant therapy, because you showed that patients have poor prognosis despite getting adjuvant therapy.
Dr Bayarri-Lara: Yes, I know. Thank you for your comment. Actually both determinations are made before adjuvant therapy. It was one of the variables that we analysed, and actually adjuvant chemotherapy didn't show a correlation with better survival. It wasn't a factor correlated with outcomes. Actually, our population is just I to IIIa stages, and I don't remember exactly the number, but adjuvant therapy was performed maybe in 20 patients, no more. So we are not looking yet for the effect of adjuvant therapy.
Dr L. Dominioni(Varese, Italy): Did I understand it correctly that the relevant proportion of your patients, Stage I, had circulating tumour cells both preoperatively and one month after? What was that percentage, I could not remember that, proportion of patients, Stage I, CDC positive.
Dr Bayarri-Lara: Yes, we are including Stage I, II and Stage III.
Dr Dominioni: And what was the proportion?
Dr Bayarri-Lara: Forty per cent before surgery; 27.5% one month later.
Dr Dominioni: That questions whether we should operate at all, because we delete, take away the tumour, but we have a high proportion of patients still with circulating tumour cells present. What is the meaning of that?
Dr Bayarri-Lara: This is the question. We have a high number of recurrences. That is the problem, yes.
Dr W. Fang(Shanghai, China): I would ask the question in a different way. Since you want to look for a predictive factor for recurrence and therefore potentially for directing future management, what is the purpose of involving so many advanced stage tumours? I would just focus on Stage I diseases and see the results. So for Stage I patients only, do you expect to have the same result as your study population?
Dr Bayarri-Lara: I’m sorry, I’m afraid I didn’t understand the last part of the question.
Dr Fang: If you only looked at the Stage I patients, do you expect to have similar results?
Dr Bayarri-Lara: I hope not. I hope the recurrence rate would be lower, of course. But we have to take into account that the objective of our study is to see the results with resected patients. We have tried a homogeneous population, but all resected patients are included. So, still, I think the results are acceptable.
Dr Fang: My advice would be you look only at Stage I patients and go into details like comparing different histological subtypes to see if there is any difference.
Dr Bayarri-Lara: Thank you for your comment.
Dr D. Bethune(Halifax, NS, Canada): We have tried working to find CTCs in non-small-cell lung cancer and it is excruciatingly difficult, and I am just wondering whether these represent cancer cells or just epithelial cells. The breast cancer CTC studies show a baseline of around five CTCs that are present, and they don’t feel that is significant. They get numbers around 50, I believe, if I remember correctly. I don’t know what the problem is with lung cancer, whether they form clumps or whether they have EMT, mesenchymal transformation.
You had mentioned that you were using technologies that detected mesenchymal transformed cells. My only caution overall is that one has to be careful in reading too much significance into this because of the concerns that these may not be cancer cells and that we may be seeing something else here. But a comment on mesenchymal cell detection?
Dr Bayarri-Lara: About the first comment, yes, currently we are performing a more complete method for detection of mesenchymal markers, including vimentin and SLUG markers, with immunocytochemical assays. And, of course, I have mentioned that we can have false negatives with our technique. In this study we only used epithelial markers, so, it is true, we can have a lower sensitivity than if we had used mesenchymal markers as well. But as I said earlier we found a correlation. Probably with a more complete characterization we could have found more interesting results, but I think we are on the way.
Author notes
†Presented at the 24th European Conference on General Thoracic Surgery, Naples, Italy, 29 May–1 June 2016.
