


Abstract
Persistent left ventricular (LV) hypertrophy after surgery is frequent, but its clinical relevance is controversial. We evaluated if residual LV hypertrophy (LVH) is associated with clinical outcomes after aortic valve replacement (AVR) for severe aortic stenosis (AS).
We analysed clinical and echocardiographic parameters before and after AVR, in a prospective cohort of 132 patients with severe AS. The mean follow-up was 6.0 ± 1.5 years. Clinical endpoints were all-cause death and combination of as in all-cause death and non-fatal cardiovascular hospitalization. At AVR, myocardial biopsies for collagen volume fraction (CVF) evaluation were done in 56 random patients.
Residual LVH was present in 44% of patients after AVR. Patients with residual LVH were older, more frequently women and had hypertension (HT). Preoperatively, they had higher LV mass indices (LVMI), higher E/e′ and left atrial volume indices, as well as lower peak systolic annular velocity. Female gender, HT, LVMI and E/e′ were independent predictors of persistent LVH. CVF at the time of surgery was higher in those with residual LVH (20.0 ± 14.6 vs 13.2 ± 11.5%, P = 0.027). The risk of all-cause death and non-fatal cardiovascular hospitalization was higher in patients with residual LVH [OR 2.89 (95% CI 1.12–7.44); P = 0.035], but there were no differences in all-cause mortality. Residual LVH was associated with a worse outcome in women but not in men.
Residual LVH after AVR is common and is associated with worse prognosis, particularly in women. In addition, HT, higher baseline LVM and worse diastolic dysfunction can help to identify patients at risk for incomplete normalization of LVM.
INTRODUCTION
In chronic pressure overload, left ventricular hypertrophy (LVH) is an adaptive mechanism that contributes to normalization of systolic wall stress [1, 2]. In aortic stenosis (AS) patients, severe LVH is related with worse LV function and higher early and late mortality, even after successful aortic valve replacement (AVR) [3, 4]. Likewise, incomplete regression of LVH, commonly observed in these patients [5, 6], may be a marker of irreversible remodelling and, as such, of worse prognosis.
Our aim was to evaluate the prognostic impact of residual LVH late after surgery and identify baseline independent predictors of its occurrence.
METHODS
Patient selection and follow-up
Between January 2006 and December 2009, we included 141 consecutive patients over 18 years old with severe symptomatic AS (aortic valve area <1 cm2 or mean transaortic gradient ≥40 mmHg) referred for AVR at the Cardiothoracic Surgery Department of Centro Hospitalar São João, Porto, Portugal. We excluded patients with aortic regurgitation >II/IV or other significant valve diseases (>mild), significant coronary artery disease (CAD; lesions >50% on coronary angiography) or previous cardiac surgery. All patients were in sinus rhythm at the time of inclusion. From the initial 141 patients, 132 were considered for this prospective analysis: one was refused for surgery, other died before surgery from non-cardiovascular reason (cholangitis with sepsis), and 7 presented incomplete clinical data. All patients had clinical follow-up upto 8.2 years and echocardiographic follow-up was achieved in 123 (93.2%) patients. There were 2 perioperative deaths (1 fatal stroke and 1 due to sepsis) and 3 sudden deaths in the first 30 days after surgery. These patients had no echocardiographic evaluation after AVR. Four additional patients refused coming to our hospital for echocardiographic evaluation, 3 of them were alive at the end of follow-up but 1 had died 4 months after surgery from non-cardiovascular cause. The mean follow-up was 6.0 ± 1.5 years for clinical outcomes, and final echocardiographic evaluation was performed 5.0 ± 2.2 years after surgery.
Clinical endpoints were defined as all-cause death and a combination of all-cause death and non-fatal cardiovascular hospitalization [heart failure, myocardial infarction, reoperation for prosthesis dysfunction, new-onset atrial fibrillation or advanced atrioventricular (AV) block requiring hospitalization].
Surgical technique
All surgeries were performed using the standard procedure for AVR. The patients were placed on cardiopulmonary bypass, and cardiac arrest was induced and maintained with cold blood cardioplegia. The majority of patients received a bioprosthesis (73.3%). Two patients also had ascending aortic aneurysm and underwent aortic root replacement with valved composite grafts (Bentall technique). At the time of surgery, 56 random patients underwent myocardial biopsy from the LV interventricular septum.
Echocardiographic studies
Echocardiographic examination was performed by a trained cardiologist and recorded on digital support. All recordings were examined by an experienced echocardiographer, in an accredited independent echocardiography laboratory (Hospital Clínico San Carlos, Madrid, Spain), blinded to patient details. Studies were performed using a Philips IE-33 equipment with an S5-1 transducer and M-mode, two-dimensional, pulsed, continuous, colour-flow and tissue Doppler capabilities. Correct orientation of imaging planes, and cardiac chamber dimension and function measurements were performed according to the European Association of Echocardiography (EAE)/American Society of Echocardiography (ASE) recommendations [7].
LV mass was estimated according to the joint recommendations of the ASE and EAE using Devereux's formula for ASE measurements in diastole: LV mass = 0.8 × (1.04 × ([LV internal dimension + posterior wall thickness + interventricular septal thickness]3 − [LV internal dimension]3) + 0.6 g. LVH was defined by LV mass index greater than 115 g/m2 in men and greater than 95 g/m2 in women.
Relative wall thickness (RWT) was calculated for the assessment of LV geometry using the formula: 2 × posterior wall thickness/LV diastolic diameter. Increased RWT was present when this ratio was greater than 0.42. Left atrial (LA) volume was measured at LV end-systole in the frame preceding mitral valve opening. The volume was measured using the biplane area length method and corrected for body surface area. Aortic valve area was estimated using quantitative Doppler by the continuity equation.
Mitral inflow was assessed in the apical four-chamber view using pulsed-wave Doppler with the sample volume placed at the tips of mitral leaflets during diastole. From the mitral inflow profile, the peak flow velocity of early filling (E-wave), peak flow velocity of atrial contraction (A-wave), the E/A ratio and early filling deceleration time were measured. Doppler tissue imaging of the mitral annulus was obtained from the apical four-chamber using a sample volume placed in the septal mitral valve annulus. Peak systolic annular velocity (Sm) and early diastolic septal velocity (e′) were determined, and the E/e′ ratio was derived.
As a measure of global LV load, we calculated the valvulo-arterial impedance: Zva = SAP + MG)/SVI, where SAP is the systolic arterial pressure, MG is the mean transvalvular pressure gradient and SVI is the stroke volume index.
Histological determination of fibrosis
Light microscopic quantification of fibrosis has previously been described and validated. Fibrosis analysis of myocardial biopsies was performed using picrosirius-red staining in 4-μm-thick sections of tissue. Images of these sections were acquired with a projection microscope (×50). Subsequent image analysis with Slidebook 4.0 software (3I, Denver, CO, USA) was performed to determine the extent of reactive interstitial fibrosis, which was expressed as the collagen volume fraction (CVF, %). Areas of reparative and perivascular fibrosis were excluded. Myocardial fibrosis was calculated by the sum of all connective tissue areas divided by the sum of connective tissue and muscle areas averaged over 4–6 representative fields of the section of 56 random AS patients (18 males and 38 females). In our laboratory, normal values of fibrosis for LV myocardial biopsy materials are 5.4 ± 2.2% [8].
Statistical analysis
Categorical variables were expressed as percentages and continuous variables as mean ± standard deviation, unless otherwise specified. Continuous variables were compared between groups using an unpaired t-test (for normally distributed variables) or the Mann–Whitney U-test (for non-normally distributed variables). For comparison between baseline and follow-up, a paired Student's t-test was applied or a Wilcoxon test (for non-normally distributed variables). Chi-square test (or Fisher's exact test) was used to compare categorical variables. Spearman's rank correlation was used for the assessment of correlations between LVM index and its variation and clinical, echocardiographic and molecular continuous variables. Uni- and multivariable binary logistic regression models (Wald backward stepwise method, P = 0.05 for covariate inclusion and P = 0.20 for exclusion) were used for predicting residual LVH and the outcome of all-cause death and cardiovascular hospitalization. The Kaplan–Meier and Cox models were used to evaluate survival times after surgery for both all-cause death and for all-cause death and cardiovascular hospitalization, and the log-rank test was used to compare survival curves. All reported probability values are two-tailed, and a value of P < 0.05 was considered statistically significant. Analyses were performed with the IBM® SPSS® Statistics software package (version 21.0; SPSS, Inc., Chicago, IL, USA).
RESULTS
The study group included 132 patients with a mean age of 66 ± 12 years, 58% were women and 81% had LVH before surgery. Most patients had preserved ejection fraction (EF) with a mean value of 62 ± 10%. Detailed demographic, clinical and echocardiographic (before and after AVR) characterization can be found in Supplementary Tables 1 and Supplementary Data. There was no difference in the time from surgery to last echocardiographic evaluation in the subgroups with and without residual LVH (Table 1).
Patients’ clinical and echocardiographic characteristics according to the presence of residual left ventricular hypertrophy after surgery
| Normal LVM n = 69 (55.7%) | Residual LVH n = 54 (44.3%) | P-valuesa | |
|---|---|---|---|
| Echocardiographic follow-up time (months) | 70.1 ± 16.6 | 71.5 ± 14.7 | 0.63 |
| Age | 64.5 ± 12.5 | 69.2 ± 10.6 | 0.029 |
| Women | 30 (44.1%) | 39 (72.2%) | 0.002 |
| Hypertension | 32 (47.1%) | 38 (71.7%) | 0.006 |
| Diabetes mellitus | 12 (17.6%) | 13 (24.5%) | 0.35 |
| EuroSCORE II | 1.33 ± 0.78 | 2.13 ± 1.97 | 0.003 |
| GFR (ml/min) | 71.5 ± 16.6 | 65.9 ± 20.6 | 0.093 |
| LVEDVI (ml/m2) | 52.0 ± 15.5 | 53.5 ± 17.1 | 0.74 |
| LVESVI (ml/m2) | 20.0 ± 9.4 | 23.5 ± 14.6 | 0.35 |
| RWT | 0.48 ± 0.1 | 0.47 ± 0.11 | 0.73 |
| LVMI (g/m2) | 121.2 ± 27.3 | 143.5 ± 34.7 | <0.001 |
| ΔLVMI (g/m2) | −33.5 ± 28.7 | −10.3 ± 41.8 | 0.001 |
| LAVI (ml/m2) | 31.7 ± 10.9 | 40.8 ± 13.7 | <0.001 |
| Maximal aortic velocity (m/s) | 454.9 ± 55.3 | 466.1 ± 63.9 | 0.31 |
| Mean Ao gradient (mmHg) | 53.6 ± 14.4 | 54.8 ± 14.4 | 0.60 |
| EOAI (cm2/m2) | 0.42 ± 0.13 | 0.41 ± 0.11 | 0.51 |
| ΔEOAI (%) | 123.4 ± 88.1 | 119.8 ± 82.8 | 0.92 |
| Zva | 5.92 ± 1.56 | 6.91 ± 2.27 | 0.019 |
| SVI (ml/m2) | 32.3 ± 7.7 | 29.6 ± 8.2 | 0.11 |
| Sm (cm/s) | 231.8 ± 81.3 | 214.1 ± 59.4 | 0.001 |
| E/e′ | 14.5 ± 5.2 | 19.0 ± 7.4 | 0.002 |
| EF (%) | 63.1 ± 8.5 | 58.6 ± 12.3 | 0.030 |
| PPM | 33 (50.8%) | 27 (52.9%) | 0.82 |
| Severe PPM | 13 (19.1%) | 9 (16.7%) | 0.73 |
Continuous variables are presented as mean ± SD and categorical variables as n (%).
LVM: left ventricular mass; LVH: left ventricular hypertrophy; GFR: glomerular filtration rate (MDRD formula); LVEDVI: left ventricular end-diastolic volume index; LVESVI: left ventricular end-systolic volume index; RWT: relative wall thickness; LVMI: left ventricular mass index; ΔLVMI: baseline LVMI − final LVMI; LAVI: left atrial volume index; EOAI: effective orifice area index; ΔEOAI: (baseline EOAI − final EOAI)/baseline EOAI × 100; Zva: valvulo-arterial impedance; SVI: stoke volume index; Sm: peak systolic annular velocity; EF: ejection fraction; PPM: patient–prosthesis mismatch.
aMann–Whitney test, except for age and EF where the Student's t-test was used; proportions compared using the Chi-square test.
The values in bold indicate statistical significance.
A bioprosthesis was implanted in 73% of patients and in all cases where a mechanical valve was chosen, it was bileaflet. The valve size was >21 mm in 42% of cases (size 19 mm: 14; size 20 mm: 1; size 21 mm: 61; size 23 mm: 37; size 25 mm: 19). There were 2 perioperative deaths (1.5%), and the median time of hospitalization was 6 days. Non-fatal post-surgery complications were atrial fibrillation in 30 (22.7%) patients, perioperative renal failure in 24 patients (defined as a fall in glomerular filtration rate (GFR) of >25% from baseline, 18.2%), pacemaker implantation due to AV block in 9 (6.8%) patients, bleeding needing reoperation in 2 (1.5%) patients , stroke in 2 (1.5%) patients and respiratory infection in 2 (1.5%) patients. No patient needed inotropic support beyond 24 h.
A final echocardiographic evaluation was performed 5.0 ± 2.2 years after surgery in 123 patients. After AVR, we observed significant improvement in transprosthetic gradients, in effective orifice area index and a significant reduction in the left ventricular mass index (LVMI; Supplementary Table 2), but 54 (44%) patients still had LVH.
Residual left ventricular hypertrophy after aortic valve replacement
Patients with residual LVH after AVR were older (69.2 ± 10.6 vs 64.5 ± 12.5 years, P = 0.036), more frequently women (72.2 vs 27.8%; P = 0.002) and hypertensive (71.7 vs 28.3%; P = 0.006), and had higher surgical risk and tended to have a lower GFR (Table 1).
When analysing baseline echocardiographic parameters, patients with residual LVH had higher baseline LVMI and Zva, but no differences in the mean gradient or the indexed aortic valve area. Moreover, these patients had worse diastolic function with higher values of E/e′ and indexed LA volume, as well as worse LV systolic function, given the lower Sm and lower EF (Table 1). Patients with residual LVH had less relative mass regression after surgery, with a median decrease of 8.3% (P25–75: 21.9–6.5%) vs 25.7% (P25–75: 41.3–13.9%) in those with normalization of LV mass (P < 0.001). The frequency of patient–prosthesis mismatch (PPM), defined as an indexed effective orifice area of ≤0.85 cm2, was not different in patients with and without residual LVH (52.9 vs 50.8%; P = 0.82).
In a multivariate Cox regression model (Table 2), including age, gender, hypertension (HT), EuroSCORE II value, baseline GFR, baseline LVMI, Zva, Sm, EF and E/e′ (Table 2), the independent predictors of residual LVH were female gender, history of HT, higher baseline LVMI and higher LV filling pressures evaluated by E/e′. Lower values of Sm also showed a trend to predict residual LVH.
Uni- and multivariate Cox regression analyses for prediction of residual left ventricular hypertrophy
| Univariate analysis | Multivariate analysis | |||
|---|---|---|---|---|
| OR (95% CI) | P-values | OR (95% CI) | P-values | |
| Gender (female) | 3.293 (1.534–7.070) | 0.002 | 3.797 (1.047–13.771) | 0.042 |
| Age (10-year increment) | 1.439 (1.031–2.010) | 0.033 | ||
| HT (yes) | 2.850 (1.327–6.119) | 0.007 | 4.160 (1.255–13.792) | 0.020 |
| EuroSCORE II | 1.768 (1.179–2.650) | 0.006 | ||
| GFR (MDRD) | 0.984 (0.964–1.004) | 0.112 | ||
| LVMI (10-unit increment) | 1.272 (1.113–1.454) | <0.001 | 1.350 (1.067–1.708) | 0.010 |
| Zva | 1.332 (1.055–1.682) | 0.016 | ||
| EF | 0.958 (0.922–0.996) | 0.030 | ||
| E/e′ (1-unit increment) | 1.123 (1.049–1.201) | 0.001 | 1.117 (1.024–1.219) | 0.013 |
| Sm (1-unit decrease) | 1.969 (1.311–2.957) | 0.001 | 1.653 (0.990–2.755) | 0.055 |
| CVF ≥15.4% | 5.2 (1.475–18.332) | 0.010 | 7.076 (1.406–35.604) | 0.018 |
HT: hypertension; GFR: glomerular filtration rate (MDRD formula); LVMI: left ventricular mass index; Zva: valvulo-arterial impedance; EF: ejection fraction; Sm: peak systolic annular velocity; CVF: collagen volume fraction; OR: odds ratio; 95% CI: 95% confidence interval for the odds ratio.
The values in bold indicate statistical significance.
Fibrosis and residual hypertrophy after surgery
Fifty-six random patients underwent myocardial biopsy at the time of surgery for fibrosis determination. There were no clinical differences between these patients and the overall group (Supplementary Table 3).
Among the patients who had a determination of CVF, those with residual LVH had a significantly higher level of CVF (20.0 ± 14.6 vs 13.2 ± 11.5%, P = 0.027; Fig. 1).
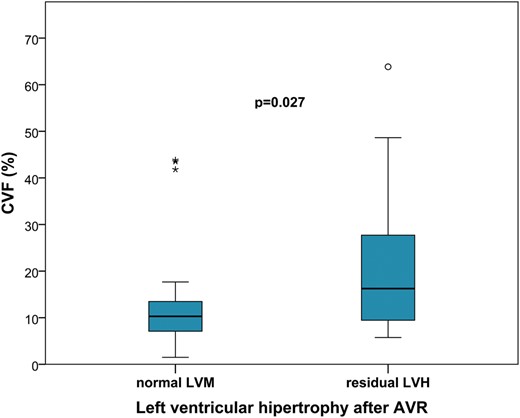
Levels of collagen volume fraction (CVF) according to the existence of residual left ventricular hypertrophy (LVH) after surgery. AVR: aortic valve replacement; LVM: left ventricular mass.
Clinical outcomes
After 6.0 ± 1.5 years of follow-up, 17 (12.9%) patients had died and 12 had a non-fatal cardiovascular hospitalization (5 for heart failure, 3 reoperations for prosthesis dysfunction, 2 for symptomatic new-onset atrial fibrillation and 2 for advanced AV block requiring pacemaker implantation).
Patients with residual LVH after surgery had no differences in the risk of all-cause mortality (HR 1.88, 95% CI 0.56–6.28; P = 0.366), as well as no differences in the risk of cardiovascular death (HR 2.00, 95% CI 0.56–7.10; P = 0.283), but had a significantly higher risk of non-fatal cardiovascular hospitalization (HR 3.82, 95% CI 1.03–14.13, P = 0.045) and the combination of all-cause mortality and non-fatal cardiovascular hospitalization (HR 2.89, 95% CI 1.12–7.44; P = 0.035), when compared with those with normal LVM.
Event-free survival curves for each group are displayed in Figs 2 and 3. Patients with residual LVH after surgery had worse results for survival free of non-fatal cardiovascular hospitalization (83.3 vs 95.6%, P = 0.032) and the composite endpoint of all-cause mortality and non-fatal cardiovascular hospitalization, compared with those with normal LVM (60.0 vs 86.5%, P = 0.039). There was no significant difference for all-cause mortality between the groups (78.1 vs 90.6%, P = 0.289).
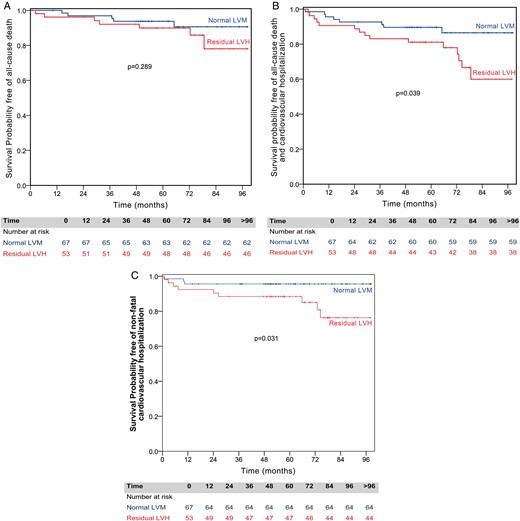
Kaplan–Meier survival curves for all-cause death, for all-cause death and cardiovascular hospitalization, and for non-fatal cardiovascular hospitalization, by the presence of residual left ventricular hypertrophy (LVH). (A) Patients with normal left ventricular mass (LVM) have similar survival free of all-cause death compared with the ones with residual LVH. (B) Patients with normal LVM have significantly better survival free of all-cause death and cardiovascular hospitalization compared with the ones with residual LVH. (C) Patients with normal LVM have significantly better survival free of non-fatal cardiovascular hospitalization compared with the ones with residual LVH.

Kaplan–Meier survival curves for cardiovascular death according to the presence of residual left ventricular hypertrophy (LVH). Patients with normal left ventricular mass (LVM) have similar survival free of cardiovascular death compared with the ones with residual LVH.
There was a difference in event-free survival in those with residual LVH, according to gender (Figs 4 and 5). Women with residual LVH have lower event-free survival for the combined endpoint (50.0 vs 93.2%, P = 0.019) and a trend for lower survival free of all-cause death (67.8 vs 96.4%, P = 0.059) and cardiovascular mortality (84.6 vs 96.7%, P = 0.086), when compared with women with normal final LVM. This result was not seen in men, as there was no significant difference in event-free survival, between those with and without residual LVH.
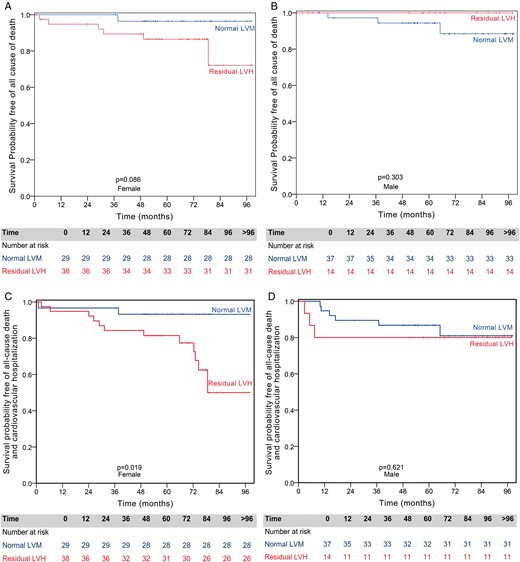
Gender-specific Kaplan–Meier survival curves for all-cause death or for all-cause death and cardiovascular hospitalization by the presence of residual left ventricular hypertrophy (LVH). (A) Females with normal left ventricular mass (LVM) have similar survival compared with females with residual LVH. (B) Males with normal LVM have similar survival compared with males with residual LVH. (C) Females with normal LVM have significantly better survival free of all-cause death and cardiovascular hospitalization compared with females with residual LVH. (D) Males with normal LVM have similar survival free of all-cause death and cardiovascular hospitalization compared with males with residual LVH.

Gender-specific Kaplan–Meier survival curves for cardiovascular death by the presence of residual left ventricular hypertrophy (LVH). Female patients showed a trend towards higher cardiovascular mortality if they had residual LVH (A), while cardiovascular mortality was not different in men with or without residual LVH (B).
DISCUSSION
We analysed a prospective cohort of patients with isolated severe AS who underwent AVR, with echocardiographic follow-up at 5 years and clinical follow-up at 6.0 ± 1.5 years. In our study, residual LVH was present in 44% of patients late after AVR and was associated with a worse prognosis, with nearly a 3-fold increase in the risk of death or non-fatal cardiovascular hospitalization. We also found that female gender, history of HT, higher baseline LVMI and higher baseline LV filling pressures were independent predictors of residual LVH. Moreover, in women, the persistence of LVH late after AVR was associated with a worse outcome. This was not seen in men, suggesting that the prognostic impact of residual LVH is gender-specific.
The association of residual LVH in AS with worse prognosis is controversial. Others have described this association including patients with other types of valve lesions and coexisting CAD, which may have influenced results. Indeed, the coexistence of CAD has been considered as an independent predictor of clinical outcomes after AVR [6], and the presence of aortic insufficiency can elicit a different remodelling response [9]. In our study, we excluded these patients.
The lack of normalization of LV mass after surgery occurs in nearly half of patients with AS, and it has been considered as a ‘natural’ consequence of the substitution of a native valve for a somewhat obstructive valve substitute with a residual gradient [10]. Thus, the focus has been on avoiding significant PPM and new prostheses have been developed with better haemodynamic profiles. In our study, PPM was frequent and occurred in nearly half of the patients, but only in ∼20% of them PPM was severe. However, in our study, residual LVH was not associated with PPM. Beach et al. [5] described that high postoperative transprosthesis gradients had only a minimal effect on residual LVH, in a study including a very large number of patients. Therefore, haemodynamic factors, such as the type of valve and residual gradients, are not the only determinants of incomplete regression. The worse long-term outcome of patients with residual LVH after AVR can be explained by the existence of more extensive preoperative disease and persistent diastolic and/or systolic dysfunction [11, 12].
One important finding in our study was the observed differences in the prognostic impact of residual LVH according to gender. Only in women, the absence of normalization of LVM was associated with worse survival free of non-fatal cardiovascular hospitalization and all-cause mortality. Recently, Petrov et al. [13] described that women with preoperative maladaptive LVH had worse survival than those with adaptive LVH, a pattern that was not seen in men. These results are in accordance with ours, showing a gender-specific prognosis of LVH determined before or after AVR. Thus, it seems that, in women, the search for early predictors of negative remodelling after AVR could be particularly relevant.
Predictors of residual left ventricular hypertrophy
Patients with a higher baseline LVMI and worse diastolic dysfunction (higher filling pressures evaluated by E/e′) had a higher probability of having residual LVH after surgery. Moreover, those with worse longitudinal systolic function (evaluated by Sm) were also less likely to have LV mass normalization late after surgery. Our results are in accordance with that of other authors, who also found that the existence of a more severe preoperative hypertrophy [5, 14–16] and the presence of early signs of myocardial dysfunction, even with preserved EF, may be a surrogate of a more advanced disease [17] and could help to explain the worse long-term outcome of patients with residual LVH.
Female gender and a history of HT were also independently associated with persistent LVH. In previous analyses, we have found that women had more interstitial fibrosis than men. They also had levels of biomarkers of extracellular matrix favouring collagen deposition, and these correlated negatively with LV mass regression (unpublished data, under review). Moreover, HT negatively impacts LV mass regression after surgery, and several authors have stressed the need for rigorous blood pressure control in these patients [18, 19]. Nevertheless, our group has shown previously that this impairment in reverse remodelling happens independently of load, and might be related to the neurohormonal milieu [20].
Myocardial fibrosis and residual left ventricular hypertrophy
At the histological level, we found that a higher amount of fibrous tissue at the time of surgery is an independent predictor of residual LVH, altogether suggesting the presence of irreversible remodelling. Our results are in accordance with earlier landmark studies that established the relationship between myocardial fibrosis, systolic and diastolic function, and incomplete LVM regression in aortic stenosis [21, 22]. More recently, the presence of severe fibrosis at the time of surgery has been associated with lesser functional improvement [23] and higher mortality after AVR [24], confirming its prognostic importance.
Based on results from previous studies [23, 25], the worse baseline longitudinal systolic function in our patients with residual LVH might reflect the existence of more advanced myocardial disease and higher levels of fibrosis, making its evaluation an important tool for risk-stratifying AS patients without class I recommendation for AVR.
LIMITATIONS
This was a single-centre observational study and the limited size of our cohort, although similar to those reported in the literature about this theme, reduces our statistical power. For fibrosis determination, we were unable to achieve myocardial biopsies for all patients. Still, these patients were randomly chosen and are believed to be representative of the overall study group.
CONCLUSION
Residual LVH late after AVR is associated with a worse prognosis, in particular in women. The presence of more severe myocardial disease, as suggested by higher LVM and worse LV diastolic and systolic function, can help to explain the poorer clinical outcome of these patients. Interstitial fibrosis could be the missing link in the pathophysiology of residual LVH. Our study is hypothesis-generating and brings to light the need for additional research to evaluate the impact of earlier surgery in specific subgroups of patients with a higher risk of residual LVH after surgery, such as women and those with HT.
SUPPLEMENTARY MATERIAL
Supplementary material is available at EJCTS online.
Funding
This work was supported by the Portuguese Foundation for Science and Technology (grants UID/IC/00051/2013 and EXCL/BIM-MEC/0055/2012, partially funded by FEDER through COMPETE) through the Cardiovascular Research Centre and by European Commission (grant FP7-Health-2010; MEDIA-261409). Alexandra Gonçalves receives funds from Portuguese Foundation for Science and Technology Grant HMSP-ICS/007/2012.
Conflict of interest: none declared.
REFERENCES
