


Abstract
In cardiac surgery, the association between red blood cell (RBC) transfusion and clinical outcome is elusive. We investigated in a large cohort of patients who underwent isolated coronary artery bypass grafting (CABG) the effect of transfusion of 1–2 units of leucocyte-depleted RBCs on mortality and multiorgan failure.
The investigation included all patients from July 2009 to June 2014 who underwent CABG at our institution and received no (n = 1478) or 1–2 units of RBCs (n = 1528). The primary end-point was 30-day mortality; secondary end-points were major organ dysfunction. A subgroup analysis assessed the effect of the duration of RBC storage on patient outcome. Statistical analysis was performed using propensity score (PS) adjustment.
The 30-day mortality rate was 0.3% in the RBC− group and 0.2% in the RBC+ group. Compared with the RBC− group, PS-adjusted odds ratio (OR) of 30-day mortality in the RBC+ group was 0.29 [95% confidence interval (CI): 0.06–1.50; P = 0.14]. PS-adjusted OR of a ‘prolonged intensive care unit (ICU) stay’ (>48 h) was significantly higher in the RBC+ group than in the RBC− group [OR 1.49 (95% CI: 1.14–1.95); P = 0.004], but major clinical complications such as low cardiac output syndrome, stroke, haemofiltration, wound infection and prolonged mechanical ventilator support (>24 h) did not differ significantly between groups. Duration of blood storage was not independently associated with clinical outcome.
Our data do not indicate a transfusion-related increase in mortality and multiorgan failure in patients undergoing isolated CABG.
INTRODUCTION
The impact of the transfusion of red blood cells (RBCs) on outcomes in patients undergoing cardiac surgery is the subject of intensive as well as versatile research with controversial results [1–7]. In two large retrospective studies, the transfusion of more than 4 units of RBCs was associated with an increase in severe infections [3, 6]. In a large prospective single-centre investigation, Karkouti et al. [4] showed an association between the transfusion of more than 5 units of RBCs and mortality. A subgroup analysis of patients of the ACUITY trial who underwent urgent coronary artery bypass grafting (CABG) after percutaneous coronary intervention showed that the postoperative transfusion of 4 or more units of RBCs was strongly associated with subsequent mortality [5]. However, recent randomized controlled trials could not demonstrate differences in clinical outcomes when comparing a liberal with a restrictive transfusion regimen [1, 2].
Besides the quantity of RBC transfusions, the quality of the product has also been associated with differences in mortality and morbidity. The transfusion of leucocyte-depleted (LD) RBCs has been associated with lower complication rates when compared with leucocyte-containing RBCs [8, 9]. Transfusion of RBCs stored for less than 14 days has been associated with favourable outcomes when compared with transfusion of ‘older’ RBCs [10–12]. However, in a recent prospective trial in predominantly non-surgical patients, these results could not be reproduced when only LD RBCs were transfused [13]. In line with these findings are results of the most recently published data in cardiac surgical patients. In this trial, the duration of LD red-cell storage was not associated with significant differences in the change in multiple organ dysfunction when an average 3–4 units of LD RBCs were transfused [14]. However, another recent large retrospective study from a registry of the patients in the state of Michigan, USA, associated the transfusion of 1–2 units of RBCs with an increase in multiorgan failure and mortality of patients undergoing isolated ‘on-pump’ CABG [15, 16].
To address both the aspects of transfusion quantity and quality, we aimed to evaluate whether even small amounts of LD RBCs adversely affect outcomes in patients undergoing isolated CABG. Moreover, we assessed whether the duration of RBC storage has an impact on clinical outcomes.
MATERIALS AND METHODS
Study design
This single-centre, retrospective cohort study is based on consecutive data obtained from patients undergoing isolated CABG at our institution between July 2009 and June 2014. Preoperative data were collected at hospital admission. Perioperative and postoperative data were collected prospectively. The study was performed in accordance with the STrengthening the Reporting of OBservational studies in Epidemiology (STROBE) statement for cohort studies (www.strobe-statement.org). The analysis was performed after approval of the local ethics committee of the Ruhr-University of Bochum, Bad Oeynhausen, Germany.
Surgery
In general, CABG was performed with (On-Pump) or without (OPCAB) cardiopulmonary bypass (CPB), mostly according to the individual preference of the surgeon. Dedicated ‘On-Pump surgeons’ nearly exclusively performed the CABG with CPB, while dedicated ‘OPCAB’ surgeons performed CABG in more than 90% of cases without CPB. When CPB was employed, the priming volume consisted of 1500 ml of Ringer Lactate solution, and the procedure was performed in normo- or mild hypothermia [17]. A cell saver was used in all ‘OPCAB’ procedures and in ‘On-Pump’ cases which had undergone sternotomy previously.
Transfusion protocol
For patients aged >70 years, the transfusion threshold was a haemoglobin (Hb) value of ≤9–10 g/dl [haematocrit (Htc) 27–30%]. For patients aged ≤70 years, the transfusion threshold was a Hb value of ≤8–9 g/dl (Htc 24–27%); higher thresholds within the groups applied to the patients needing inotropic support for the failing heart. In Germany, only LD RBCs are transfused.
Group assignment, data acquisition and clinical variables
For data analysis, patients were divided into two groups: Group 1 consisted of patients who did not receive RBC units (designated RBC− group; n = 1478). Group 2 consisted of patients who received 1 or 2 RBC units (designated RBC+ group; n = 1528). Clinical data were obtained from a database using the cardiac surgery acquisition program THGQIMS (Münster, Germany). Biochemical parameters were obtained from Lauris (SWISSLAB, Berlin, Germany). We assessed 25 preoperative patient characteristics, such as age, sex, height, weight, body surface area (BSA), left ventricular ejection fraction, current smoking, concomitant diagnoses [myocardial infarction (MI), stroke, diabetes, chronic obstructive pulmonary disease (COPD), renal replacement therapy, peripheral arterial occlusive disease (PAOD) stage II or higher], number of vessel disease, New York Heart Association (NYHA) functional class, logistic EuroSCORE, Htc, previous cardiac surgery and use of medications such as β-blockers, aspirin, intravenous nitrates, ticlopidin, angiotensin converting enzyme inhibitors/angiotension II-blockers and clopidogrel. In addition, we considered 11 peri- and postoperative parameters, such as operation priority, on-pump or off-pump surgery, operative time, number of anastomoses, RBC storage time, number of platelet units, Hbmin and Htcmin, C-reactive protein (CRP)max, leucocytemax, duration of mechanical ventilatory support [18], ICU stay [19, 20] and in-hospital stay. Moreover, we assessed 10 postoperative event categories such as in-hospital mortality, 30-day mortality, re-thoracotomy, low output syndrome (LOS), stroke, haemofiltration, wound infection, prolonged intensive care unit (ICU) stay (>48 h), prolonged mechanical ventilatory support (>24 h) and 1-year mortality.
End-points
The primary end-point was 30-day mortality. Mortality data were assessed from the THGQIMS database (until discharge) or reported on a standardized form (after discharge) completed by either the patients or their general practitioners. We added missing data by conducting telephone interviews. Secondary end-points were classified as major clinical complications and minor events: Major clinical complications were the incidence of LOS, stroke, haemofiltration, wound infection and prolonged mechanical ventilatory support (>48 h). Prolonged (>48 h) ICU stay was considered a minor event. The secondary end-points were assessed until discharge. LOS was defined as a cardiac index ≤2.5 l/min/m2 or mixed venous oxygen blood saturation (SvO2) ≤55% requiring high-dose inotropic support and/or the need for temporary mechanical circulatory support. A stroke was considered present when a clinically manifest motoric, sensory or cognitive neurological deficit was recorded due to a cerebrovascular event. Infectious complications included superficial or deep sternal wound infections, sepsis or septicaemia and pneumonia. Renal replacement therapy via continuous veno-venous haemofiltration was initiated in case of renal failure refractory to pharmacological therapy (repetitive boluses of 0.5–1 mg/kg furosemide i.v.) leading to hyperuricaemia, hyperkalaemia and excessive volume overload.
Statistics
Categorical variables are summarized as percentages. Since all continuous variables were non-normally distributed, these data are displayed as median and interquartile range. We tested normal distribution of the data using the Kolmogorov–Smirnov test. Normal distribution was considered if probability values were greater than 0.05. We used Fisher's exact test and the Mann–Whitney U-test, respectively, to assess differences in preoperative categorical variables and continuous variables between the RBC+ and RBC− groups.
We performed propensity score (PS)-adjusted logistic regression analysis to evaluate the association of the study group with 30-day mortality and other clinical outcomes, respectively. The PS-adjusted analyses were performed to control for selection bias due to non-random group assignment [21]. The PS derivation model was constructed using multivariable logistic regression, with the RBC group as the binominal dependent variable and the preoperative variables listed in Table 1 as predictor variables. The model's reliability and predictive ability were measured with the Hosmer–Lemeshow test and the c-index, respectively. In subgroup analysis, we assessed the association between duration of blood storage and clinical outcome. According to previous findings [110], we used a storage time of 14 days as the cut-off. To further study the dose–response relationship between storage time and clinical outcome, we also categorized the RBC+ group into quintiles. We constructed a composite end-point including 30-day mortality and the incidence of LOS, stroke, haemofiltration, wound infection, prolonged ICU stay and prolonged mechanical ventilator support. We performed multivariable-adjusted logistic regression analysis to assess the relationship of duration of blood storage with the composite end-point. We considered the P-values of <0.05 as statistically significant. All P-values are reported as two-sided. Analyses were performed using the statistical software package IBM® SPSS®, version 21 (Chicago, IL, USA).
Baseline characteristics of the study groups
| Parameters | RBC− Group (n = 1478) | RBC+ Group (n = 1528) | P value |
|---|---|---|---|
| Age (years) | 62 (56;71) | 69 (61;74) | <0.001 |
| Gender, males (%) | 93.2 | 81.2 | <0.001 |
| Body weight (kg) | 88 (80;98) | 83 (75;93) | <0.001 |
| Body height (m) | 1.75 (1.70;1.80) | 1.73 (1.68;1.78) | <0.001 |
| Body surface area (m2) | 2.06 (1.95;2.20) | 2.00 (1.90;2.10) | <0.001 |
| Haematocrit (%) | 43.4 (40.9;45.6) | 41.2 (38.7;43.6) | <0.001 |
| Left ventricular ejection fraction (%) | 60 (55;65) | 60 (50;65) | <0.001 |
| EuroSCORE (logistic) | 1.8 (1.1;2.9) | 2.7 (1.6;4.7) | <0.001 |
| Smoker (%) | 50.5 | 41.6 | <0.001 |
| Diabetes mellitus (%) | 30.9 | 33.1 | 0.214 |
| Haemofiltration (%) | 0.0 | 0.2 | >0.999 |
| Stroke (%) | 2.7 | 2.8 | 0.912 |
| Myocardial infarction (%) | 26.6 | 29.9 | 0.044 |
| Chronic obstructive pulmonary disease (%) | 2.1 | 1.8 | 0.246 |
| Redo (%) | 2.9 | 4.7 | 0.063 |
| Vessel diseases (n) | 3 (2;3) | 3 (3;3) | <0.001 |
| Peripheral arterial occlusive disease (%) | 8.3 | 10.2 | 0.160 |
| NYHA Class > II (%) | 32.3 | 41.5 | <0.001 |
| Operation priority, urgent/emergent (%) | 8.2 | 10.7 | 0.092 |
| eGFR (ml/min/1.73 m2) | 85.4 (71.8;98.2) | 80.2 (65.4;93.0) | <0.001 |
| Medications | |||
| β-Blockers (%) | 72.0 | 73.0 | 0.542 |
| ACE inhibitors/AT-blockers (%) | 62.3 | 64.9 | 0.141 |
| Nitrates, intravenous (%) | 3.3 | 3.0 | 0.757 |
| Aspirin (%) | 76.3 | 72.8 | 0.027 |
| Clopidogrel (%) | 12.3 | 14.1 | 0.133 |
| Ticlopidin (%) | 0.3 | 0.3 | 0.751 |
| Off-pump surgery (%) | 78.8 | 65.3 | <0.001 |
RBC: red blood cells; NYHA: New York Heart Association; eGFR: estimated glomerular filtration rate; ACE: angiotensin-converting enzyme; AT: angiotensin.
RESULTS
Baseline characteristics
Three thousand and fifty patients who met our inclusion criteria were considered for data analysis (Fig. 1). We excluded 44 patients with incomplete data sets, e.g. missing preoperative, perioperative and/or postoperative values, leaving a total of 3006 patients for data analysis. The vast majority of patients were Caucasians. Preoperative characteristics of the study groups are listed in Table 1. All continuous variables differed significantly between groups. In detail, age, EuroSCORE and number of vessel disease were significantly lower, whereas height, weight, BSA, Htc and estimated glomerular filtration rate were significantly higher in the RBC− group compared with the RBC+ group. In addition, the percentages of males and smokers were higher, whereas the percentages of patients with previous MI and NYHA class >II were lower in the RCB− than in the RBC+ group. Off-pump surgery was performed more often in the RBC− group than in the RBC+ group. However, the two groups were comparable regarding concomitant diagnoses, such as diabetes, stroke, COPD and PAOD, redo and operation priority, and also with respect to prescription of medications, with the exception of aspirin.
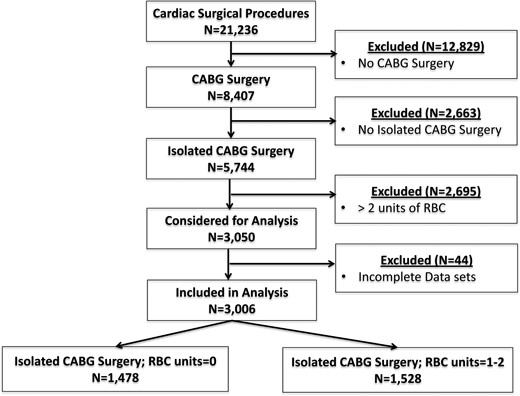
Flow chart of included patients. CABG: coronary artery bypass grafting; RBCs: red blood cells.
The PS ranged from a low of 0.0195 to a high of 0.9992. The PS model was reliable (Hosmer–Lemeshow test P = 0.203) and moderately discriminatory [c-statistic = 0.772, 95% confidence interval (CI): 0.756–0.788].
Perioperative parameters
Operative time did not differ significantly between the groups (Table 2). The number of anastomoses was (slightly, but significantly) higher in the RBC+ group than in the RBC− group (total number: 4286 vs 4122) and so was the use of units of platelets (total units: 322 vs 146). Hbmin and Htcmin were lower, whereas mechanical ventilatory support time and time of ICU stay were significantly higher in the RBC+ group than in the RBC− group.
Perioperative parameters of the study cohort, broken down by RBC use
| Parameters | RBC− group (n = 1478) | RBC+ group (n = 1528) | P value |
|---|---|---|---|
| Operative time (min) | 188 (155;222) | 189 (159;218) | 0.81 |
| Anastomoses (n) | 3 (2;3) | 3 (2;3) | 0.001 |
| Platelet units (n) | 0 (0;0) | 0 (0;0) | <0.001 |
| Haemoglobinmin (g/dl) | 10.0 (9.4;10.7) | 9.7 (9.1;10.3) | <0.001 |
| Haematocritmin (%) | 29.2 (27.2;31.2) | 28.3 (26.6;30.1) | <0.001 |
| C-reactive protein (mg/l) | 190 (150;240) | 200 (160;240) | 0.065 |
| Leucocytes (109/l) | 13.9 (11.5;16.9) | 13.2 (11.0;16.0) | <0.001 |
| Mechanical ventilatory support (h) | 7.0 (5.3;9.1) | 7.9 (6.2;10.2) | <0.001 |
| ICU stay (h) | 21 (17;24) | 22 (18;26) | 0.001 |
| In-hospital stay (days) | 11 (10;13) | 12 (10;13) | 0.093 |
ICU: intensive care unit; RBC: red blood cells.
Primary end-point
Thirty-day mortality rates in the RBC− and RBC+ group were 0.3% (n = 4) and 0.2% (n = 3), respectively. Causes of death in the RBC− group were cardiogenic shock (n = 2), ventricular fibrillation (n = 1) and anaphylactic shock (n = 1). In the RBC+ group, causes of death were cardiogenic shock (n = 1), stroke (n = 1) and acute MI (n = 1). Compared with the RBC− group, PS-adjusted OR of 30-day mortality in the RBC+ group was 0.29 (95% CI: 0.06–1.50; P = 0.14). Results did not differ if the analysis was restricted to the subgroup of patients undergoing off-pump surgery (Supplementary Table 1).
Secondary end-points
Data on perioperative secondary end-points are presented in Table 3. Compared with the RBC− group, PS-adjusted OR of prolonged ICU stay was significantly higher and prolonged mechanical ventilator support tended to be higher in the RBC+ group. However, major clinical complications such as LOS, stroke, haemofiltration and wound infection did not differ significantly between the groups. Moreover, values of CRPmax and leucocytemax were not indicative of higher incidence of wound infection in either of the two groups (Table 2).
Incidence (in %) and OR of primary and secondary end-points in the study cohort, broken down by use of red blood cell units
| Parameters | RBC− group (n = 1478) | RBC+ group (n = 1528) | Unadjusted OR (95% CI) | PS-adjusted ORa (95% CI) | P value |
|---|---|---|---|---|---|
| Primary end-point | |||||
| Thirty-day mortality | 0.3% | 0.2% | 0.73 (0.16;3.27) | 0.29 (0.06;1.50) | 0.140 |
| Secondary end-points | |||||
| Low cardiac output syndrome | 0.6% | 1.2% | 2.07 (0.94;4.59) | 1.55 (0.64;3.79) | 0.334 |
| Stroke | 0.6% | 0.6% | 0.98 (0.39;2.46) | 0.74 (0.24;2.24) | 0.588 |
| Haemofiltration | 0.1% | 0.2% | 2.93 (0.30;28.20) | 5.20 (0.45;60.29) | 0.187 |
| Wound infection | 0.3% | 0.2% | 0.73 (0.16;3.27) | 0.76 (0.14;4.12) | 0.745 |
| Prolonged ICU stay (>48 h) | 9.2% | 11.9% | 1.33 (1.05;1.68) | 1.49 (1.14;1.95) | 0.004 |
| Prolonged mechanical ventilatory support (>24 h) | 0.9% | 1.4% | 1.56 (0.78;3.14) | 2.22 (0.99;4.96) | 0.052 |
ICU: intensive care unit; OR: odds ratio; PS: propensity score; RBC: red blood cells.
aAdjusted for propensity score.
Subgroup analysis of duration of red blood cell storage and outcomes
Table 4 displays the unadjusted results of postoperative complications in the subgroup of patients receiving 1–2 units of RBCs, according to the duration of RBC storage. In patients receiving blood products that had been stored for 14 days or more, time of ICU stay was significantly prolonged. Thirty-day mortality was comparable between patients receiving newer and older RBCs (0 and 0.2%, respectively; P = 0.517) and so was in-hospital mortality (0 and 0.3%, respectively; P = 0.275).
Incidence (in %) of postoperative complications in patients receiving 1–2 units of red blood cells, according to the duration of blood storage time
| Parameters | Patients receiving newer blood (n = 629) | Patients receiving older blood (n = 914) | P value |
|---|---|---|---|
| Thirty-day mortality | 0.0% | 0.2% | 0.517 |
| Low cardiac output syndrome | 1.1% | 1.3% | 0.817 |
| Stroke | 0.8% | 0.5% | 0.540 |
| Haemofiltration | 0.2% | 0.2% | >0.999 |
| Wound infection | 0.0% | 0.3% | 0.275 |
| Prolonged ICU stay (>48 h) | 9.2% | 13.7% | 0.008 |
| Prolonged mechanical ventilatory support (>24 h) | 1.1% | 1.5% | 0.656 |
| Composite outcomea | 10.4% | 14.9% | 0.011 |
ICU: intensive care unit.
aThe composite outcome incorporates all the complications listed in the table.
The unadjusted incidence of the composite outcome was significantly higher in patients receiving older blood compared with patients receiving newer blood. In Table 5, the unadjusted and multivariable-adjusted results of the dose–response relationship of the duration of RBC storage with the composite outcome are presented. However, duration of blood storage was not independently associated with the composite outcome. Moreover, values of CRPmax and leucocytemax did not differ significantly between subgroups (data not shown).
ORs for the composite outcomea by subgroups of duration of blood storage
| Events (n, %) | Unadjusted OR (95% CI) | Multivariable-adjustedb OR (95% CI) | |
|---|---|---|---|
| Duration of blood storage | |||
| 1–9 days (n = 300) | 38 (12.7) | 1.0 (reference) | 1.0 (reference) |
| 10–14 days (n = 325) | 27 (8.3) | 0.63 (0.37–1.05) | 0.68 (0.39–1.19) |
| 15–20 days (n = 320) | 52 (16.3) | 1.34 (0.85–2.10) | 1.46 (0.89–2.39) |
| 21–28 days (n = 294) | 38 (12.9) | 1.01 (0.63–1.66) | 1.18 (0.70–1.98) |
| >28 days (n = 295) | 45 (15.3) | 1.24 (0.78–1.98) | 1.30 (0.78–2.16) |
| P for trend | 0.034 | 0.051 | |
OR: odds ratio.
aThe composite outcome incorporates all the complications listed in Table 4.
bAdjusted for age, gender, body surface area, haematocrit, left ventricular ejection fraction, EuroSCORE, smoking, diabetes mellitus, preoperative myocardial infarction, redo, vessel diseases, peripheral arterial occlusive disease, NYHA class, operation priority, estimated glomerular filtration rate, off-pump/on-pump surgery, medications (ACE/AT use, aspirin use, clopidogrel use).
DISCUSSION
Our data do not indicate an association between the transfusion of 1–2 units of LD RBCs and 30-day mortality in CABG patients, regardless of whether the procedure was performed ‘on-pump’ or ‘off-pump’. Moreover, in subgroup analysis even the duration of storage was not associated with significant differences in a composite of major clinical complications or laboratory surrogate parameters of infection/inflammation. Consequently, our data do not support study results from the state of Michigan [15, 16], where transfusions of 1–2 units of RBCs were associated with an increase in the incidence of organ complications such as renal failure, permanent stroke and postoperative cardiac LOS as well as higher mortality. Notably, in Germany, only LD RBCs are transfused. Compared with standard (leucocyte-containing) RBCs, the use of LD RBCs results in a reduction of infection rates, predominantly of the respiratory system, and in lower mortality in cardiac surgery [8, 9]. The administration of LD RBCs is not a standard procedure in the USA [22]. Although in the referred study [15, 16] no information is provided about the quality of the RBCs in this regard, it can be expected that only a minor group of patients received LD RBCs. Consequently, differences in RBC quality may at least in part explain dissimilar results between the present study and the US investigation. Our data support recent findings that a restrictive transfusion threshold after cardiac surgery was not superior to a liberal threshold with respect to morbidity such as serious infection, permanent stroke, MI, infarction of the gut or acute kidney injury [2]. Moreover, our data suggest that even the avoidance of transfusion is not superior to the transfusion of small amounts of RBCs.
Nevertheless, we observed a significantly ‘prolonged ICU stay’ in the RBC+ group compared with the RBC− group. However, it is noteworthy that this end-point is strongly dependent on the individual decision of the responsible physician. Prolonged ICU stay may therefore be the consequence and not the cause of RBC transfusion. It is conceivable that patients, due to an increased morbidity (as indicated by high EuroSCORE values) and/or impaired pulmonary function after surgery, were more liberally transfused and discharged from the ICU later. In this scenario, reversed causation bias is a problem, e.g. that morbidity would trigger the transfusion and not vice versa. However, it may also be that prolonged ICU stay or prolonged postoperative mechanical ventilatory support may simply have no relation with transfusion.
In the subgroup of patients receiving RBC transfusion, there was no general trend toward an adverse association of the duration of storage with clinical outcome. In detail, compared with the reference group (duration of storage 1–9 days) none of the other subgroups differed significantly with respect to the ‘composite end-point’. Notably, the impact of the RBC storage time on the number of patients needing ‘prolonged mechanical ventilation’ was negligible and even the laboratory surrogate parameters of infection/inflammation were not affected by the storage time. Therefore, our data are in line with results by Steiner et al. [14]. That study also used LD RBCs and could demonstrate that duration of storage was not associated with significant differences in the change in multiple organ dysfunction in cardiac surgical patients.
Our study has some limitations, which are of a statistical nature. The relative low number of ‘major clinical events’ in the groups of ‘transfused’ and ‘non-transfused’ patients leads to the fact that the composite end-point is mainly influenced by the minor event, prolonged ICU stay. Nevertheless, our data support the aforementioned randomized controlled trials that neither the number of RBCs [2] nor the storage time [13] has a significant impact on major clinical complications. As discussed before, a certain and serious limitation of a retrospective analysis is that reversed causation bias cannot be excluded, e.g. that RBC transfusion is the consequence and not the cause of increased morbidity.
In conclusion, our data could not support earlier results of an association between the transfusion of 1–2 units of RBC with morbidity or mortality in patients undergoing isolated primary CABG.
SUPPLEMENTARY MATERIAL
Supplementary Material is available at EJCTS online.
Funding
This work was supported by the Heart and Diabetes Center NRW, Bad Oeynhausen, Ruhr-University Bochum, Germany.
Conflict of interest: none declared.
REFERENCES
