


Small-sized aortic bioprostheses may cause high postoperative gradients. In clinical practice, it is difficult to compare bioprostheses from different manufactures, owing to the discrepancy between the true size and the nominal size of the prosthesis and the inter-patient variability in aortic root characteristics. In vitro studies provide accurate data, and using a system in which it is possible to implant bioprostheses in a true aortic root should enable a fair comparison to be made. The present study compared the four most widely used pericardial stented bioprostheses from different manufacturers surgically implanted in small annulus, to detect any differences in their fluid-dynamic performance.
The four types of bioprostheses, each implanted in a randomized sequence in eight porcine aortic roots, with a native annulus of 2.1 cm, were tested in a mock loop at 65 ml of stroke volume by calculating hydrodynamic parameters, namely mean pressure drop and effective orifice area, performance index, valve resistance and % of energy loss. The prostheses that fitted the aortic root after sizing were as follows: a Magna Ease 21, a Trifecta 21, a Soprano-Armonia 20 and a Mitroflow 23.
Effective orifice areas were 1.57 ± 0.2, 1.77 ± 0.2, 2.3 ± 0.3 and 1.75 ± 0.2 cm2 (P < 0.001) for Magna Ease, Mitroflow, Trifecta and Soprano-Armonia, respectively. The mean gradients were 13.2 ± 3, 10.2 ± 3, 6.1 ± 2 and 9.6 ± 2 mmHg (P < 0.001) for Magna Ease, Mitroflow, Trifecta and Soprano-Armonia, respectively. The performance indices were 0.50 ± 0.06, 0.63 ± 0.08, 0.89 ± 0.13 and 0.56 ± 0.07 (P < 0.001) for Magna Ease, Mitroflow, Trifecta and Soprano-Armonia, respectively. The valve resistance, expressed in (dyn*s/cm5), was 69 ± 16, 55 ± 13, 33 ± 10 and 51 ± 11 (P < 0.001) for Magna Ease, Mitroflow, Trifecta and Soprano-Armonia, respectively. The percent of energy loss was 13.5 ± 0.5, 10.7 ± 2.5, 6.6 ± 1.6, 10.9 ± 1.8 (P < 0.001) for Magna Ease, Mitroflow, Trifecta and Soprano-Armonia, respectively.
Our study combined the fluid-dynamic reproducibility of the in vitro study with, by using porcine aortic roots, the specificity of surgery. The results confirmed that bioprostheses are inherently obstructive compared with the native aortic valve and showed that bioprostheses with the pericardium outside the stent are more efficient.
INTRODUCTION
After aortic valve replacement, some degree of residual gradient persists, especially when small prostheses are implanted [1, 2]; this may negatively influence patients' survival and quality of life [3–5]. Because stented prostheses are inherently obstructive, the use of both stentless valves and annulus enlargement has been proposed in order to implant a prosthesis that fits the patient's haemodynamic requirements; so far, however, these two approaches have shown negligible clinical effects [6, 7]. Pericardial bioprostheses, which are currently widely used, have excellent durability and perform better than porcine prostheses, especially in small aortic roots [8, 9].
Several types of pericardial prosthesis are currently available. These differ in design, and, except for the Soprano-Armonia (SA) from the Sorin group, all are sized according to a series of odd numbers from 19 to 29. Moreover, prostheses with the same labelled size from different manufacturers differ in terms of internal diameter (ID), tissue annulus diameter (TAD) and external diameter (ED) [10]. The heterogeneity of the true dimensions of prostheses and the variability in patients' aortic root anatomy influence the size of the prosthesis to be implanted; it is therefore difficult to make a fair comparison of the haemodynamic performance of the various prostheses in the clinical setting. Indeed, even a prosthesis of the same size made by the same manufacturer may not fit in two patients with the same native aortic annulus dimensions [11].
To evaluate the fluid-dynamic behaviour of bioprostheses, the in vitro setting is the ‘gold standard’, as it allows the device to be studied thoroughly, that is, in systolic and diastolic phases, in a very simplified environment with a high level of accuracy. In an attempt to make a fair comparison, Gerosa et al. [12] set-up an investigational study in which they inserted prostheses of different labelled sizes that fitted the 21-mm first mounting ring. However, a prosthesis needs to be implanted and sutured in an aortic root that has its own specific characteristics, which may influence the haemodynamic result [13]. Thus, to eliminate the effect of the specific aortic root characteristics, different prostheses should be implanted in the same aortic root. Recently, an in vitro approach has been developed, which uses mock loop devices with an aortic root inserted in the circuit, in order to recreate realistic haemodynamic conditions in the laboratory [14–16]. The aim of the present study was to evaluate any differences in the fluid-dynamic performance of the four most widely used stented pericardial bioprostheses, namely, Magna Ease (MG) (Edwards Lifescience), Trifecta (TRI) (St. Jude Medical), Mitroflow (MF) and Soprano-Armonia (Sorin group). To make a fair comparison, we studied those labelled sizes that fitted porcine aortic roots with a native aortic annulus of 2.1 cm in diameter.
MATERIALS AND METHODS
FoRCardioLab pulsatile mock loop
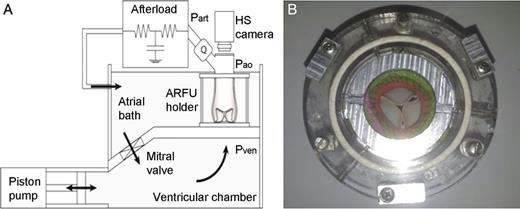
(A) The mock loop scheme and (B) a prosthesis implanted in the ARFU (aortic root functional unit) housed in the holder.
Sample preparation and prosthesis sizing
In order to replicate the operating theatre scenario, the strategy adopted was to choose the prosthesis size of each valve under guidance by the probes and the valve replica for each brand, in order to implant a valve that would fit the annulus. Eight fresh whole swine hearts were selected with a native aortic annulus of 2.1 cm, as measured by a metric probe. Prosthesis sizing was then performed by using the probes provided by the manufacturer of each prosthesis on the eight whole porcine hearts, in order to select a prosthesis that could be comfortably implanted, with only slight forcing at the most. This approach was adopted because the porcine ascending aorta was extremely elastic, a feature that might have introduced a bias into prosthesis size selection. Indeed, oversizing was theoretically possible in the case of all valves, owing to the extreme elasticity of the aortic root wall; in real life, however, the stiffness of the aorta would have made this difficult, if not impossible. The probes that fitted for TRI and MG had the label size of 21, and the valve replica of both seemed to fit perfectly (neither too big nor too small); thus, a size 21 was selected for both. The sizing strategy for the MF was undertaken with the valve replica alone, as this is the only tool provided by the manufacture; a labelled size 23 was chosen, as this fitted well. These three valves— TRI, MG and MF—have the same ED, which is 2.6 cm. With regard to the SA, the decision was not so straightforward; even though the probe for the size labelled 22 was able to get through the native annulus, the valve replica appeared too bulky to use. A size 20 was therefore chosen. Nevertheless, this had to be forced slightly, as its ED is 28 mm.
The aortic root samples were then harvested by two experienced surgeons. The samples included 1.5 cm of the left ventricular outflow tract, which was rendered cylindrical by closing the mitral valve commissures with a running suture to the adjacent muscular septum. The ascending aorta was transected 0.5 cm above the sinotubular junction and the coronary ostia were ligated to prevent fluid loss. Circular Dacron meshes were sutured to the inflow and outflow of the aortic root sample, in order to fix it into the housing section of the mock loop, as previously described [14–16].
Experimental design
Tests simulating physiological conditions for patients at rest were conducted on the mock loop. The stroke volume (SV) imposed by the pulsatile pump was set at 65 ml, similar to the basal value in patients with a native aortic annulus of 2.1 cm. The systolic ejection time was set at one-third of the entire cardiac cycle, and the heart rate at 70 bpm, with a mean simulated arterial pressure of 80–104 mmHg.
After being excised and housed in the test-section holder of the mock loop, each of the eight fresh porcine aortic root samples was first tested untreated (basal condition). The four bioprostheses were then successively implanted in each sample in a randomized sequence. Each prosthesis was tested and then carefully removed from the aortic root; this led to a total of 40 experimental points (eight aortic roots per four bioprostheses, plus eight experimental points in basal conditions). For each point, experimental data were evaluated over five consecutive simulated heart cycles.
The prostheses were implanted by means of a simple interrupted suture technique with Ethibond 2/0. After each implantation, and prior to testing in the mock loop, the prostheses were visually inspected via the digital video, in order to qualitatively assess their integrity and proper functioning. No prosthesis needed to be discarded during the entire experiment.
The flow rate, the pressures upstream and downstream of the aortic root and the pressure in the afterload were acquired at a sampling rate of 200 Hz via an A/D acquisition board. Post-processing of the raw data was performed to calculate the following quantities:
(i) The mean systolic pressure drop (Δpm, mmHg) across the aortic root unit as shown in Fig. 1, as the difference between pressures measured at Pven and Pao (Fig. 1) averaged over the systolic interval.
(ii) The maximum systolic pressure drop (Δpm, mmHg).
(iv) Performance index (Pi) = EOA/IA. IA stands for the internal area, calculated from the ID values provided by the manufacturers as TRI = 1.83 cm, MF = 1.9 cm, SA = 1.98 cm and MG = 2.0 cm.
(v) Valve resistance (VR) = 1333*Δpm/mean flow (ml/s), where Δp mean is the pressure drop across the valve.
(vi) Systolic energy loss (%): the percentage of the energy provided by the pump that is lost when the fluid passes through the prosthesis.
Statistical analysis
Continuous variables were expressed as mean values ± standard deviation (SD) and compared by analysis of variance for repeated measures; in the graphic, the values were reported with 95% of confidence intervals; P-values < 0.05 were considered significant. Post hoc analysis was done by applying the Bonferroni test. The data were analysed by means of the StatSoft 8.2 software.
RESULTS
Fluid-dynamic results
| MG | MF | TRI | SA | Native valve | P-value | |
|---|---|---|---|---|---|---|
| SV (ml) | 68 ± 4 | 66 ± 4 | 67 ± 4 | 65 ± 7 | 69 ± 3 | 0.543 |
| Mean flow (ml/s) | 252 ± 11 | 247 ± 13 | 247 ± 12 | 246 ± 22 | 251 ± 9 | 0.824 |
| Mean gradient (mmHg) | 13.2 ± 3a,b.c.d | 10.2 ± 3e,f | 6.1 ± 2g,h | 9.6 ± 3i | 2 ± 0.3 | <0.001 |
| Peak gradient (mmHg) | 30 ± 4a,b,c,d | 25 ± 4f,l | 21 ± 3h | 24 ± 2i | 16 ± 1 | <0.001 |
| EOA (cm2) | 1.57 ± 0.2b,d | 1.77 ± 0.2e,f | 2.31 ± 0.3g,h | 1.75 ± 0.2i | 4 ± 0.4 | <0.001 |
| Performance index | 0.50 ± 0.06a,b | 0.63 ± 0.08e | 0.89 ± 0.13g | 0.56 ± 0.07 | na | <0.001 |
| Mean systolic Pr (mmHg) | 87 ± 6m | 89 ± 14 | 87 ± 7n | 80 ± 13i | 104 ± 15 | <0.001 |
| Valve resistance (dyn*s/cm5) | 69 ± 16a,b,c,d | 55 ± 13e,f | 33 ± 10g,h | 51 ± 11i | 10 ± 2 | <0.001 |
| En loss (%) | 13.5 ± 0.5a,b,c,d | 10.7 ± 2.5e,f | 6.6 ± 1.6g,h | 10.9 ± 1.8i | 2.1 ± 0.5 | <0.001 |
aMG vs MF P < 0.01.
bMG vs TRI P < 0.01.
cMG vs SA P < 0.01.
dMG vs Native P < 0.01.
eMF vs TRI P < 0.01.
fMF vs Native P < 0.01.
gTRI vs SA P < 0.01.
hTRI vs Native P < 0.01.
iSA vs Native P < 0.01.
lMF vs TRI P = 0.04.
mMG vs Native P = 0.02.
nTRI vs Native P = 0.02.
MG: Magna Ease; MF: Mitroflow; TRI: Trifecta; SA: Soprano-Armonia; SV: stroke volume; EOA: effective orifice area.
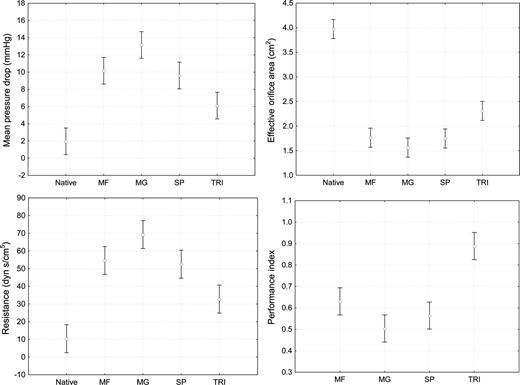
Data graphically reported with means and 95% confidence intervals.
DISCUSSION
This study confirmed that implanted stented prostheses are inherently obstructive, in that all the parameters considered revealed poorer haemodynamic performance than that of the native valve (Table 1). This is due to several reasons: ID dimension, the stiffness of the mounting stent, the nature of the leaflets and their stiffness, the position where the pericardium is mounted (i.e. inside or outside the stent) and the ‘annulus-prosthesis’ interaction.
As high residual gradients and patient-prosthesis mismatch have been associated to worse early and long-term outcomes [3–5], the performance of the prosthesis cannot be neglected. Pericardial stented valves have a better fluid-dynamic performance than porcine valves, and these differences are more pronounced in patients with a smaller aortic annulus [8, 9].
However, performance alone is not the only aspect to consider. To meet the patient's haemodynamic requirements, the sizing of the stented valve and the anatomy of the aortic root appear to have an important role in selecting the dimensions of prostheses [13]. In this regard, Doenst et al. showed that postoperative haemodynamic results can be influenced by the sizing strategy indicated by the manufacturer, and Ruzicka et al. [11] reported that, even in patients with native annuli of the same size, it is not always possible to implant the same size of prosthesis of the same brand. In addition, a role might also be played by the suture technique used to implant the prosthesis [17]. Thus, the haemodynamic results stem not only from the efficiency of the prosthesis but also from a process that involves the manufacturer's sizing strategy, the aim of which is to help the surgeon to implant the valve comfortably, and the surgeon's own ‘strategy’, the aim of which is to implant a valve that best fits the patient's haemodynamic requirements. The surgeon's strategy requires experience and knowledge of the dimensions of the bioprostheses of each brand, as the ID and encumbrance (i.e. TAD and ED) differ from one prosthesis to another.
Interpretation of in vitro study results
All the prostheses examined in this study yielded excellent fluid-dynamic performance, with low gradients and consistent EOAs. The performance of the TRI, however, proved to be better than that of the other prostheses studied with on average, an EOA larger than that of the other valves, and the mean gradients behaved accordingly (Table 1 and Fig. 2). These results cannot be directly compared with those from other in vitro studies because we tested prostheses that were surgically implanted. However, with regard to in vitro results for MF, MG and SA, in terms of both EOAs and mean gradients, our results were consistent with those reported by other authors [12]. Our data are also in line with those reported in clinical study by Ugur et al. [18] and Wendt et al. [19] in which the TRI 21 size showed lower gradients, larger EOAs and lower incidence of patient-prosthesis mismatch than MF 23 and/or MG 21 sizes.
Durability is the most important characteristic required of a bioprosthesis and the small differences, in mean gradients, we found in our study are unlikely to have a clinical impact in the population of patients in which these prostheses are usually implanted.
The transvalvular gradient is mainly dependent on both SV and EOA [20]. The EOA is related to the GOA, which is, in turn, related both to the ID of the prosthesis and to the impedance of the leaflets, as they may reduce the area made available by the size of the inner ring. This is confirmed by our study, as reported in Table 1 and Fig. 2. Indeed, TRI, whose pericardial sheet is outside the stent, had the smallest ID but provided the largest EOA, with a Pi of 0.89 ± 0.13; this means that the internal area was almost completely available to the flow. MF displayed a similar trend; its Pi of 0.63 ± 0.08 being better than those of both MGs 0.50 ± 0.06 (P = 0.01) and SAs 0.56 ± 0.07, though in the case of this latter prosthesis, the difference did not reach statistical significance (P = 0.133). When the pericardial sheet is outside the stent, the stent itself must be thin; thus, we cannot exclude the possibility that the commissures are pushed outward during systole, thereby contributing to this large EOA. With such a Pi, it is plausible that the haemodynamic performance of TRI is close to that of a stentless valve, as recently shown during stress testing [21] and in a randomized study in patients with a small aortic annulus [22]. In the latter study, it was found that, in patients with an average native annulus of 2.1 ± 0.1 cm, the mean gradient on discharge was as low as 5.5 ± 3 mmHg for TRI vs 7.5 ± 4 for Freestyle, with a P-value close to significance (P = 0.06).
In our study, we combined the haemodynamic reproducibility of the in vitro setting with the specificity of surgery by surgically implanting prostheses in a porcine aortic root. We were able to make a fair comparison among the four stented pericardial prostheses, as each prosthesis was implanted in the same anatomical conditions, following standardized sizing in order to avoid the biases of the manufacturers' sizing strategy. It is interesting to note how the aortic root-prosthesis interaction influenced the mean gradients, the SD of the mean gradient of the native valve being 5- to 10-fold smaller than the SD of the mean gradients of the prostheses. This confirms that the haemodynamic results differ according to the aortic root in which the bioprosthesis is implanted. Thus, comparisons of haemodynamic performance among prostheses of different brands in clinical studies are inaccurate, and the only way to obtain fairly reliable data on performance is to make comparisons on the basis of the actual native annulus diameter that the different bioprostheses fit.
Conclusion
The present study showed that prostheses with the pericardium housed outside the stent were more efficient, and that TRI displayed better haemodynamics than the other prostheses. This study also highlights how difficult it is to compare different types of prostheses in clinical studies and the fact that comparison has to be made at least by taking into account the native aortic annulus size. The role of the surgeon and the sizing strategy adopted appear to be very important in exploiting, or failing to exploit, the haemodynamic characteristics of the prosthesis.
Study limitations
Even though in this study all the conditions to which the prostheses were exposed were equal, the implantability characteristics of each bioprosthesis along with the surgeon level of experience in implanting a specific type of prosthesis might have influenced the results. However, these are biases difficult to neutralize because they are specific to the surgical act.
ACKNOWLEDGEMENTS
This study was supported by the FoRCardio Foundation (Fondazione per la Ricerca in Cardiochirurgia), Milan, Italy. We thank PierVirgilio Parrella (Principal Statistician, GSK Manufacturing SpA) for his assistance in the statistical analysis.
Conflict of interest: Giordano Tasca reports lecture fees from St-Jude Medical Italia SpA.
