


Abstract
Initial evidence suggests that total cavopulmonary connection (TCPC) completion during winter is associated with prolonged pleural effusion and hospitalization. This study was carried out to review the impact of season of operation on short-term outcome after TCPC procedure.
We conducted a retrospective study on 104 consecutive patients who underwent the extracardiac TCPC procedure from June 2006 to November 2011 (mean age 5.0 ± 2.6 years, 60 males). The outcomes of interest assessed were length of postoperative hospital stay (LOS) and duration of pleural drainage. These were adjusted to potential, known standard Fontan risk factors such as age, ventricular morphology, cardiac function and previous surgical history. Length of chest drainage and LOS in the period November–March (NM) was compared with that in the period April–October (AO).
Of the 104 patients, 6 patients were excluded since they either required early reoperation or were transferred to another institution for their postoperative care. The group included 26 children with hypoplastic left heart syndrome. Thirty-four of the 98 remaining patients (34.7%) had surgery in the NM period. Overall, length of pleural drainage was 9 days (interquartile range 6–13) and LOS was 12 days (9–17). TCPC surgery in the NM period (P = 0.045), male gender (P = 0.020) and right ventricular morphology (P = 0.034) were the only variables associated with prolonged LOS at univariate analysis; no other factor including ventricular function, Glenn pressure, weight and age at operation were associated with LOS. NM surgery was the only predictor of LOS at multivariate analysis (P = 0.045). Patients with surgery in the NM period had a higher incidence of low cardiac output/acute renal dysfunction postoperatively (26.5 vs 9.4%, P = 0.038) and a higher incidence of infections requiring antibiotic use (64.7 vs 32.8%, P = 0.003).
TCPC surgery performed in the period between November and March is associated with increased morbidity, especially longer hospitalization. Given the elective nature of TCPC operation, this operation should be scheduled outside of the NM period if possible.
INTRODUCTION
In 1971, Fontan and Baudet reported the first successful total right-heart bypass, which was initially used to palliate patients with tricuspid atresia. The goal was to separate the pulmonary and systemic circulations and to relieve the ventricular volume overload [1]. Since the original description, the total cavopulmonary connection (TCPC) procedure and its modifications have been applied to virtually all patients with single-ventricle physiology [2].
For the past two decades, advances in surgical technique and postoperative management have led to substantial reductions in early mortality despite application of the operation to high-risk patients like hypoplastic left heart syndrome (HLHS) [3]. Several recent reports demonstrate mortality rates as low as 0–5.5% [4, 5]. Therefore, mortality after TCPC operation is no longer a realistic endpoint as a good marker of patient outcome [6].
Despite the improvement in operative survival, morbidity associated with the TCPC operation remains significant. One small study in Children's Hospital of Wisconsin suggested that surgery during the autumn and winter season is associated with prolonged pleural effusion and hospitalization as a consequence of viral illnesses [7].
If a prolonged hospitalization and a higher morbidity during winter months are demonstrated in our UK population too, then it could be suggested that, given the elective nature of TCPC surgery, the operation should be scheduled in summer months. This could both improve patient outcomes and also release important resources during the winter months when medical services are strained by the higher number of admissions related to seasonal viral infections.
The aim of the present study was to investigate the hypothesis that operation during the period from 1 November to 31 March (NM) adversely affects morbidity and is associated with prolonged hospitalization in patients who undergo the TCPC procedure.
MATERIALS AND METHODS
Study design and data collection
We conducted a retrospective review of all consecutive patients (n = 104) who underwent the extracardiac TCPC at Great Ormond Street Hospital in London between June 2006 and November 2011. Patients who required early reoperations in the immediate postoperative period (n = 4), or patients transferred to other institution for continued postoperative care (n = 2) were excluded from analysis (Fig. 1).
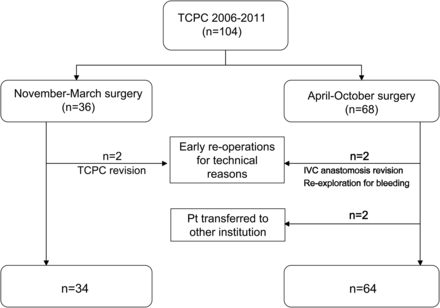
Patient (Pt) selection algorithm. IVC: inferior vena cava; TCPC: total cavopulmonary connection.
Data were collected from medical notes and electronic patient records in order to obtain specific detailed information about the preoperative, operative and postoperative variables on each patient. The calendar year was divided into two periods: the NM period, which represents the period with the highest respiratory syncytial virus activity in the UK; and the period between 1 April and 31 October (AO) when the viral activity is lower.
The variables selected as potential predictors of the outcome measures consisted of three main categories:
Preoperative and haemodynamic variables: patient demographic characteristics, including age, gender, height and weight at the time of the operation, and relevant clinical and haemodynamic characteristics, including dominant right versus left single-ventricle, preoperative oxygen saturation, Glenn pressure and echocardiographic and magnetic resonance imaging evaluation of ventricular function, degree of atrioventricular valve regurgitation (AVVR), presence of pulmonary artery branch stenosis, previous pulmonary artery band (PAB) and amount of systemic to pulmonary collateral flow (data available in 37 patients) [8]. Additionally both leucocyte count and the percentage of neutrophils from preoperative blood samples were recorded. No child had clinical or laboratory evidence of viral or bacterial illnesses in the 4 weeks before surgery.
Operative: presence of fenestration of the extracardiac conduit and time of year of operation (NM or AO period) as defined previously.
Postoperative: central venous pressure, presence or absence of postoperative infections (chest or wound infections requiring antibiotics or bacteraemia), chylothorax and other complications such as low cardiac output status and renal failure. Pleural fluid was defined as chylothorax when it contained >1.1 mmol/l triglycerides (with oral fat intake) and had a total cell count ≥1000 cells/μl, with a lymphocyte fraction >80%, as suggested by Buttiker et al. [9]. Low cardiac output was defined as the need for prolonged inotropic support, defined as catecholamine administration to maintain circulation for longer than 72 h postoperatively. Acute renal failure was defined as the need for renal replacement therapy.
All patients received a standard postoperative antibiotic cover for the first 24 h with Flucloxacillin and Amikacin, with the first dose given before skin incision. Subsequent antibiotic treatment depended on laboratory, radiological and clinical findings, and was established in consultation and agreement of the local microbiology clinical service.
The protocol for preoperative assessment before TCPC completion consisted in a cardiac magnetic resonance imaging scan performed under general anaesthetic with measurements of the internal jugular vein pressure. Patients in whom risk factors were identified on the magnetic resonance scan subsequently underwent standard cardiac catheterization for a formal haemodynamic assessment in order to confirm suitability for TCPC completion.
Outcome measures
The main outcomes of interest were duration of pleural drainage after the TCPC procedure and length of postoperative hospital stay (LOS).
The duration of pleural drainage was measured from the date of the operation to the final removal of the chest tube performed during initial admission. Hospital LOS was defined as total number of days from the time of admission to cardiac theatre for the operation until discharge from hospital. Both variables were collected in hours and transformed into days by dividing the number of hours by 24.
Operative procedure for completion of extracardiac total cavopulmonary connection
Our standard manoeuvre has been to establish TCPC consisting of expanded polytetrafluoroethylene tubing (Gore-Tex, WL Gore & Associates, Flagstaff, AZ, USA) with cardiopulmonary bypass. Aortobicaval cardiopulmonary bypass with moderate hypothermia (32–34°C) was used on the beating heart. Cardioplegic arrest was used for short periods if intracardiac repair or unusual rerouting for patients with a separated hepatic vein was needed. Most procedures were performed without cross-clamping, and blood cardioplegia was used when required. Conduit diameter was based on patient weight, morphological relationships and inferior vena cava (IVC) diameter. The clamp was applied to the atrium–IVC junction, and the latter was transected with the intention to preserve a sizable atrial cuff at the IVC stump to allow a longer anastomosis and potential for growth. Conduit-to-IVC anastomosis was completed with running sutures of 5-0 or 6-0 Prolene (Ethicon, Somerville, NJ, USA). The inferior pulmonary artery wall was opened longitudinally and extended to the level of the main pulmonary artery on one side and the take-off of the right lower lobe pulmonary artery on the other. The pulmonary artery end of the conduit was bevelled with the medial end longer and the pulmonary conduit anastomosis was completed with a 6-0 Prolene running suture. All patients underwent modified ultrafiltration. In patients in whom TCPC pressure appeared elevated after modified ultrafiltration, a fenestration was created in the form of a side-to-side anastomosis between the conduit and the atrial wall using a 4-mm aortic puncher.
Statistical analysis
Categorical variables were expressed as numbers and percentages. Continuous variables were expressed as a mean with standard deviation or median (interquartile range) depending on the distribution. A χ2 test was used to detect differences between categorical variables and an unpaired t-test or Mann–Whitney U-test was used for continuous data depending on data distribution.
The Z score of weight-for-age at the time of Fontan operation was calculated based on 1990 reference data [10].
Analysis of the risk factors for prolonged hospital stay was performed using univariate and multivariable analyses. Multiple linear regression was used to identify independent predictors of LOS. As length of stay appeared to have a skewed distribution, log-transformation was used before its use in multiple linear regression. Variables with a P < 0.1 at univariate analysis were entered into the multivariable analysis. Kaplan–Meier curves were generated to compare the freedom from hospital discharge and time to chest drain removal in patients who had surgery in the winter versus summer period. A log-rank test was used to compare differences in Kaplan–Meier curves between the NM and the AO periods. Hazard ratios with their respective 95% confidence intervals (CIs) were calculated using Cox regression. Statistical significance was accepted as P < 0.05. All statistical analyses were performed with Stata 13 for Macintosh statistical software.
RESULTS
Patient inclusion
A total of 104 patients underwent a TCPC procedure at Great Ormond Street Hospital between June 2006 and November 2011 (Fig. 1). Six patients were excluded from the analysis. Of these, 3 needed early surgical revision of the TCPC pathway for technical issues or conduit thrombosis, and 1 required re-exploration for bleeding. A further 2 patients completed their postoperative care at some other hospital and were therefore excluded because their outcome in terms of length of stay and chest drainage duration could not be assessed. Of the 98 remaining patients, 34 (34.7%) had their operation in the NM period. The rate of survival to hospital discharge after the Fontan operation was 100%. A 16-mm-diameter conduit was used in 9 patients, an 18-mm conduit in 63, a 20-mm conduit in 24 and a 22-mm conduit in 2. Cardiopulmonary bypass time was 74.5 ± 35.3 min.
Anatomical diagnosis of the patients is shown in Table 1. The most common diagnosis was HLHS, which was present in 27 children (27%).
Anatomical diagnoses
| Diagnosis | Number of patients |
|---|---|
| Hypoplastic left heart syndrome | 27 |
| Complex double outlet right ventricle | 19 |
| Tricuspid atresia | 23 |
| Double inlet left ventricle | 15 |
| Pulmonary atresia | 6 |
| Unbalanced atrioventricular septal defect | 5 |
| Congenitally corrected transposition of the great arteries with added abnormalities | 3 |
Additional procedures were performed at the time of Fontan operation in 33 patients. The type and frequency of these procedures are summarized in Table 2.
Concomitant procedures performed at the time of total cavopulmonary connection
| Concomitant procedure (n = 34) | Number of patients |
|---|---|
| Main pulmonary artery division | 15 |
| Left superior vena cava ligation | 4 |
| Pulmonary artery augmentation | 3 |
| Atrial septectomy | 3 |
| Atrioventricular valve repair | 2 |
| Blalock–Taussig shunt closure | 2 |
| Aortic arch repair | 2 |
| Permanent pacemaker insertion | 1 |
| Right pulmonary vein division | 1 |
| Closure of atrial defects | 1 |
Comparison of patient and haemodynamic characteristics and timing of the Fontan operation
Table 3 shows demographic and haemodynamic characteristics for all patients when segregated according to the season of TCPC surgery (NM versus AO). No differences were found between the two groups in relation to male gender, weight at TCPC, presence of fenestration or PAB. Even though not statistically different, there was a higher prevalence of RV morphology in children who had surgery in the NM group. There was also a higher number of leucocytes and a higher proportion of neutrophils in the preoperative blood laboratory results of children who had surgery in the NM period, even though this was not statistically significant. The age at Fontan operation was also similar (4.4 ± 2.0 vs 5.1 ± 2.8 years, P = 0.214). The mean weight of patients at TCPC procedure in the NM period was 17.0 ± 6.3 vs 19.0 ± 8.7 kg (P = 0.202) for those who had surgery in the AO period. There was also no significant difference between the Glenn pressure, preoperative oxygen saturation, preoperative ventricular function and degree of AVVR or pulmonary artery branch stenoses between the two groups. The amount of systemic to pulmonary artery collateral blood flow was similar in the two groups (P = 0.130), as was weight-for-age Z score (P = 0.567).
Patient characteristics of the winter and summer surgery groups
| November–March surgery (n = 34) | April–October surgery (n = 64) | P | |
|---|---|---|---|
| Male gender, n (%) | 20 (59) | 35 (55) | 0.831 |
| Age at TCPC (years) | 4.4 ± 2.0 | 5.1 ± 2.8 | 0.214 |
| Weight at TCPC (kg) | 17.0 ± 6.3 | 19.0 ± 8.7 | 0.202 |
| Weight-for-age Z score | −0.44 ± 1.28 | −0.20 ± 2.19 | 0.567 |
| Height at TCPC (cm) | 102 ± 15 | 106 ± 18 | 0.169 |
| Body mass index | 16.1 ± 2.2 | 16.2 ± 3.2 | 0.717 |
| Right ventricular morphology, n (%) | 20 (59) | 29 (45) | 0.288 |
| Heterotaxy, n (%) | 2 (6) | 7 (11) | 0.490 |
| Hypoplastic left heart syndrome, n (%) | 11 (32) | 15 (23) | 0.348 |
| Fenestration present, n (%) | 14 (41) | 19 (30) | 0.269 |
| Previous pulmonary artery band, n (%) | 8 (23) | 16 (25) | 0.988 |
| Superior vena cava (mmHg) | 12.2 ± 2.6 | 12.0 ± 3.1 | 0.779 |
| Pre-TCPC O2 saturation (%) | 81 ± 7 | 81 ± 7 | 0.694 |
| Ventricular function, n (%) | |||
| Normal | 19 (56) | 45 (70) | 0.159 |
| Mildly impaired | 11 (32) | 17 (27) | |
| Moderately impaired | 4 (12) | 2 (3) | |
| Atrioventricular valve regurgitation, n (%) | |||
| No | 8 (23) | 21 (33) | 0.351 |
| Mild | 19 (56) | 36 (56) | |
| Moderate | 7 (21) | 7 (11) | |
| Pulmonary artery branch stenosis, n (%) | 8 (24) | 12 (19) | 0.605 |
| Systemic to pulmonary collateral flow (%) | 28.5 ± 7.4 | 23.3 ± 10.4 | 0.130 |
| Leucocyte count, n | 8600 (6910–9610) | 7445 (5985–9395) | 0.152 |
| Neutrophils as % of leucocytes | 60.7 (50.4–64.8) | 54.9 (45.9–61.7) | 0.066 |
| Cardiopulmonary bypass time (min) | 79 ± 28 | 72 ± 38 | 0.350 |
HLHS: hypoplastic left heart syndrome; TCPC: total cavopulmonary connection.
Risk factors for prolonged hospital stay
On multivariable analysis, surgery in the NM period (P = 0.045) was the only factor associated with prolonged hospital LOS when adjusted for age at surgery, ventricular morphology, gender, weight at surgery, preoperative oxygen saturation, jugular venous pressure, presence of pulmonary artery branch stenoses, degree of AV valve regurgitation, ventricular function, preoperative PAB and presence of fenestration (Table 4).
Multivariate analysis of risk factors for prolonged postoperative length of stay following the Fontan operation
| Univariate analysis | β | 95% confidence intervals | P |
|---|---|---|---|
| Male gender | 0.256 | 0.040 to 0.472 | 0.020 |
| Age at surgery | 0.000 | 0.000 to 0.000 | 0.626 |
| November–March surgery | 0.241 | 0.156 to 0.467 | 0.036 |
| Weight at surgery | −0.003 | −0.017 to 0.010 | 0.659 |
| Right ventricular morphology | 0.233 | 0.018 to 0.449 | 0.034 |
| Oxygen arterial saturation before TCPC | −0.001 | −0.017 to 0.015 | 0.890 |
| Superior vena cava pressure | 0.005 | −0.032 to 0.043 | 0.775 |
| Pulmonary artery branch stenosis | 0.049 | −0.225 to 0.324 | 0.721 |
| Degree of atrioventricular valve regurgitation | 0.114 | −0.054 to 0.284 | 0.181 |
| Ventricular function | −0.033 | −0.206 to 0.140 | 0.706 |
| Preoperative pulmonary artery banding | −0.171 | −0.426 to 0.084 | 0.186 |
| Fenestration present | −0.000 | −0.234 to 0.233 | 0.998 |
| Hypoplastic left heart syndrome | 0.164 | −0.084 to 0.413 | 0.192 |
| Weight-for-age Z score | −0.008 | −0.065 to 0.050 | 0.793 |
| Multivariable analysis | |||
| November–March surgery | 0.229 | 0.005 to 0.453 | 0.045 |
| Male gender | 0.213 | −0.002 to 0.428 | 0.053 |
| Right ventricular morphology | 0.185 | −0.029 to 0.400 | 0.090 |
TCPC: total cavopulmonary connection.
Impact of season on length of hospital stay and chest drain
Overall LOS was 12 days (9–17) and duration of chest drainage was 9 days (6–13). Patients in the NM period surgery group had a median LOS over 2 days longer than patients in the AO period (13.5 [10.0–20.2] vs 11.1 [9.0–14.7] days, P = 0.050). The Kaplan–Meier graph in Fig. 2 showing freedom from hospital discharge demonstrates that the hospital discharge rate is similar until approximately 20 days after surgery, after which the difference between the two groups appears, with a subgroup of patients in the NM surgery group requiring prolonged LOS in comparison with patients who had their surgery in the AO period.
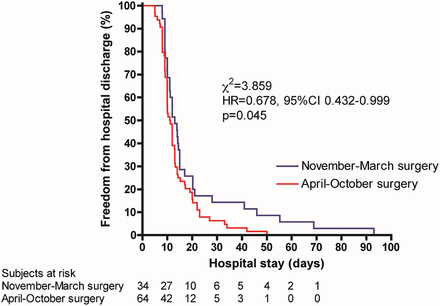
Kaplan–Meier curve of freedom from hospital discharge for patients whose surgery was performed in the November–March or in the April–October period. HR: hazard ratio; 95% CI: 95% confidence interval.
Importantly, a longer length of chest drainage was not significantly related to surgery in the NM period (11 days [7–14] vs 9 days [6–12], P = 0.064). The Kaplan–Meier curve in Fig. 3 was generated to depict the fact that the % freedom from chest drainage was similar between the AO period and the NM period surgery groups (hazard ratio 1.395, 95% CI 0.950–2.256, P = 0.083).
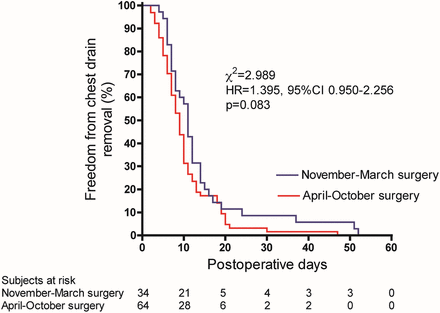
Kaplan–Meier curve of freedom from chest drain for patients whose surgery was performed in the November–March or in the April–October period. HR: hazard ratio; 95% CI: 95% confidence interval.
Surgery in the NM period was also associated with a higher rate of morbidity in terms of postoperative complications such as chest or wound infections requiring antibiotics (22 [64.7%] vs 21 [32.8%] children, P = 0.003), postoperative low cardiac output status including anuria and renal failure (9 [26.5%] vs 6 [9.4%] children, P = 0.038). No significant association was found in relation to chylothorax and timing of surgery (11 [32.4%] vs 14 [21.9%] children, P = 0.331).
DISCUSSION
In our study, TCPC surgery during the NM period was the only factor associated with prolonged LOS.
The finding that LOS can be affected by the season in which TCPC operation is performed is not completely new. Indeed, a previous study showed a higher LOS in winter months in North America. The authors suggested that viral infections which can complicate the postoperative course might be responsible for this observation. In agreement with their observation, the increased LOS associated with the TCPC completion that we observed in the months between November and March coincides with the increased incidence of clinical or subclinical viral respiratory infections in western countries [11] including the UK [12].
Winter season is associated with a higher incidence of respiratory illnesses, especially with respiratory syncytial virus [11]. The morbidity caused by this and other viral respiratory infections in children with heart defects correlates with the severity of the underlying cardiac disease as measured by the degree of compromise of the baseline cardiorespiratory status, pulmonary mechanics, degree of cyanosis, level of pulmonary hypertension and extent of ventilation/perfusion mismatch [13, 14]. This is especially important in patients with single-ventricle physiology awaiting TCPC operation. Children undergoing TCPC surgery during the viral respiratory season suffer greater postoperative complications, especially a postoperative increase in pulmonary vascular resistance [15, 16]. Fedderly et al. postulated that clinical or sub-clinical respiratory infection might alter the delicate balance required for adequate flow through the TCPC circulation in the early postoperative period. This could raise the transpulmonary gradient, increase the central venous pressure, and result in prolonged pleural effusions and increased LOS [7].
A further study by Nicolas et al. identified that completion of the TCPC procedure during the viral respiratory season is associated with increased mortality. However, Glenn shunt patients who have surgery during the same period did not experience a higher mortality rate in winter months [17]. This may be because patients with TCPC are less effective at maintaining cardiac output in the face of elevated pulmonary vascular resistance [17].
Our study also highlights that surgery in the NM period is associated with a higher incidence of postoperative respiratory and bacterial infections and complications such as postoperative low cardiac output, anuria and renal failure. This finding is consistent with other studies that demonstrated that children who present for cardiac surgery during the respiratory viral season or with active respiratory tract infections are at an increased risk of respiratory complications and other multiple complications and an extended stay in the intensive care unit [15, 16]. The explanation may be related to the existence of some degree of immuno-compromise of the children with viral respiratory infections on top of transient ciliary dysfunction [15], which places these children at higher risk for postoperative bacterial infection. On the other hand, complications and prolonged hospital stay are associated with higher risk of hospital acquired nosocomial infection [18]. The causes of postoperative low cardiac output state after TCPC completion can be many. One of the causes of postoperative low cardiac output in this setting, particularly in patients who have not received a fenestration, could be the development of increased pulmonary vascular resistance as mentioned previously.
We also found that right ventricular morphology was associated with a prolonged LOS after TCPC surgery on univariate analysis. An association between ventricular morphology and postoperative outcome has been previously reported [3]. In terms of physiology, the morphological right ventricle is well suited for acute changes in preload that normally occur with changes in intrathoracic pressure and systemic venous return but it is much less tolerant of increased afterload than the left ventricle [19]. The systemic right ventricle hypertrophic response to systemic pressure loading can lead to fibrosis and scarring with consequent reduction of systolic function but also impaired diastolic function. In turn, several groups have reported that patients with a dominant right ventricle may be at increased risk for post-TCPC complications, adverse short-term outcome and early failure [11, 20–22].
In addition, although mortality for TCPC completion in HLHS, a subset of hearts with underlying right ventricular morphology, has dramatically improved, this underlying anatomical diagnosis still remains a risk factor for morbidity, specifically for prolonged pleural effusion and prolonged hospitalization [3, 6, 23]. This may be a consequence of coronary and myocardial abnormalities, myocardial damage related to the first stage of Norwood palliation, or increased afterload related to aortic stiffness or residual arch obstruction [24]. The presence of a tricuspid valve as the systemic atrioventricular valve was identified as a risk factor for early failure as described by Gentles et al. [24]. The tricuspid valve with attachments to both the septum and the free wall appears more prone to insufficiency as a consequence of ventricular dilatation. HLHS was the most common diagnosis with this atrioventricular valve morphology [24]. Importantly, even though HLHS represented the most common diagnosis in our patient population, we could not observe any relationship between HLHS diagnosis and prolonged LOS.
A fairly large number of children in our cohort had two relatively well-formed ventricles. Recent evidence suggests that children with a larger size of the secondary ventricle who have received a Fontan operation have better exercise capacity than children with no or small secondary ventricle as there is a greater contribution of the secondary ventricle to stroke volume [25]. Even though one could reasonably expect a better outcome in children with two ventricles, we could not demonstrate any difference in the prevalence of children with two relatively well-formed ventricles in the NM surgery group (13 children or 38%) versus the AO surgery group (14 children or 22%, P = 0.100).
Several studies like Gentles et al. [24] and Gupta et al. [23] have evaluated the contribution of preoperative and intraoperative factors to post-TCPC pleural effusions and LOS. These have most recently included the amount of systemic to pulmonary artery collateral flow and the weight-for-age Z score. In our dataset, LOS and length of pleural drainage were not associated with the established (age, Glenn pressure, presence of pulmonary artery branch stenoses, degree of AVVR, decreased ventricular function, preoperative pulmonary artery banding and whether fenestration was present or absent) and more recently identified TCPC risk factors. This is probably the result of a standardized approach to the TCPC operation in terms of age at surgery and patient selection for the procedure.
STRENGTHS AND LIMITATIONS
Our study focused on patients who underwent the extracardiac TCPC procedure with the advantage of making the cohort as homogeneous as possible. Furthermore, the patients included in the study underwent surgical intervention over a relatively short period of calendar time (5 years). This yielded more uniformity in the management of preoperative and postoperative care.
On the other hand, our study was retrospective and originated from a single centre, with the biases inherent in this type of design. Our analysis was therefore restricted to data recorded in patient notes and can only show associations for prolonged LOS and not causality. Also, because the study was focused on the early postoperative outcome alone, the correlation of these risk factors to intermediate and long-term outcomes remains to be established.
Additional factors that we could not account for could have also contributed to the observed difference in LOS; in particular, relocation of allied healthcare staff within the hospital as might be required to handle increased pressure from patients presenting with seasonal illnesses.
CONCLUSION
Our experience revealed that performance of the TCPC surgery in the NM period is associated with longer LOS. We speculate that scheduling the TCPC surgery during the months from April to October could relieve pressure on a busy service with better utilization of health resources and may reduce the cost and expenses associated with increased LOS in the NM period. Therefore, the recognition of relevant risk factors might have important implications for future improvements in patient care from a safety, clinical and economic perspective after the TCPC procedure. A prospective study that includes a screen for clinical or subclinical viral infections during the pre-TCPC evaluation may be warranted to more fully define these preliminary findings.
Conflict of interest: None declared.
