


Abstract
To evaluate performance of the European System for Cardiac Operation Risk Evaluation (EuroSCORE II), to assess the influence of model updating and to derive a hierarchical tree for modelling the relationship between EuroSCORE II risk factors and hospital mortality after cardiac surgery in a large prospective contemporary cohort of consecutive adult patients.
Data on consecutive patients, who underwent on-pump cardiac surgery or off-pump coronary artery bypass graft intervention, were retrieved from Puglia Adult Cardiac Surgery Registry. Discrimination, calibration, re-estimation of EuroSCORE II coefficients and hierarchical tree analysis of risk factors were assessed.
Out 6293 procedures, 6191 (98.4%) had complete data for EuroSCORE II assessment with a hospital mortality rate of 4.85% and EuroSCORE II of 4.40 ± 7.04%. The area under the receiver operator characteristic curve (0.830) showed good discriminative ability of EuroSCORE II in distinguishing patients who died and those who survived. Calibration of EuroSCORE II was preserved with lower predicted than observed risk in the highest EuroSCORE II deciles. At logistic regression analysis, the complete revision of the model had most of re-estimated regression coefficients not statistically different from those in the original EuroSCORE II model. When missing values were replaced with the mean EuroSCORE II value according to urgency and weight of intervention, the risk score confirmed discrimination and calibration obtained over the entire sample. A recursive tree-building algorithm of EuroSCORE II variables identified three large groups (55.1, 17.1 and 18.1% of procedures) with low-to-moderate risk (observed mortality of 1.5, 3.2 and 6.4%) and two groups (3.8 and 5.9% of procedures) at high risk (mortality of 14.6 and 32.2%). Patients with low-to-moderate risk had good agreement between observed events and predicted frequencies by EuroSCORE II, whereas those at greater risk showed an underestimation of expected mortality.
This study demonstrates that EuroSCORE II is a good predictor of hospital mortality after cardiac surgery in an external validation cohort of contemporary patients from a multicentre prospective regional registry. The EuroSCORE II predicts hospital mortality with a slight underestimation in high-risk patients that should be further and better evaluated. The EuroSCORE II variables as a risk tree provides clinicians and surgeons a practical bedside tool for mortality risk stratification of patients at low, intermediate and high risk for hospital mortality after cardiac surgery.
INTRODUCTION
The European System for Cardiac Operation Risk Evaluation (EuroSCORE) is one of the possible tools to assess the operative mortality risk [1–3]. The first EuroSCORE, initially based on an additive system derived by a logistic regression model, was developed on data collected in 1995 and reported in 1999 to predict in-hospital or 30-day mortality [1, 2]. Recently, in order to improve the poor calibration and to optimize EuroSCORE usefulness, an updated version of this model has been proposed for the assessment of cardiac surgical risk [3]. The new score, named EuroSCORE II, was better calibrated than the original model in detecting hospital mortality preserving high discrimination [3]. Risk evaluation with EuroSCORE systems was developed as a logistic regression model for short-term mortality, which is a dichotomous outcome. A logistic model may be used to provide predictions of events for individual patients at a centre different from where the model was developed [4]. The validity of predictions can be assessed by simple comparison between observed outcomes and predicted probabilities. To date, several studies have evaluated performance of EuroSCORE II in patients who had undergone major cardiac surgery [5–11], isolated coronary artery bypass graft (CABG) [12, 13], valve surgery [14, 15], emergency or high-risk cardiac surgery [16, 17]. Most of these studies were retrospective [6, 8–10, 12–17]. External validity of a model prediction is important to test the generalizability of a prediction rule over time in future patients [18]. Differences in population characteristics may affect the predictive accuracy of a scoring system and the validation process requires evaluation of the predictive model according to local circumstances. The external validity may be assessed considering the model performance as simple discrimination (concordance between predicted probabilities and outcome) and calibration (agreement between predicted and observed frequencies) or, to improve predictions, as recalibration (re-estimation of the intercept or slope of the linear predictor) and model revision (re-estimation of regression coefficients). Moreover, hierarchical trees approach allows non-parametric modelling of the relationship of several risk factors and mortality by selecting subgroups that are internally as homogeneous as possible with respect to the outcome and externally as separated as possible. No study has evaluated the EuroSCORE II risk factors by a recursive tree-building algorithm. The aim of this study was, in a large prospective cohort of consecutive adult patients who had undergone major cardiac surgery, to evaluate the performance of EuroSCORE II, to assess its calibration, to re-estimate logistic equation in comparison with the original model and to derive a risk tree to partition patients into categories of low-, intermediate- and high-risk of hospital mortality.
MATERIALS AND METHODS
Study population
Consecutive adult patients who had undergone on-pump cardiac surgery or off-pump CABG in Puglia region from 1 January 2011 to 31 December 2012 were considered. Pre-, intra- and postoperative information were gathered from Puglia Regional Adult Cardiac Surgery Registry, which involves the seven adult cardiac surgery centres in Puglia: University of Bari, Policlinico Hospital (Coordinating Centre), Anthea Hospital in Bari, Santa Maria Hospital in Bari, Villa Bianca Hospital in Bari, Villa Verde Hospital in Taranto, Vito Fazzi Hospital in Lecce and Città di Lecce Hospital in Lecce. Health regional agency personnel guaranteed data accuracy and quality control procedures. All cases performed in each centre were checked from operating theatre documents, ensuring that all patients who had undergone heart operations were in the registry. Cleaning consisted of minimizing the amount of missing data through interactions with hospitals and auditing consisted of inspection of data in hospital medical records.
European System for Cardiac Operation Risk Evaluation II
All risk factors included in EuroSCORE II were available in the registry: patient's age, gender, creatinine clearance, extracardiac arteriopathy, poor mobility secondary to musculoskeletal or neurological dysfunction, previous cardiac surgery, chronic lung disease, active endocarditis, critical preoperative state, diabetes on insulin, New York Heart Association (NYHA) functional classification, Canadian Cardiovascular Society (CCS) grade IV of angina, left ventricular ejection fraction, recent myocardial infarction, systolic pulmonary artery pressure, urgency of operation, weight of the intervention and surgery on thoracic aorta [3]. EuroSCORE II was derived for all patients based on the original equation described by Nashef et al. [3]. Hospital mortality was considered as death occurring at any time after surgery during the period in hospital in which the operation was performed.
Ethical considerations
The Adult Cardiac Surgery Registry is an initiative of the Health Regional Agency of Puglia with the aim to evaluate the postoperative outcome of patients receiving major cardiac surgery in the region. According to institutional review board policy, it was determined that research does not require informed consent. Data were collected and stored in an anonymous fashion with the patients only identified by their medical record number.
Statistical analysis
provided the EuroSCORE II assessment of the risk for hospital mortality [3]. We fitted a logistic regression model for in-hospital mortality with the intercept as the only free parameter and the linear predictor based on the PI as an offset variable (i.e. the slope was fixed at unity) and a model incorporating the linear predictor PI as the only covariable (update of both the intercept and the overall calibration slope). The intercept, which should be zero, indicated if the predictions were systematically lower or higher than mortality and the calibration slope, which should be 1, indicated the relation between EuroSCORE II linear predictor and mortality. Moreover, each risk factor of EuroSCORE II was introduced into a logistic regression model with re-estimation of all coefficients. We compared re-estimated coefficients with those in the original model considering the statistic that follows a normal distribution under the hypothesis of equality of the two coefficients, calculated as difference between coefficients divided by its standard error (SE). Considering the independence of the two samples, the SE of the difference between coefficients was calculated as the square root of the sum of the two squared SEs. A Cox-Snell graph was used to assess observed vs predicted cumulative hazard and the Hosmer–Lemeshow statistic to evaluate calibration [19]. Observed/expected (O/E) ratio of mortality was calculated: a value >1 indicates that the model underestimated mortality, whereas a value <1 means that the model overestimated mortality. If the 95% confidence interval (CI) of the O/E ratio excluded the value 1.0, it was considered statistically significant. The area under the receiver operator characteristic (ROC) curves (AUC) was calculated as a measure of discriminative ability. To evaluate the influence of patients without EuroSCORE II over discrimination and calibration, risk prediction of procedures with one or more missing risk factors was replaced with an EuroSCORE II mean value according to weight and urgency of intervention. To derive a hierarchical tree of mortality risk on the basis of EuroSCORE II variables, χ2 test was used to split the data recursively into subgroups. As a stopping rule for the tree-building process, we used a minimum P-value of >0.05 or the number of patients in a subgroup <100 or subgroup mortality ≤1.5%. Age was analysed in the range 60–80 years, selecting the cut-point corresponding to the minimum P-value. The analyses were made using the STATA software, version 12 (StataCorp, College Station, TX, USA). A P-value of <0.05 was considered statistically significant.
RESULTS
Baseline characteristics and outcomes
During the study period, 6293 procedures were performed. Demographics, comorbidity and types of procedure are given in Table 1. In comparison with the EuroSCORE II cohort, patients were slightly older with lower creatinine clearance, more frequently females and diabetic with lower prevalence of active endocarditis. A higher proportion of procedures was elective with a lower percentage of urgent surgery. The proportion of isolated CABG was lower than the EuroSCORE II cohort, whereas greater percentages of valve surgery, thoracic aortic surgery and other major heart procedure were reported. The percentages of aortic, mitral and tricuspid valve repair were higher in the study population than in EuroSCORE II. Other major heart procedure included isolated or combined procedures: atrial septal defect closure in 1.8%, correction of ventricular septal defect in 0.8%, ablation of atrial fibrillation in 1.8%, congenital defects in 1.7%, left ventricular aneurysm repair in 0.8% and other cardiac surgeries in 2.3% (cardiac tumour resections, cardiac transplantations, surgery for cardiac trauma). EuroSCORE II was available for 6191 (98.4%) procedures: risk factors are given in Table 2. During the hospital period in which the operation was performed 300 patients died (4.85%). The expected mortality estimated by EuroSCORE II was 4.40 ± 7.04%.
Demographics, comorbidity and types of procedure in the study population and in the EuroSCORE II cohort.
| Study population | EuroSCORE II (3) | |
|---|---|---|
| n = 6293 | n = 22 381 | |
| Age (years) | 67.3 ± 11.2 | 64.6 ± 12.5 |
| Female gender | 34.1% | 30.9% |
| Body mass index (kg/m2) | 27.5 ± 4.4 | 27.4 ± 4.8 |
| Creatinine clearance (ml/min) | 76.3 ± 31.5 | 83.6 ± 50.9 |
| On dialysis | 1.4% | 1.1% |
| Neurological dysfunction | 3.5% | 3.2% |
| Critical preoperative state | 3.8% | 4.1% |
| Active endocarditis | 1.5% | 2.2% |
| Diabetes on insulin | 10.0% | 7.6% |
| Urgency | ||
| Elective | 80.7% | 76.7% |
| Urgent | 15.1% | 18.5% |
| Emergency | 3.9% | 4.3% |
| Salvage | 0.3% | 0.5% |
| CABG (isolated) | 42.0% | 46.7% |
| Valve procedures | 50.5% | 46.3% |
| Aortic valve repair | 3.2% | 1.2% |
| Aortic valve replacement | 30.0% | 30.2% |
| Mitral valve repair | 13.6% | 8.7% |
| Mitral valve replacement | 8.8% | 9.2% |
| Tricuspid valve repair | 5.8% | 4.6% |
| Tricuspid valve replacement | 0.3% | 0.4% |
| Thoracic aortic surgery | 14.7% | 7.3% |
| Ascending aortic replacement | 14.3% | 4.9% |
| Root replacement with coronary reimplantation | 3.7% | 2.2% |
| Aortic arch replacement | 1.6% | 0.8% |
| Descending aortic replacement | 0.1% | 0.2% |
| Other major heart procedure | 7.7% | 0.6% |
Data of EuroSCORE II based on the original study cohort [3].
Mean values ± standard deviation.
Risk factors for patients in which the EuroSCORE II was evaluable
| n = 6191 | |
|---|---|
| Age (years) | 67.4 ± 11.2 |
| Female gender | 34.1% |
| Renal impairment | |
| Creatinine clearance >85 ml/min | 34.5% |
| Creatinine clearance 50–85 ml/min | 46.7% |
| Creatinine clearance <50 ml/min | 17.4% |
| On dialysis | 1.4% |
| Extracardiac arteriopathy | 12.2% |
| Neurological dysfunction affecting mobility | 0.3% |
| Previous cardiac surgery | 5.2% |
| Bronchodilators or steroids for lung disease | 9.2% |
| Active endocarditis | 1.5% |
| Critical preoperative state | 3.7% |
| Diabetes, on insulin | 10.0% |
| NYHA class | |
| I | 25.2% |
| II | 37.1% |
| III | 34.8% |
| IV | 2.8% |
| CCS grade 4 | 5.6% |
| Left ventricular ejection fraction | |
| >50% | 56.4% |
| 31–50% | 38.2% |
| 21–30% | 4.7% |
| ≤20% | 0.7% |
| Recent myocardial infarction within 90 days | 16.8% |
| Systolic pulmonary artery pressure | |
| ≤30 mmHg | 81.8% |
| 31–55 mmHg | 13.5% |
| >55 mmHg | 4.7% |
| Urgency | |
| Elective | 80.6% |
| Urgent | 15.2% |
| Emergency | 3.9% |
| Salvage | 0.3% |
| Surgery of the thoracic aorta | 14.5% |
| Weight of the intervention | |
| Isolated CABG | 42.1% |
| 1 non-CABG | 25.8% |
| 2 procedures | 22.0% |
| 3 procedures | 10.1% |
Mean values ± standard deviation.
Performance of EuroSCORE II
The overall discriminative ability of EuroSCORE II in distinguishing patients who died and those who survived, quantified by the AUC of the ROC curve, was 0.830 (95% CI: 0.806–0.853). Figure 1 shows observed and EuroSCORE II expected mortality rates according to deciles of EuroSCORE II predicted risk. The Hosmer–Lemeshow test was χ2 = 14.81 with P = 0.063 and the expected/observed ratio 1.10 (0.98–1.22) was not significant. In comparison with predicted risk, the observed mortality was lower in the first three deciles (predicted risk rate is <1.36%), similar from the fourth up to the eighth and greater in the two highest deciles (predicted risk >5.60%). Figure 2 shows the Cox-Snell graph with observed vs predicted cumulative hazards. The cumulative observed mortality was lower than predicted for low-risk patients, similar up to 3% of the predicted risk and higher thereafter.
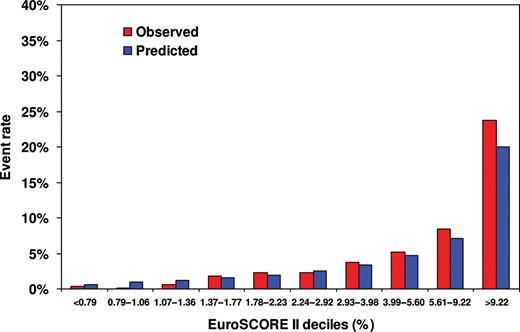
Calibration of EuroSCORE II with observed and predicted mortalities within each decile of predicted risk.
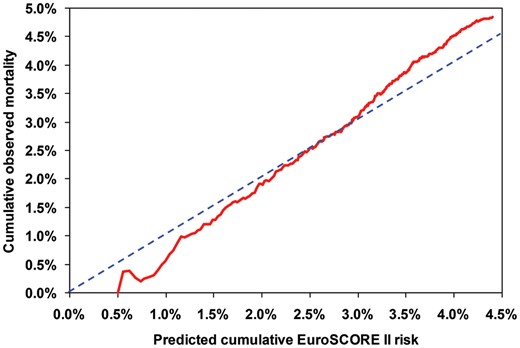
Cox-Snell graph of observed (continuous line) vs predicted (dashed line) cumulative risks of hospital mortality.
Recalibration assessment
The logistic model incorporating EuroSCORE II linear predictor as the offset variable had intercept not significantly different from zero (model constant 0.114; P = 0.070). The recalibrated model incorporating EuroSCORE II linear predictor had coefficient not significantly different from the unity (recalibration slope 1.084; P = 0.116). Each EuroSCORE II risk factor was significanlty associated by univariate analysis to hospital mortality (data not given). Table 3 shows logistic multivariate analysis of EuroSCORE II risk factors for hospital mortality. The dicriminative ability of the recalculated model was slightly greater than original EuroSCORE II with preserved calibration: the AUC of the ROC curve was 0.851 (95% CI: 0.828–0.873) and the Hosmer–Lemeshow test was not significant (χ2 = 5.45 with P = 0.709). Recalculated coefficients were compared with those derived in the original EuroSCORE II: most of re-estimated coefficients were not statistically different from those used to calculate EuroSCORE II. Age, urgent and emergency operation had significantly greater coefficients in comparison with the original prediction model. Only creatinine clearance ≤50 ml/min showed a significantly lower coefficient. Table 4 shows observed mortality, EuroSCORE II expected mortality, O/E ratio, AUC of ROC curve and the recalibration slope of EuroSCORE II according to urgency of operation and different types of cardiac surgery. Non-elective procedures were associated to significant greater mortality than those predicted. The risk in subgroups of urgent and emergency operations was significantly underestimated, whereas elective procedures did not show deviation between expected and observed mortality rates. Discrimination was very high with the AUC of the ROC curve ranging between 0.773 and 0.903, with good calibration in each subgroup of cardiac surgery considered.
Multivariate logistic regression of EuroSCORE II risk factors
| Coefficient ± SE | P-valuea | |
|---|---|---|
| Age (years) | 0.056 ± 0.011 | 0.030 |
| Female gender | 0.458 ± 0.142 | 0.162 |
| Renal impairment | ||
| Creatinine clearance 50–85 ml/min | −0.116 ± 0.192 | 0.066 |
| Creatinine clearance <50 ml/min | 0.277 ± 0.220 | 0.027 |
| On dialysis | 1.518 ± 0.366 | 0.067 |
| Extracardiac arteriopathy | 0.403 ± 0.180 | 0.531 |
| Neurological dysfunction affecting mobility | 1.028 ± 0.797 | 0.334 |
| Previous cardiac surgery | 1.159 ± 0.206 | 0.865 |
| Bronchodilators or steroids for lung disease | 0.416 ± 0.200 | 0.333 |
| Active endocarditis | 1.354 ± 0.337 | 0.063 |
| Critical preoperative state | 0.587 ± 0.215 | 0.055 |
| Diabetes, on insulin | 0.564 ± 0.188 | 0.379 |
| NYHA class | ||
| II | 0.190 ± 0.230 | 0.762 |
| III | 0.775 ± 0.228 | 0.074 |
| IV | 1.115 ± 0.311 | 0.117 |
| CCS grade 4 | −0.007 ± 0.253 | 0.432 |
| Left ventricular ejection fraction | ||
| 31–50% | 0.099 ± 0.147 | 0.231 |
| 21–30% | 0.563 ± 0.246 | 0.394 |
| ≤20% | 0.101 ± 0.568 | 0.192 |
| Recent myocardial infarction within 90 days | 0.473 ± 0.194 | 0.177 |
| Systolic pulmonary artery pressure | ||
| 31–55 mmHg | 0.106 ± 0.195 | 0.754 |
| >55 mmHg | 0.682 ± 0.221 | 0.230 |
| Urgency | ||
| Urgent | 0.984 ± 0.178 | 0.002 |
| Emergency | 1.910 ± 0.247 | 0.000 |
| Salvage | 2.428 ± 0.610 | 0.127 |
| Surgery of the thoracic aorta | 0.291 ± 0.214 | 0.240 |
| Weight of the intervention | ||
| 1 non-CABG | 0.181 ± 0.24 | 0.534 |
| 2 procedures | 0.648 ± 0.212 | 0.698 |
| 3 procedures | 1.006 ± 0.259 | 0.909 |
| Constant | −5.857 ± 0.284 | 0.107 |
Coefficients ± SE.
aThe P-values refer to the comparison of re-estimated coefficients with those in the original model. Age analysed as in the original model: values of 1 up to 60 years and increased by one point per year thereafter.
Performance of EuroSCORE II according to different subgroups of procedures
| n | Hospital mortality | Discrimination | Recalibration | |||
|---|---|---|---|---|---|---|
| Observed (%) | Expected (%) | O/E ratio (95% CI) | c-statistic (95% CI) | Slope (P-value) | ||
| Elective | 4990 | 3.1 | 3.4 | 0.90 (0.76–1.04) | 0.792 (0.757–0.827) | 1.12 (0.123) |
| Urgent | 944 | 9.0 | 6.3 | 1.43 (1.14–1.72) | 0.822 (0.780–0.864) | 0.92 (0.435) |
| Emergency/salvage | 257 | 23.7 | 16.4 | 1.45 (1.13–1.76) | 0.740 (0.669–0.810) | 0.68 (0.014) |
| Overall CABG surgery | 3424 | 4.7 | 4.0 | 1.17 (0.99–1.35) | 0.846 (0.812–0.875) | 1.12 (0.098) |
| Overall valve procedure | 3131 | 5.6 | 5.5 | 1.01 (0.86–1.15) | 0.811 (0.777–0.846) | 1.01 (0.912) |
| Overall surgery of the thoracic aorta | 899 | 7.6 | 8.3 | 0.91 (0.7–1.12) | 0.837 (0.790–0.886) | 1.13 (0.297) |
| Isolated CABG surgery | 2605 | 3.0 | 2.7 | 1.12 (0.88–1.37) | 0.830 (0.790–0.870) | 1.20 (0.064) |
| One procedure | 1596 | 3.8 | 3.1 | 1.25 (0.94–1.56) | 0.829 (0.773–0.884) | 1.19 (0.106) |
| Aortic valve | 769 | 2.1 | 2.7 | 0.76 (0.39–1.13) | 0.783 (0.648–0.918) | 1.15 (0.489) |
| Mitral valve | 497 | 3.8 | 2.5 | 1.53 (0.85–2.21) | 0.792 (0.688–0.896) | 1.05 (0.808) |
| Thoracic aortic surgery | 182 | 7.7 | 5.3 | 1.46 (0.72–2.20) | 0.869 (0.783–0.955) | 1.27 (0.316) |
| Two procedures | 1362 | 7.1 | 6.5 | 1.10 (0.89–1.32) | 0.808 (0.762–0.854) | 1.06 (0.573) |
| CABG and valve | 502 | 7.8 | 6.3 | 1.23 (0.86–1.61) | 0.790 (0.721–0.859) | 1.00 (0.992) |
| Two valves | 317 | 7.9 | 6.5 | 1.22 (0.76–1.68) | 0.773 (0.668–0.878) | 0.99 (0.961) |
| Valve and thoracic aortic surgery | 287 | 3.5 | 6.4 | 0.54 (0.21–0.88) | 0.903 (0.849–0.957) | 1.30 (0.356) |
| Three procedures | 628 | 10.0 | 10.4 | 0.96 (0.74–1.19) | 0.792 (0.734–0.851) | 1.03 (0.800) |
Recalibration slope refers to the coefficient of EuroSCORE II linear predictor included in a logistic model for hospital mortality with P-values that compare the estimated slope to unity under the hypothesis of perfect calibration.
O/E: observed/expected ratio.
Missing EuroSCORE II
In comparison with patients with EuroSCORE II evaluable (Table 1), the 102 with one or more missing EuroSCORE II risk factors had similar mean age (66.5 ± 9.5 years; P = 0.450), proportion of females (31.4%; P = 0.558), weight of intervention (isolated CABG 39.2%, one procedure 33.3%, two procedures 18.6% and three procedures 8.8%; P = 0.377) with a greater proportion of emergency and salvage operations (8.8%; P = 0.020). Fifteen patients died after the surgery: the incidence of hospital mortality was significantly higher than in patients with EuroSCORE II (14.7%; P < 0.001). When missing EuroSCORE II were replaced with the mean value according to urgency and weight of intervention, the risk score confirmed the high discrimination (AUC of ROC curve 0.827; 95% CI: 0.804–0.852) and calibration (Hosmer–Lemeshow test was χ2 = 16.47 with P = 0.051) over the entire sample.
Hierarchical tree
Figure 3 shows the final tree generated on the entire sample (6293 procedures with 315 patients died) by a recursive tree-building algorithm that hierarchically created subgroups on the basis of variables included in the EuroSCORE II. Advanced NYHA class and emergency/salvage procedures were the first two predictors with the highest association to mortality. The stratification was improved considering the presence of depressed left ventricular ejection fraction (≤30%), active endocarditis, creatinine clearance ≤50 ml/min or preoperative dialysis, female gender, previous cardiac surgery, critical preoperative state, age >72 years, presence of extracardiac arteriopathy, systolic pulmonary artery pressure >55 mmHg and urgent operation. Patients at low risk (≤1.5%) were 3467 (55.1%), at low-intermediate risk (1.6–5.0%) were 1074 (17.1%), at intermediate risk (5.1–10.0%) were 1140 (18.1%), at intermediate-high risk (10.1–20.0%) were 239 (3.8%) and at high risk (>20%) were 373 (5.9%). The five subgroups, easily identifiable at the terminal node of tree showed in Fig. 3, had observed mortality rates of 1.5, 3.2, 6.4, 14.6 and 32.2%. The EuroSCORE II expected mortality rates were, respectively, 2.2, 3.3, 6.2, 9.9 and 18.8%.
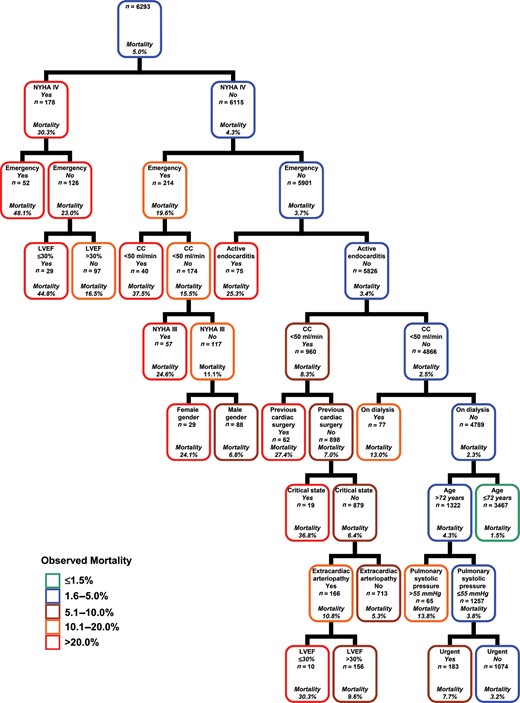
Predictors of in-hospital mortality and risk stratification after cardiac surgery: each node is based on available data for each predictive variable in the EuroSCORE II model. Owing to low prevalence of some high risk categories, a salvage procedure was analysed with emergency procedure and patients with left ventricular ejection fraction ≤20% with those 21–30% (unique group with values ≤30%). CC = creatinine clearance; LVEF = left ventricular ejection fraction; NYHA = New York Heart Association.
DISCUSSION
In this study of more than 6000 patients over 2 years from the seven cardiac surgical units of a Southern Italian region, we have shown that the external performance of EuroSCORE II in predicting hospital mortality was good with high concordance between predicted probabilities and outcome. The model showed acceptable calibration with no significant differences between predicted and observed frequencies. There were deviations in absolute risk predictions with overestimation of survival in patients at higher risk. The complete model revision showed that most of the re-estimated regression coefficients were not significantly different from those in the original model. Moreover, the recursive analysis of EuroSCORE II variables allowed developing a practical user-friendly bedside tool for risk stratification of hospital mortality in patients receiving cardiac operations.
Risk prediction models play an important role in current cardiac surgical practice. The EuroSCORE II model was developed to help clinicians and surgeons in estimation of the absolute mortality risk of patients undergoing cardiac surgery and it was conceptually created by a combination and modification of previous scoring systems [1–3]. The new EuroSCORE II was developed in order to improve calibration of the score preserving the high discrimination reported by the old model of EuroSCORE [3].
The performance of the recently updated EuroSCORE II has been assessed in several studies including patients who had undergone major cardiac surgery [5–11], isolated CABG or valve surgery [12–15], emergency or high-risk procedures [16, 17]. Generalization of results assessing the role of EuroSCORE II, however, is limited by small sample sizes of prospective studies conducted after EuroSCORE II enrolment or by retrospective design of larger studies, often single centre, that have analysed patients operated before the EuroSCORE II study period (see Table 5). EuroSCORE II, which included 22 381 patients with a validation subcohort of 5553 subjects, accrued data over a 12-week period from May to July 2010. Several validation studies of EuroSCORE II have included patients operated before May 2010 with possible effects on validation process due to dynamic changes in the patient characteristics and case-mix. Most studies were single centre or involved a limited number of participating centres. Analysis of a single institution's results may not be completely representative, and thus may be an important source of potential bias. Grant et al. [7] conducted the largest study assessing the performance of EuroSCORE II in UK cardiac surgery analysing the multicentre data from the Society for Cardiothoracic Surgery in Great Britain and Ireland Database that included 23 740 procedures between July 2010 and March 2011 from all National Health Service hospitals and some UK private centres. Studies on performance of EuroSCORE II have demonstrated a good discriminatory ability of EuroSCORE II, often better than its original version. The area under the ROC curve, reported in Table 5 for EuroSCORE II studies, was >0.80 in 7 studies out of 14. Reported calibration was often poor, with statistical tests that indicated in 10 studies a significant deviation between observed and expected frequencies of events. Our data showed an overall good calibration by the O/E ratio, and no significant deviation between expected and observed mortality according to the Hosmer–Lemeshow statistic and recalibration analysis.
Comparison of recent EuroSCORE II studies
| Study | Time period | Sample size | Centres | Procedures | AUC | Calibration |
|---|---|---|---|---|---|---|
| Nashef et al. [3] | May to July 2010 | 22 381 | 154 | Major cardiac surgery | 0.810 | 0.051 |
| Di Dedda et al. [5] | September 2010 to October 2011 | 1090 | 1 | Major cardiac surgery | 0.81 | 0.22 |
| Chalmers et al. [6] | January 2006 to March 2010 | 5576 | 1 | Major cardiac surgery | 0.79 | <0.001 |
| Grant et al. [7] | July 2010 to March 2011 | 23 740 | 41 | Major cardiac surgery | 0.808 | 0.003 |
| Barili et al. [8] | 2006–2011 | 12 325 | 3 | Major cardiac surgery | 0.82 | <0.050 |
| Carnero-Alcázar et al. [9] | January 2005 to December 2010 | 3798 | 1 | Major cardiac surgery | 0.85 | <0.001 |
| Kirmani et al. [10] | February 2001 to March 2010 | 15 499 | 1 | Major cardiac surgery | 0.818 | <0.001 |
| Borde et al. [11] | December 2011 to October 2012 | 498 | 1 | CABG and valve surgery | 0.69 | 0.71 |
| Biancari et al. [12] | June 2006 to April 2011 | 1027 | 1 | Isolated CABG | 0.852 | – |
| Kunt et al. [13] | June 2004 to March 2012 | 428 | 1 | Isolated CABG | 0.72 | <0.050 |
| Zhang et al. [14] | January 2006 to December 2011 | 3479 | 1 | Valve surgery | 0.685 | <0.001 |
| Wang et al. [15] | January 2008 to December 2011 | 11 170 | 4 | Valve surgery | 0.72 | 0.002 |
| Grant et al. [16] | April 2008 to March 2011 | 3342 | 41 | Emergency procedures | 0.690 | <0.050 |
| Howell et al. [17] | April 2006 to March 2011 | 933 | 2 | High-risk cardiac surgery | 0.67 | 0.035 |
AUC: area under the receiver operator characteristic curves.
A good risk-scoring model is considered to be valuable in predicting outcomes and guiding the selection of patients. Clinicians and surgeons need to be confident that the absolute risk prediction function can be transported to a setting different from the original one. We sought to demonstrate the external validity of the EuroSCORE II model by examining its performance in a recent population of consecutive patients who had undergone major cardiac surgery over two years in an Italian region that implemented a prospective regional adult cardiac surgery registry. The main findings of our study are in good agreement with most of the previous studies showing the good performance of EuroSCORE II in predicting outcomes after cardiac surgery in a group of patients with several different characteristics from the original cohort. In comparison with EuroSCORE II [3], patients in our study population were older with lower creatinine clearance, more frequently females and diabetic with lower prevalence of active endocarditis. Also the proportion of procedures was different: less isolated CABG and more valve surgeries, thoracic aortic surgeries and other major heart procedures. Despite these differences, the ability of the EuroSCORE II prediction function to discriminate between subjects who died and those who survived after cardiac surgery was good for the entire population and for subgroups of the most common procedures. In our model calibration analysis, we found reasonably good agreement between predicted and actual mortality event rates. Only for non-elective procedures was an underestimation of predicted risk detected. We demonstrated that the EuroSCORE II prediction function works reasonably well among different types of surgery. In this regard, the present study is unique in seeking to validate the scoring system with the largest available external database on consecutive patients undergoing cardiac surgery in each public and private hospital of the Puglia region, with information filed in a regional multicentre registry. The entire cohort was operated after the EuroSCORE II enrolment. The study population included each on-pump operation and each off-pump CABG performed over 2 years, overcoming the issue of seasonal variation in mortality after cardiac surgery that may introduce bias into the predicted and the observed mortality [20].
This is the first study that re-evaluated the multivariate influence of all risk factors included in the EuroSCORE II with the aim to compare re-estimated coefficients of the logistic regression model with those reported in the original model. In our population, age and urgency of operation had significantly greater coefficients while creatinine clearance ≤50 ml/min showed a significantly lower coefficient than in EuroSCORE II. The other risk factors were not significantly different between the two models. In comparison with the old EuroSCORE, the new EuroSCORE II reported a great reduction of coefficients assigned to each year of age above 60. Moreover, our population included older patients than in the EuroSCORE II cohort with possible greater effects of advanced age on mortality. Emergency operation has similar coefficients between the old and new scores, but the reference category was different (elective for the new model and elective plus urgent procedures for the old model). We observed a greater multivariate effect of urgent and emergency procedures in our consecutive cohort of patients that included each cardiac surgery performed over 2 years in a region with more than 4 million inhabitants. The reduced coefficient for the presence of renal impairment should be explained considering the greater effects detected for age that is strongly correlated with lower creatinine clearance values.
Another important result of our study was the derivation of a hierarchical tree for modelling the relationship between risk factors and hospital mortality after cardiac surgery by using EuroSCORE II variables. This non-parametric approach, which did not exclude patients exploring the effect of the presence of each risk factor over mortality, allowed one to identify homogeneous subgroups in terms of survival. With this technique, the overall hospital mortality rate of 5.0% was separately assigned to three large groups with low-to-moderate risk (90.3% of patients with observed mortality rates of 1.5, 3.2 and 6.4%) and two high-risk groups (9.7% of procedures with mortality rates of 14.6 and 32.2%). Patients with low-to-moderate risk had similar rates of observed and EuroSCORE II predicted mortality. Patients at higher risk showed a great deviation between observed and expected mortality with an underestimation of the risk. This result confirms what we observed in the highest deciles of EuroSCORE with greater mortality than those predicted and suggested by different authors. Several explanations can be provided for the observed higher-than-predicted event rate. The EuroSCORE II is a risk assessment tool developed using widely available clinical variables and operation-related factors. Possible concomitant risk factors not incorporated in the EuroSCORE II may reduce the rate of predicted events mainly in patients at higher risk. Moreover, the model did not take into account potential interaction between risk factors that may have greater effects on mortality when combined.
Several aspects may influence the universal acceptance of cardiac surgery risk models that need a continuous process of recalibration. The defininition of operative mortality may vary: the old version of EuroSCORE used mortality within 30 days from operation or later if the patient is still hospitalized. The new EuroSCORE II was developed considering the more available outcome of death in the hospital where the operation took place. Mortality may vary in relation to the time of follow-up because of the wide variation in discharge policies across countries with serious impact on the calibration and recalibration of a model. Moreover, even though known individual risk factors are included in the predictive model, variability in adjusted mortality rates may be attributable to differences in performance between centres [21]. The validation process may be influenced also by the differences that may exist in interpretations of risk factor definitions [22]. Finally, the inclusion or exclusion of procedures with missing data from the derivation or validation cohort may influence results and the comparability of data. Missing data are a common problem in all types of medical research. Also the original study of EuroSCORE II was affected by the presence of missing data with 418 procedures excluded for missing required fields [3]. In our study, EuroSCORE II was not available in a very low proportion of procedures (1.6%) as in the original cohort (1.8%). However, the overall good performance of the score was confirmed in the entire population by replacing the missing EuroSCORE II with mean value.
Analysis of a single region's results may not represent national and international practice and outcomes, and thus may be an important limitation of the present study. The number of patients in our study was lower than those evaluated in the EuroSCORE derivation cohort but higher than its validation group.
In conclusion, our external validation of the EuroSCORE II confirms the good performance of this scoring model in a cohort of contemporary patients from a multicentre prospective regional cardiac surgery registry. The EuroSCORE II predicts hospital mortality with a slight underestimation in high-risk patients that should be further and better evaluated. The risk tree based on EuroSCORE II variables provides clinicians and surgeons a practical bedside tool for mortality risk stratification of patients at low, intermediate and high risk for hospital mortality after cardiac surgery.
Conflict of interest: none declared.
REFERENCES
Author notes
The first two authors contributed equally to this study.
