


Abstract
There is a current trend towards the use of bioprosthetic aortic valves in the aortic position in young patients, but there is limited information on durability beyond the first decade. The Hancock II bioprosthesis has been reported to have excellent durability in patients ≥60 years of age. This study examines the long-term durability of the Hancock II bioprosthesis in the aortic position in patients <60 years of age.
From 1982 to 2008, 304 patients aged 59 years or less underwent aortic valve replacement (AVR) with a Hancock II bioprosthesis at two centres. The mean age was 49.2 ± 9.0 years, and 79% of the patients were male. Valve function was serially assessed by echocardiography. The median follow-up was 14.6 years (maximum 27.5 years). Survival and freedom from adverse events were calculated by using a Kaplan–Meier method. Independent predictors of those events were assessed by using Cox proportional hazards analyses.
Survival and freedom from repeat AVR (re-AVR) at 20 years were 57.0 ± 6.1 and 25.4 ± 4.7%, respectively. During the follow-up, 100 patients (33%) underwent re-AVR: 78 for structural valve deterioration (SVD), 11 for endocarditis, 4 for non-structural valve dysfunction and 7 for other reasons. The overall 10-, 15- and 20-year freedom from re-AVR due to SVD were 91.4 ± 2.1, 64.7 ± 4.3 and 29.1 ± 5.3%, respectively. By age group, the 20-year freedom from re-AVR due to SVD amounted to 14.1 ± 8.7% in patients younger than 40 years of age, 21.5 ± 8.5% in patients aged 40–49 and 41.4 ± 8.2% in patients between 50 and 59 (P = 0.04). The independent predictors of re-AVR due to SVD were age [odds ratio (OR): 0.72 per 10 years; 95% confidence interval (CI): 0.58, 0.90; P < 0.01] and prosthesis–patient mismatch (PPM) (effective orifice area index <0.80 cm2/m2) (OR: 1.63; 95% CI: 1.01, 2.63; P = 0.045).
The Hancock II bioprosthesis for AVR in patients <60 years of age is associated with excellent durability during the first decade. However, SVD increases dramatically during the second decade and by 20 years, especially in patients aged <50 and/or with PPM. These findings may assist prosthesis selection for patients and their surgeons.
INTRODUCTION
Over the last decade, the use of bioprostheses has become more common, along with improvement in their performance and durability [1, 2]. Bioprostheses are implanted in younger patients more often than previously, although younger age remains a strong predictor of structural valve deterioration (SVD) [1–3]. Overall, this results from avoidance of anticoagulation therapy, as well as from observational studies having reported good clinical outcomes with second generation bioprostheses [4, 5]. Recently, the use of the Hancock II bioprosthesis for aortic valve replacement (AVR) has been shown to have good durability [6] in patients older than 60 years of age, but long-term durability in younger patients remains open to question.
Hancock II bioprostheses have been reported to have excellent durability in the aortic position [4, 5], but there are only limited studies reporting their long-term clinical outcomes in a sizable number of young patients. As more and more young patients in need of AVR are considering bioprostheses over mechanical valves, knowing those clinical outcomes and the predictors of durability more accurately would improve the prosthesis selection process for patients and surgeons. In this study, we assessed the 20-year durability of the Hancock II bioprosthesis in the aortic position in patients aged 59 years or less. In order to assess more young patients, we collected data from two centres.
MATERIALS AND METHODS
Patients
Between September 1982 and November 2008, 304 consecutive patients aged 59 years or less consecutively received AVR with a Hancock II bioprosthesis valve, with or without coronary artery bypass grafting, and with or without ascending aortic replacement, at Toronto General Hospital (Toronto, ON, Canada) and University of Ottawa Heart Institute (Ottawa, ON, Canada). Patients who underwent concomitant mitral valve surgery were excluded. The mean age of patients was 49.2 ± 9.0 years (range, 17–59 years) at the time of AVR. Table 1 shows details of the perioperative patient characteristics. Effective orifice area index (EOAI) was calculated by using the patients' body surface area (BSA) and the reference values of the effective orifice area [7]. Prosthesis–patient mismatch (PPM) was defined as an EOAI of <0.80 cm2/m2.
Perioperative demographics
| Preoperative demographics | |
| Gender (female) | 21% (63/304) |
| Age (years) | 49.2 ± 9.0 |
| Age group | |
| <40 | 16% (47/304) |
| 40–49 | 25% (77/304) |
| 50–59 | 59% (180/304) |
| BSA (m2) | 1.91 ± 0.22 |
| Diabetes mellitus | 8% (23/304) |
| Hypertension | 29% (87/304) |
| Hypercholesterolaemia | 19% (58/304) |
| Preoperative creatinine (μmol/l) | 87.4 ± 20.6 |
| Smoker (current or past) | 47% (143/304) |
| COPD | 5% (15/304) |
| PVD | 3% (10/304) |
| Timing of operation (non-elective case) | 16% (50/304) |
| History of myocardial infarction | 2% (5/304) |
| LV dysfunction, EF < 40% | 15% (45/304) |
| NYHA, 3 or 4 | 44% (135/304) |
| Aortic disease (AR/AS/ASR) | |
| AR | 35% (107/304) |
| AS | 48% (146/304) |
| ASR | 16% (47/304) |
| Preoperative infective endocarditis | 10% (29/304) |
| Operative demographics | |
| Implanted Hancock II size (mm) | |
| 21 | 7% (21/304) |
| 23 | 22% (68/304) |
| 25 | 30% (90/304) |
| 27 | 28% (86/304) |
| 29 | 13% (39/304) |
| Calculated EOA (cm2) | 1.46 ± 0.77 |
| Calculated EOA index (cm2/m2) | 0.77 ± 0.09 |
| EOA index <0.80 cm2/m2 | 62% (187/301) |
| Concomitant CABG | 20% (62/304) |
| Concomitant Asc Ao replacement | 13% (38/304) |
| Ao enlargement | 20% (60/304) |
| CPB time (min) | 98.8 ± 43.9 |
| Ao clamp time (min) | 72.2 ± 27.6 |
BSA: body surface area; COPD: chronic obstructive pulmonary disease; PVD: peripheral vessel disease; EF: ejection fraction; NYHA: New York Heart Association classification; AR: aortic regurgitation; AS: aortic stenosis; EOA: effective orifice area; Asc Ao: ascending aorta; CPB: cardiopulmonary bypass.
Operative technique
The aortic valve bioprosthesis was implanted in a supra-annular position by using horizontal mattress sutures of 2–0 polyester with pledgets or single sutures of 2–0 polyester without pledgets. In order to minimize transvalvular gradients, posterior enlargement of the aortic annulus was performed in 60 patients (20%).
Follow-up
Patients were followed at a dedicated clinic, by telephone and by mail interview. The methods of the valve follow-up clinic were approved by our Research Ethics Board, and patients consented to be followed. The mean follow-up duration was 14.2 years (median 14.6 years, maximum 27.5 years). The follow-up was complete in 97% (296/304). Adverse events were defined according to the ‘Guidelines for reporting mortality and morbidity after cardiac valve interventions’ [8].
Statistical analysis
Continuous data are presented as mean ± standard deviation, unless specified. Categorical variables are presented as frequencies and percentages. Long-term survival and time-to-event analyses were performed by using Kaplan–Meier analysis with a log-rank test to compare subgroups. Cox proportional hazards analyses were performed to determine independent predictors of all-cause death, valve-related death, repeat AVR (re-AVR), re-AVR due to SVD, thromboembolism and prosthetic valve endocarditis. As predictors of mortality and valve-related morbidity, the following continuous perioperative variables were assessed: BSA (m2), cardiopulmonary bypass time (min) and aortic cross-clamp time (min). Also, the following categorical preoperative and operative variables were assessed: gender, diabetes mellitus, hypertension, hypercholesterolemia, renal failure (on dialysis or serum creatinine level >150 μmol/l), smoking (current, past or never), chronic obstructive pulmonary disease (COPD), peripheral vascular disease, timing of operation (non-elective or elective), history of myocardial infarction, left ventricle dysfunction (ejection fraction <40%), preoperative infective endocarditis, PPM, concomitant coronary artery bypass grafting (CABG), concomitant ascending aorta replacement and concomitant aortic root enlargement procedure. Age was assessed as an interval variable in 10-year increments. After univariable log-rank testing, only variables with P < 0.20 were assessed by Cox proportional hazards analyses, where stepwise forward techniques were used with P < 0.05 for entry and P ≥ 0.10 for removal. All reported P-values are two-sided. Data were analysed in SPSS version 20.0 (IBM Corp., Armonk, New York, NY, USA).
RESULTS
Early and late mortality
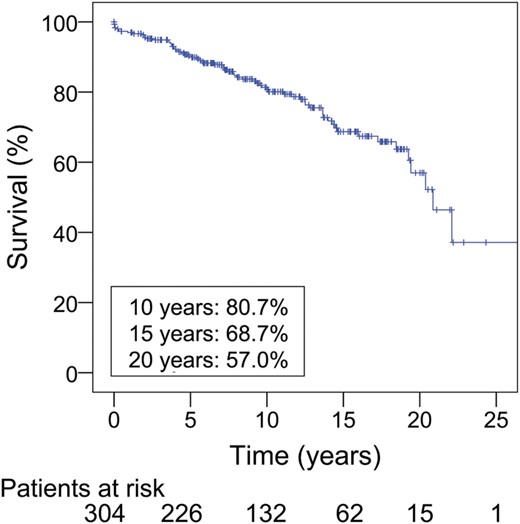
A total of 69 patients died during the follow-up. Out of them, 6 patients (2%) died within 1 month of initial operation, and 3 patients (1%) died 1 month to 1 year after operation. During the whole follow-up period, the number of valve-related deaths was 21. Figure 1 shows the Kaplan–Meier survival curve for all patients. Early actuarial survival was 98.0 ± 0.8% at 30 days and 97.0 ± 1.0% at 1 year after AVR. Actuarial survival at 10 and 20 years was 80.7 ± 2.6% and 57.0 ± 6.1%, respectively (Fig. 1). Table 2 displays survival according to age. Independent predictors of all-cause death were COPD [odds ratio (OR): 3.0; 95% confidence interval (95% CI): 1.4, 6.4; P < 0.01], non-elective operation (OR: 2.4; 95% CI: 1.4, 4.3; P < 0.01), LV dysfunction (ejection fraction <40%) (OR: 2.2; 95% CI: 1.2, 4.2; P = 0.02) and a history of myocardial infarction (OR: 7.5; 95% CI: 2.1, 26.9; P < 0.01) (Table 3a). Independent predictors of valve-related death were a history of myocardial infarction (OR: 21.9; 95% CI: 2.5, 188.6; P < 0.01) and preoperative renal failure (OR: 9.1; 95% CI: 2.1, 40.8; P < 0.01).
Survival and freedom from re-AVR/re-AVR due to SVD
| Patients | Follow-up (patients at risk) | ||
|---|---|---|---|
| At 10 years | At 15 years | At 20 years | |
| Actuarial survival (%) | |||
| Overall (n = 304) | 80.7 ± 2.6 (132) | 68.7 ± 3.8 (62) | 57.0 ± 6.1 (15) |
| Age <40 (n = 47) | 79.9 ± 6.5 (22) | 69.2 ± 9.2 (11) | 69.2 ± 9.2 (2) |
| 40≤ age <50 (n = 77) | 82.1 ± 5.3 (36) | 70.2 ± 7.8 (16) | 70.2 ± 7.8 (4) |
| 50≤ age <60 (n = 180) | 80.5 ± 3.4 (74) | 67.5 ± 5.0 (35) | 48.7 ± 8.5 (9) |
| Actuarial freedom from re-AVR (%) | |||
| Overall | 83.8 ± 2.6 (130) | 56.6 ± 4.2 (60) | 25.4 ± 4.7 (15) |
| Age <40 | 76.6 ± 7.3 (22) | 47.9 ± 9.3 (11) | 12.0 ± 7.5 (2) |
| 40≤ age <50 | 83.7 ± 5.1 (35) | 56.7 ± 7.9 (15) | 20.2 ± 8.0 (4) |
| 50≤ age <60 | 85.8 ± 3.3 (73) | 60.0 ± 5.7 (34) | 35.2 ± 7.2 (9) |
| Actuarial freedom from re-AVR due to SVD (%) | |||
| Overall | 91.4 ± 2.1 (130) | 64.7 ± 4.3 (60) | 29.1 ± 5.3 (15) |
| Age < 40 | 89.9 ± 5.6 (22) | 56.2 ± 10.1 (11) | 14.1 ± 8.7 (2) |
| 40 ≤ age <50 | 86.4 ± 4.9 (35) | 60.5 ± 8.1 (15) | 21.5 ± 8.5 (4) |
| 50 ≤ age <60 | 94.3 ± 2.3 (73) | 70.6 ± 5.7 (34) | 41.4 ± 8.2 (9) |
| Actuarial freedom from SVD | |||
| Overall | 90.9 ± 2.1 (130) | 61.6 ± 4.3 (60) | 25.2 ± 5.0 (14) |
| Age < 40 | 89.9 ± 5.6 (22) | 56.2 ± 10.1 (11) | 14.1 ± 8.7 (2) |
| 40 ≤ age <50 | 86.4 ± 4.9 (35) | 52.3 ± 8.3 (15) | 14.7 ± 7.0 (3) |
| 50 ≤ age <60 | 93.5 ± 2.4 (73) | 68.8 ± 5.7 (34) | 37.8 ± 8.0 (9) |
| Actuarial freedom from major adverse valve-related event (%) | |||
| Overall | 73.9 ± 3.1 (120) | 44.8 ± 4.0 (56) | 16.7 ± 3.7 (13) |
| Age < 40 | 69.3 ± 7.9 (21) | 39.6 ± 8.7 (11) | 9.9 ± 6.2 (2) |
| 40 ≤ age <50 | 73.8 ± 6.0 (32) | 43.2 ± 7.6 (14) | 13.2 ± 6.3 (3) |
| 50 ≤ age <60 | 75.3 ± 4.0 (67) | 47.7 ± 5.5 (31) | 21.9 ± 5.8 (8) |
re-AVR: repeat aortic valve replacement; SVD: structural valve deterioration.
Independent predictors (Cox proportional hazards analyses)
| Predictors | OR (95% CI) | P-value |
|---|---|---|
| (a) All-cause death | ||
| COPD | 3.0 (1.4–6.4) | P < 0.01 |
| Non-elective operation | 2.4 (1.4–4.3) | P < 0.01 |
| LV dysfunction (EF < 40%) | 2.2 (1.2–4.2) | 0.02 |
| History of myocardial infarction | 7.5 (2.1–26.9) | P < 0.01 |
| (b) Repeat AVR | ||
| Age (per 10-year increase) | 0.75 (0.61–0.92) | P < 0.01 |
| Prosthesis–patient mismatch | 1.6 (1.1–2.5) | 0.03 |
| (c) Repeat AVR due to SVD | ||
| Age (per 10-year increase) | 0.72 (0.58–0.90) | P < 0.01 |
| PPM | 1.6 (1.01–2.6) | 0.045 |
HR: hazard ratio; COPD: chronic obstructive pulmonary disease; LV: left ventricle; EF: ejection fraction; PPM: prosthesis–-patient mismatch (defined as an EOAI of <0.80 cm2/m2); NYHA: New York Heart Association classification; SVD: structural valve deterioration.
Survival curve.
Prosthesis–patient mismatch and annulus enlargement
In this study, 187 patients had PPM after AVR and 114 did not. The BSAs of 3 patients were not recorded and not included in the analyses for PPM. Out of the 60 patients with annulus enlargement, 38 patients (63%) still had PPM after operation and 22 did not. Without annulus enlargement, 149 patients (62%) had PPM and 92 did not. There was no significant difference in the incidence of PPM between with and without annulus enlargement (P = 0.8).
Reoperation
A total of 100 patients underwent repeat AVR: 78 for SVD, 11 for endocarditis, 4 for non-structural valve dysfunction (2 for paravalvular leakage, 2 for pannus formation) and 7 for prophylactic re-AVR concomitant with other cardiac procedures, which consisted of 6 ascending aortic replacements and 1 mitral valve surgery. The operative mortality of reoperation was 6% (6/100). Overall actuarial freedom from re-AVR at 10, 15 and 20 years was 83.8 ± 2.6%, 56.6 ± 4.2% and 25.4 ± 4.7%, respectively. The details of the freedom from re-AVR are given in Table 2. Independent predictors of re-AVR were age (OR: 0.75 per 10-year increase; 95% CI: 0.61, 0.92; P < 0.01) and PPM (EOAI <0.80 cm2/m2) (OR: 1.6; 95% CI: 1.1, 2.5; P = 0.026) (Table 3b).
Reoperation for SVD was performed in 78 patients. Actuarial freedom from re-AVR due to SVD was 91.4 ± 2.1, 64.7 ± 4.3 and 29.1 ± 5.3% at 10, 15 and 20 years, respectively (Fig. 2). A stratification according to age is given in Table 2 and on Fig. 3. Independent predictors of re-AVR due to SVD were age (OR: 0.72 per 10-year increase; 95% CI: 0.58, 0.90; P < 0.01) and PPM (OR: 1.6; 95% CI: 1.01, 2.6; P = 0.045) (Table 3c). When focused on the patients aged 50–59 without PPM, the actuarial freedom from re-AVR due to SVD for these patients (n = 55) was 58.8% at 20 years (Fig. 4). On the other hand, in the patients <50 years of age, there was no significant difference in the freedom from re-AVR due to SVD between with and without PPM (Fig. 5).

Re-AVR due to SVD.
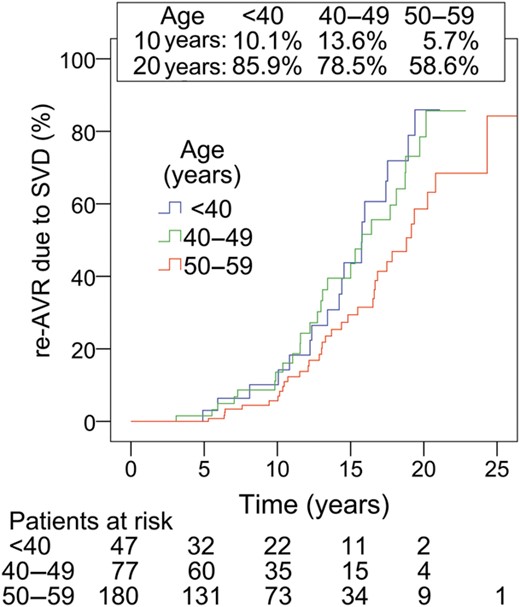
Re-AVR due to SVD according to age. Comparison of subgroups; P = 0.04.
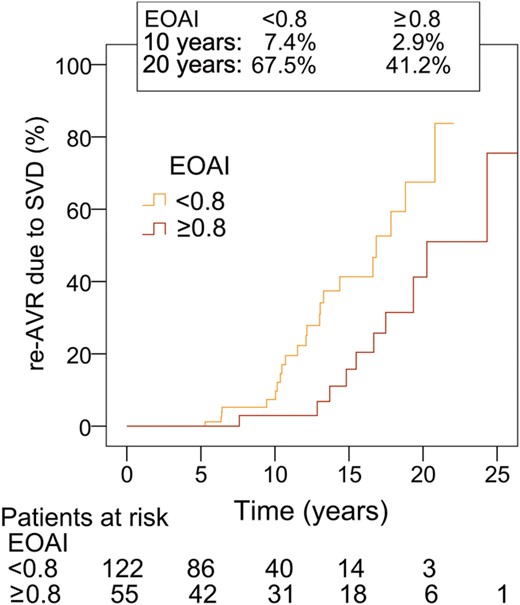
Re-AVR due to SVD, aged 50–59 with or without PPM. EOAI: effective orifice area index (cm2/m2). Comparison of subgroups, P = 0.01.
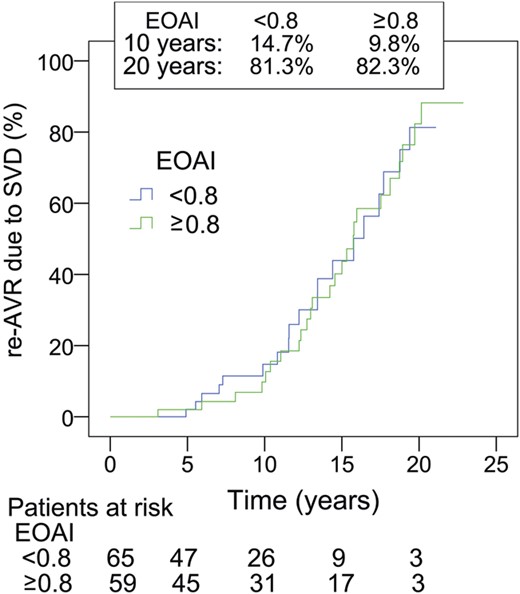
Re-AVR due to SVD, aged younger than 50 with or without PPM. EOAI: effective orifice area index (cm2/m2). There is no significant difference between these subgroups.
The actuarial freedom from re-AVR due to SVD at 20 years was 20.8 ± 9.9% in patients with annulus enlargement, 35.1 ± 9.0% in non-PPM patients without annulus enlargement and 32.7 ± 9.4% in PPM patients without annulus enlargement. There were no significant differences in re-AVR due to SVD among these three groups.
Structural valve deterioration
During the follow-up duration, 85 patients developed SVD. The overall actuarial freedom from SVD was 90.9 ± 2.1, 61.6 ± 4.3 and 25.2 ± 5.0% at 10, 15 and 20 years, respectively. The details according to age are given in Table 2. The independent predictors of SVD were age (OR: 0.74 per 10-year increase; 95% CI: 0.59, 0.91; P < 0.01) and PPM (OR: 1.6; 95% CI: 1.03, 2.6; P = 0.034).
Thromboembolism
A total of 16 patients had thromboembolic complications (7 strokes and 9 transient ischemic attacks). Three of them died of stroke, and 3 patients had a permanent deficit. The actuarial freedom from thromboembolism was 95.9 ± 1.4, 91.9 ± 2.4 and 86.5 ± 3.8% at 10, 15 and 20 years, respectively. Preoperative infective endocarditis was an independent predictor of thromboembolism (OR: 7.1; 95% CI: 2.5, 20.5; P < 0.001).
Prosthetic valve endocarditis
Nineteen patients developed prosthetic valve endocarditis after operation. Out of them, 11 patients required re-AVR. Actuarial freedom from prosthetic valve endocarditis was 99.0 ± 0.6, 96.4 ± 1.1, 92.3 ± 1.9, 91.4 ± 2.0 and 89.1 ± 3.1% at 1, 5 10, 15 and 20 years, respectively. There were no significant independent predictors of prosthetic valve endocarditis.
Haemorrhagic complications and non-structural valve failure
Major bleeding occurred in 8 patients. Hospitalization was required for 7 patients, and 5 patients received transfusion. A total of 4 patients underwent re-AVR for non-structural valve failure (2 paravalvular leakage and 2 pannus).
Major adverse valve-related event
Actuarial freedom from major adverse valve-related events was 73.9 ± 3.1, 44.8 ± 4.0 and 16.7 ± 3.7% at 10, 15 and 20 years, respectively.
DISCUSSION
This study revealed the details of a 20-year durability follow-up with the Hancock II bioprosthesis in the aortic position, in young patients at two centres. SVD dramatically increased from 10 years to 20 years after operation, especially in patients aged <50 and with PPM.
Structural valve deterioration over 20 years
Postoperatively up to 10 years, the Hancock II aortic bioprosthesis was durable in the present cohort of young patients, with 91.4% actuarial freedom from re-AVR due to SVD at the 10-year follow-up. This result is comparable with that of older patients in a previous study [6]. David et al. reported that freedom from SVD and re-AVR due to SVD were 98.4 and 98.0% at 10 years after AVR with the Hancock II bioprosthesis in patients aged 60–70. At the 20-year follow-up, in the current study, durability was poor due to a steep reoperative increment that started after the first 10 years of follow-up (Fig. 2). In addition, even among patients younger than 60, age still remained a significant predictor of SVD. In the stratification by age, the incident rate of re-AVR due to SVD was lowest in patients aged 50–59, and there was no significant difference between patients aged 40–49 and patients younger than 40 (Fig. 3). At 20 years, actuarial freedom from re-AVR due to SVD was 41.4% in the patients aged 50–59. When EOAI is taken into consideration, the 20-year durability is optimized in patients with a large prosthesis who are not in PPM.
Prosthesis–patient mismatch and structural valve deterioration
Multivariable analyses revealed that PPM independently increased re-AVR due to SVD. This is not the first time that this conclusion is found, and PPM was found to be a predictor of reoperation with other bioprostheses in previous study from our group [1]. Mechanistically, it is plausible that patients with PPM may have less tolerance to the same pathological degree of prosthetic stenosis or insufficiency that develops as a result of SVD. Furthermore, small prostheses are exposed, per unit of leaflet area, to more mechanical stresses such as turbulent blood flow and high-velocity jets. Therefore, bioprostheses may degenerate faster or more rapidly lead to clinical consequences in patients with PPM. Our results are consistent with previous articles which have reported that PPM affected SVD [9].
Notably, the performance of annulus enlargement did not significantly diminish the detrimental effect of PPM on freedom from reoperation; however, these comparisons are underpowered due to small numbers (with a possibility of type II error), and it is possible that patients who received annulus enlargement would have fared worse had enlargement not been performed (i.e. lack of true and counterfactual controls) [10].
Long-term follow-up of stented bioprostheses in other studies
Valfre et al. [11] have reported good long-term outcomes with Hancock II bioprosthesis. Actuarial freedom from re-AVR was 87.4, 62.6 and 52.2% at 10, 15 and 20 years postoperatively, respectively, in the aortic position in 50 patients aged <60. We had similar results at 15 years, and a sizable difference at 20 years. However, as their study included only 3 patients at risk at 20 years, their estimated 20-year outcomes may not be accurate. Ruggieri et al. [12] have reported good 20-year durability of the Carpentier-Edwards supra-annular aortic valve prosthesis (Edwards LifeSciences, Irvine, CA, USA) in 134 patients aged 61–70, while the durability was low in a total of 36 patients aged ≤60. The actuarial freedom from reoperation due to SVD was 47.3 and 14.2% in patients aged ≤60 at 15 and 20 years, respectively, even though it was 90.1% at 10 years. Similarly, Jamieson et al. [13] reported long-term clinical outcomes with the Carpentier-Edwards supra-annular aortic valve prosthesis. This study included 230 patients aged 51–60 years and 133 patients aged ≤50. Freedom from SVD at 18 years after operation was 51.0% in patients aged 51–60 and 31.9% in patients younger than 51. These rates could be lower at the 20-year follow-up, a period where freedom from reoperation falls sharply. Myken et al. [14] reported on a 20-year experience with the Biocor porcine bioprosthesis (St Jude Medical, St Paul, MN, USA). In their study, the freedom from SVD was 44.5% at 18 years in patients aged ≤65 (the number of patients at risk was 6). This rate could be lower at 20 years in patients aged <60. A multicentre study [15] reported long-term clinical outcomes with the Mitroflow pericardial bioprosthesis (Sorin Group, Inc., Mitroflow Division, Vancouver, Canada) in patients mostly aged more than 70 years. The freedom from re-AVR was 33.1% at 15 years in the aortic position in patients aged <60 (the number of patients at risk was 8). Also, the freedom from SVD was 54.4% at 18 years, but the number of patients at risk was not reported for this subgroup and this rate could sharply drop by 20 years. Forcillo et al. [16] showed their 25-year experience with Carpentier-Edwards pericardial valve (Edwards Lifesciences). The freedom from re-AVR due to valve dysfunction, excluding endocarditis, was 90 and 30% at 10 and 20 years after surgery (73 and 8 patients at risk, respectively). These results are similar to those in our study where the freedom from re-AVR due to SVD was 91.4 and 29.1% at 10 and 20 years, respectively.
The Ross procedure and the aortic valve sparing procedure are other possible options in young patients in need of AVR and who wish to avoid anticoagulation. Both procedures are complex surgery, but may be durable enough over the long term with appropriate patient selection. Excellent long-term clinical outcomes of the Ross procedure were recently reported [17]. In a cohort of 212 patients (mean age: 34 ± 9 years), survival at 20 years was 93.6%. The freedom from reoperation on the pulmonary autograft was 81.8%, while that on the pulmonary homograft was 92.7%. In the same population, another study revealed that the good candidates of the Ross procedure were female patients, those with aortic annulus <27 mm and those with preoperative aortic stenosis [18]. Aortic valve sparing procedure is performed for aortic insufficiency and/or root dilatation, but not for aortic stenosis. In the consecutive 374 patients (mean age: 46.3 ± 15.0 years in the reimplantation technique and 51.2 ± 14.8 years in remodelling the technique), the freedom from reoperation on the aortic valve after aortic valve sparing operations was 94.2% at 20 years (the number of patients at risk was 6) [19].
LIMITATIONS
The study came from 2 centres and may not be generalizable to all centres. In this study, the incidence of PPM was high even with annulus enlargement. We used the published effective orifice areas for each size of Hancock II bioprostheses, rather than the effective orifice areas measured in each patient. This could have caused the high incidence of PPM. Other limitations of this study include those inherent in retrospective analyses, such as confounding, bias and the lack of true controls. Subgroup analyses, such as those examining the effect of aortic root enlargement, were underpowered and prone to Type II errors.
CONCLUSIONS
This study showed frequent SVD of Hancock II bioprosthesis in young patients in the second decade, but very good overall clinical results. These findings may help surgeons and young patients with aortic prosthetic valve selection.
Funding
This project was funded by the academic enrichment fund of the Peter Muink Cardiac Centre and Ottawa Heart Institute.
Conflict of interest: none declared.
REFERENCES
APPENDIX. CONFERENCE DISSCUSSION
Dr A. Bochenek(Katowice, Poland): This is an important - and very provocatively titled - paper. The Canadian group report results of 10-, 15-, and 20-year survival of 80, 68 and 57% respectively, which are quite good. But the presented data on 20-year durability of the Hancock II bioprosthesis in the aortic position reveal that structural valve deterioration and related redo aortic valve replacement is still a very significant problem. The independent predictors were age per 10-year increase and patient-prosthesis mismatch. Dr Une found prosthesis-patient mismatch to be a strong influence on structural valve deterioration in patients aged 50 to 59 years. What does it mean for our everyday practice?
I have some questions. Does it help to select the proper valve for a young patient, especially a patient with patient-prosthesis mismatch? Should we not speculate about lowering the age for tissue valve implantation? Or should we, rather, for young patients with prosthesis-patient mismatch, choose mechanical valves or, in the era of developing the repair technique, repair as small a valve as possible? This paper strongly supports the findings of other authors that for young patients, especially with prosthesis-patient mismatch, implantation of tissue valves increases the risk of complications, so the valve has to be carefully selected.
Two questions. Considering the results achieved by your group, what are the current indications in your institution for a bioprosthetic valve in the young patient population for patients aged 40 years or below? Question two, given the excellent results, what was the selection of prostheses for redo surgery?
Dr Une: Thank you for raising a good point. As I showed, the durability of the Hancock II bioprosthesis is apparently not good for young patients. When we chose a Hancock II bioprosthesis in patients aged 50 to 59 years without prosthesis-patient mismatch, the 20-year freedom from re-AVR due to SVD was about 60%. And the number of patients at risk at 20 years was 6. That's one possible situation where the Hancock II could be acceptable in young patients.
About the indication, I totally agree it's not good for patients younger than 50 years old. But for patients with infective endocarditis, or with high-risk patients, we sometimes have to choose a bioprosthesis to avoid postoperative anticoagulation therapy. Also, we use bioprostheses when patients choose them. Otherwise, we implant a mechanical valve for patients younger than 50 years.
Dr Bochenek: But I suggest a strong message. For the young patient, you should be very careful. And for infective endocarditis, maybe for the patient with the prosthesis mismatch, we should use a stentless valve.
Author notes
Presented at the 27th Annual Meeting of the European Association for Cardio-Thoracic Surgery, Vienna, Austria, 5–9 October 2013.
