


Abstract
Even though left ventricular assist devices (LVADs) may fit into the bodies of small adult patients, their prognosis is worse than that of larger patients. We investigated the relationship between lethal complications and the body surface area (BSA) in patients who received an LVAD.
Our study included 167 patients who received a BerlinHeart INCOR LVAD in our centre. The median BSA was 2.00 m2 (range: 1.56–2.47 m²). From the line graph showing the relationship between the BSA for the cut-off point and the P-value of the log-rank test for the Kaplan–Meier probability of freedom from events, the definitive cut-off point was determined on the basis that, with a decrease in the BSA below this value, the P-value gradually increases.
For freedom from death due to stroke or systemic bleeding, a definitive cut-off point existed and this was a BSA of 1.867 m2. For freedom from death due to sepsis, no definitive cut-off point was found. The multivariate Cox analysis revealed that a BSA of <1.867 m2 was an independent risk factor for death due to stroke or systemic bleeding (hazard ratio: 2.665, 95% confidence interval: 1.349–5.265, P = 0.0048). One-year freedom from death due to stroke or systemic bleeding during the VAD support was 49.1% in patients with a BSA of <1.867 m2 (n = 42) and 82.7% in those with a BSA of ≥1.867 m2 (n = 125; P = 0.0033).
The lower BSA is an independent risk factor for mortality due to stroke or systemic bleeding during the VAD support.
INTRODUCTION
The body surface area (BSA) of adult patients in the USA and Europe who suffer from cardiac failure and need ventricular assist device (VAD) implantation mainly lies around the values of 1.9–2.0 m2 [1–3], and VADs have been designed to target these patients, anatomically and functionally. In terms of anatomy, VADs may be intracorporeally implantable with the following lower limit: a BSA of ≥1.7 m2 for the CardioWest total artificial heart [4], ≥1.5 m2 for the Novacor left ventricular assist device (LVAD) [5], HeartMate LVAD [6], LionHeart LVAD [7] and Jarvik 2000 LVAD [8], ≥1.4 m2 for the VentrAssist LVAD [9], ≥1.2 m2 for the Heartmate II LVAD [2] and HeartWare VAD [10] and ≥1.1 m2 for the DuraHeart LVAD [3]. To avoid the misalignment of the inflow connector of the LVAD or the mechanical compression of cardiovascular structures, each anatomical limit of the BSA was determined [11, 12]. However, in terms of function, when these VADs are implanted in smaller adult patients, it is uncertain whether they can provide optimal performance because the VADs were designed to maximize the pump efficiency at the target BSA (this may be 1.9–2.0 m2). For the smaller patients, the required pump flow is lower than that for patients with the target BSA; however, the size of the blood pump is the same. As a result, in the smaller patients, blood flows more slowly in the VAD system than when it is used in patients with the target BSA, and this may induce thrombus formation in the system. In the present study, we investigated the relationship between BSA and lethal complications such as stroke and infection.
MATERIALS AND METHODS
Patient population
The study protocol was reviewed by the institutional review board and approved as a retrospective study not requiring individual consent.
One hundred and sixty-seven patients who received the BerlinHeart INCOR LVAD at our centre between June 2002 and February 2010 were studied. Patients who received another VAD before INCOR LVAD implantation and those who received a right ventricular assist device or extracorporeal membrane oxygenation just after INCOR LVAD implantation were excluded from the study.
The median age of patients was 57.5 years [range: 17.8–76.2 years; inter-quartile range (IQR): 49.2–63.6 years]. The median BSA was 2.00 m² (range: 1.56–2.47 m²; IQR: 1.87–2.12 m²). Indications for LVAD implantation were bridge to HTx in 59 (35.3%), bridge to HTx candidacy in 67 (40.1%), bridge to recovery in 11 (6.6%) and destination therapy in 30 (18.0%) patients. The INTERMACS level [13] was 2 in 27 (16.2%), 3 in 118 (70.7%) and 4 in 22 (13.2%) patients. A left lateral thoracotomy was performed to implant an LVAD with configuration from the LV apex to the descending aorta, and the median sternotomy was performed for implantation with configuration from the LV apex to the ascending aorta.
The data were obtained from the clinical records of patients. The follow-up study was performed in April 2011, and the survival rates and freedom from endpoint events were studied in each group. The follow-up data were available for all hospital survivors.
Determination of definitive cut-off point of the body surface area
We calculated the P-value of the log-rank test for the Kaplan–Meier probability of freedom from events during mechanical circulatory support (MCS) in two groups (larger and smaller BSAs), divided by a cut-off point of the BSA corresponding to each patient. A line graph showing the relationship between the BSA for the cut-off point and the P-value was obtained. We supposed that the poor prognostic group existed in the lower BSA. We defined the definitive cut-off point as ideally dividing patients into the good prognosis group with the larger BSA and the poor prognosis group with the smaller BSA. If the BSA value of the cut-off point is lower than that of the definitive cut-off point, the good prognosis group with the larger BSA contains some poor prognosis patients with the smaller BSA, and consequently, the P-value increases from that of the definitive cut-off point. Using the line graph showing the relationship between the BSA for the cut-off point and the P-value, we determined the definitive cut-off point on the basis that among the values which indicate the bottom of the ‘valley’, with a decrease in the BSA below this value, the P-value gradually increases.
The events considered for the freedom from events during MCS were: (i) all-cause death, (ii) death due to stroke or systemic bleeding (abbreviated as COAG death), (iii) death due to stroke or systemic bleeding, or urgent HTx due to difficulties of coagulation management (i.e. embolic events or bleeding; abbreviated as COAG death/uHTx), (iv) death due to sepsis (abbreviated as INF death), (v) death due to sepsis, or urgent HTx due to device infection (abbreviated as INF death/uHTx). The number of events in each data set is as follows: 97 events for all-cause death, 35 for COAG death, 50 for COAG death/uHTx, 33 for INF death and 48 for INF death/uHTx.
Statistical analysis
Normally distributed data for continuous variables are expressed as the mean ± standard deviation, and non-normally distributed data were summarized using medians and boundaries of IQR (lower quartile value–upper quartile value). Continuous variables were compared between groups using the Mann–Whitney U-test when data were non-normally distributed. When data were normally distributed with equal variances, the t-test was used for the comparison, and when equal variances were not assumed, the Welch test was used. Categorical variables were compared between groups using the χ2 test. Survival analysis was performed with the Kaplan–Meier method and survival curves were compared by the log-rank test.
Univariate Cox regression models were used to estimate the relative risk associated with each covariate for the endpoint events. Variables achieving P < 0.10 in univariate analysis were then tested in a multivariate Cox regression model to determine the independent prognostic factors for the endpoint events. A backward selection procedure was used; among the variables entered into the multivariate model, the least significant variable was removed in a stepwise fashion until no non-significant variables remained.
All comparisons were considered statistically significant when the P-value was <0.05.
RESULTS
The Kaplan–Meier curves for the freedom from the endpoint events (all-cause death, COAG death, COAG death/uHTx, INF death and INF death/uHTx) during MCS in 167 patients are shown in Fig. 1A and B. The all-cause mortality rate after 2 years of MCS was 58.7%, and the COAG death rate and the INF death rate after 2 years were 26.4 and 28.5%, respectively.
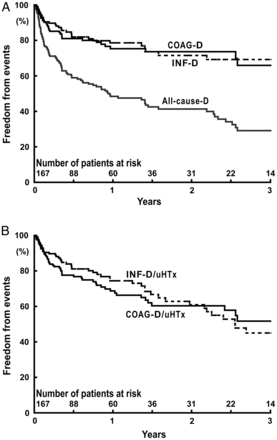
Freedom from events during MCS in 167 patients. (A) The events are all-cause death (All-cause-D), death due to stroke or systemic bleeding (COAG-D) and death due to sepsis (INF-D). (B) The events are death due to stroke or systemic bleeding, or urgent heart transplantation due to difficulties of coagulation management (COAG-D/uHTx) and death due to sepsis, or urgent heart transplantation due to device infection (INF-D/uHTx).
Line graphs showing the relationship between the BSA and the P-value of the log-rank test for the Kaplan–Meier probability of freedom from events are shown in Fig. 2. For freedom from COAG death, a definitive cut-off point existed and this was a BSA of 1.867 m² (indicated as d in Fig. 2B). For freedom from COAG death/uHTx, the definitive cut-off point was also a BSA of 1.867 m² (indicated as g in Fig. 2C). For freedom from INF death (Fig. 2D) and for freedom from INF death/uHTx (Fig. 2E), no definitive cut-off point was found.
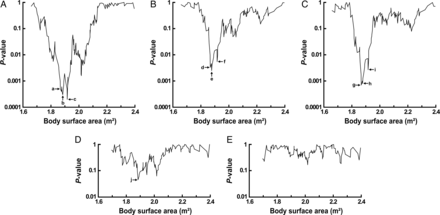
Line graphs showing the relationship between the BSA and the P-value of the log-rank test for the Kaplan–Meier probability of freedom from events. The events are (A) all-cause mortality, (B) death due to stroke or systemic bleeding, (C) death due to stroke or systemic bleeding, or urgent heart transplantation due to difficulties of coagulation management, (D) death due to sepsis and (E) death due to sepsis, or urgent heart transplantation due to device infection. Coordinate values (BSA, P-value) for the points indicated by arrows are a (1.867, 0.0005), b (1.884, 0.0003), c (1.916, 0.0002), d (1.867, 0.0033), e (1.877, 0.0025), f (1.916, 0.0055), g (1.867, 0.0007), h (1.877, 0.0008), i (1.916, 0.0027) and j (1.884, 0.046).
Patients were divided by the definitive cut-off point, i.e. a BSA of 1.867 m², into two groups: Group S (BSA < 1.867, n = 42) and Group L (BSA ≥ 1.867, n = 125). One-year survival during MCS was 21.8% in Group S and 57.5% in Group L (P = 0.0005; Fig. 3A). One-year freedom from COAG death during MCS was 49.1% in Group S and 82.7% in Group L (P = 0.0033; Fig. 3B). One-year freedom from COAG death/uHTx during MCS was 43.0% in Group S and 76.3% in Group L (P = 0.0007; Fig. 3C).
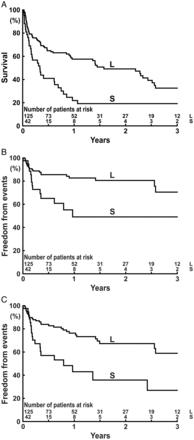
Actuarial survival (A) or freedom from events (B and C) during MCS in Group S and Group L. Events are (B) death due to stroke or systemic bleeding or (C) death due to stroke or systemic bleeding, or urgent heart transplantation due to difficulties of coagulation management. The P-value for each comparison of the Kaplan–Meier curves is (A) P = 0.0005, (B) P = 0.0033 and (C) P = 0.0007.
The characteristics of patients in Group S and Group L before VAD implantation, preoperative data for LVAD implantation and the surgical approach used in patients of these groups are given in Table 1.
Characteristics of patients of Group S and Group L
| Group S (n = 42) | Group L (n = 125) | P-value | |
|---|---|---|---|
| BSA [m2; median (inter-quartile range)] | 1.77 (1.70–1.82) | 2.06 (1.97–2.16) | <0.0001 |
| Age [years; median (inter-quartile range)] | 59.1 (53.4–65.1) | 57.1 (48.4–63.0) | 0.19 |
| Gender [women n (%)] | 14 (33.3) | 1 (0.8) | <0.0001 |
| Body mass index (kg/m2; mean ± SD) | 23.1 ± 2.8 | 27.9 ± 3.9 | <0.0001 |
| Serum creatinine [mg/dl; median (inter-quartile range)] | 1.14 (0.88–1.38) | 1.32 (1.07–1.75) | 0.0047 |
| Total bilirubin [mg/dl; median (range)] | 1.41 (0.97–2.10) | 1.24 (0.82–1.77) | 0.23 |
| AST [IU/l; median (inter-quartile range)] | 32.5 (23.3–62.5) | 38.0 (25.0–93.0) | 0.27 |
| Albumin (g/dl; mean ± range) | 3.15 ± 0.59 | 3.21 ± 0.51 | 0.57 |
| Serum sodium [mmol/l; median (inter-quartile range)] | 133.7 (131.0–136.2) | 134.5 (131.0–137.0) | 0.49 |
| Platelet count [10³/µl; median (range)] | 190.5 (141.3–241.5) | 198.0 (158.0–266.0) | 0.25 |
| INR [median (inter-quartile range)] | 1.30 (1.17–1.55) | 1.31 (1.18–1.61) | 0.92 |
| Ischaemic cardiomyopathy [n (%)] | 15 (35.7) | 43 (34.4) | 0.99 |
| Diabetes mellitus [n (%)] | 12 (28.6) | 46 (36.8) | 0.43 |
| Thrombus in LA or LV [n (%)] | 5 (11.9) | 10 (8.0) | 0.65 |
| HIT II [n (%)] | 0 (0) | 7 (5.6) | 0.26 |
| Medical history [n (%)] | |||
| Systemic hypertension | 14 (33.3) | 32 (25.6) | 0.44 |
| Atrial fibrillation | 14 (33.3) | 58 (46.4) | 0.19 |
| Stroke or TIA | 4 (9.5) | 11 (8.8) | 0.99 |
| INTERMACS level [n (%)] | 0.51 | ||
| Level 1 | 0 (0) | 0 (0) | |
| Level 2 | 9 (21.4) | 18 (14.4) | |
| Level 3 | 27 (64.3) | 91 (72.8) | |
| Level 4 | 6 (14.3) | 16 (12.8) | |
| Levels 5 –7 | 0 (0) | 0 (0) | |
| INTERMACS level 2 [n (%)] | 9 (21.4) | 18 (14.4) | 0.41 |
| Mean PAP ≥ 25 mmHg [n (%)] | 34 (81.0) | 107 (85.6) | 0.64 |
| Cardiac index (l/min/m2; mean ± SD) | 2.29 ± 0.71a | 2.26 ± 0.53b | 0.81 |
| LVEF [%; median (inter-quartile range)] | 17.5 (12.9–20.0) | 15.0 (15.0–20.0) | 0.97 |
| Indication for LVAD implantation [n (%)] | 0.21 | ||
| Bridge to transplant | 11 (26.2) | 48 (38.4) | |
| Bridge to candidacy | 21 (50.0) | 46 (36.8) | |
| Bridge to recovery | 1 (2.4) | 10 (8.0) | |
| Destination therapy | 9 (21.4) | 21 (16.8) | |
| Surgical approach [n (%)] | 0.13 | ||
| Primary sternotomy | 25 (59.5) | 94 (75.2) | |
| Resternotomy | 6 (14.3) | 13 (10.4) | |
| Left lateral thoracotomy | 11 (26.2) | 18 (14.4) | |
Data are expressed as the mean ± standard deviation, median (inter-quartile range) or n (%).
AST: aspartate aminotransferase; HIT II: heparin-induced thrombocytopenia type II; INR: international normalized ratio; LA: left atrium; LV: left ventricle; LVAD: left ventricular assist device; LVEF: left ventricular ejection fraction; PAP: pulmonary artery pressure; TIA: transient ischaemic attack.
an = 37.
bn = 109.
Variables listed in Table 1 were tested in univariate Cox analysis, and hazard ratios of the variables that had achieved P < 0.10 are listed in Table 2. Additionally, hazard ratios of the variables showing statistical difference in the comparison between Group S and Group L are listed in Table 2. Among the variables showing a statistically significant difference in Table 1 (i.e. BSA, female gender, body mass index and serum creatinine), female gender and serum creatinine were not identified as significant risk factors for any endpoint events by univariate Cox regression analysis. The body mass index was identified as a significant risk factor for COAG death/uHTx by univariate analysis. The variable ‘BSA < 1.867 m2’ was identified as a significant risk factor for all-cause death, COAG death and COAG death/uHTx by univariate analysis.
Results of univariate Cox analysis for endpoint events
| All-cause death [HR (95% CI, P-value)] | COAG death [HR (95% CI, P-value)] | COAG death/uHTx [HR (95% CI, P-value)] | INF death [HR (95% CI, P-value)] | INF death/uHTx [HR (95% CI, P-value)] | |
|---|---|---|---|---|---|
| BSA < 1.867 m2 | 2.086 (1.361–3.197, 0.0007) | 2.665 (1.349–5.265; 0.0048) | 2.621 (1.474–4.660, 0.0010) | 1.572 (0.726–3.405, 0.25) | 1.063 (0.512–2.205, 0.87) |
| Age (years) | 1.040 (1.018–1.062, 0.0003) | 1.006 (0.976–1.036, 0.71) | 0.985 (0.962–1.007, 0.18) | 1.077 (1.033–1.123, 0.0005) | 1.027 (0.998–1.058, 0.065) |
| INTERMACS level 2a | 1.808 (1.081–3.024, 0.024) | 1.646 (0.709–3.820, 0.25) | 2.338 (1.199–4.560, 0.013) | 1.575 (0.640–3.879, 0.32) | 1.387 (0.572–3.367, 0.47) |
| Albumin (g/dl) | 0.683 (0.458–1.020, 0.062) | 0.802 (0.415–1.548, 0.51) | 1.211 (0.705–2.081, 0.49) | 0.509 (0.255–1.018, 0.056) | 0.748 (0.423–1.324, 0.32) |
| Body mass index (kg/m2) | 0.967 (0.921–1.014, 0.17) | 0.934 (0.860–1.014, 0.10) | 0.933 (0.871–0.999, 0.045) | 0.978 (0.900–1.062, 0.59) | 0.999 (0.936–1.067, 0.98) |
| Female gender | 1.343 (0.697–2.587, 0.38) | 1.445 (0.510–4.099, 0.49) | 1.569 (0.668–3.687, 0.30) | 0.368 (0.050–2.697, 0.33) | 0.273 (0.038–1.986, 0.20) |
| Serum creatinine (mg/dl) | 1.102 (0.804–1.512, 0.55) | 0.611 (0.315–1.185, 0.15) | 0.835 (0.508–1.373, 0.48) | 1.298 (0.786–2.144, 0.31) | 1.167 (0.742–1.835, 0.51) |
| Indication for LVAD | |||||
| Bridge to transplant | 1 | 1 | 1 | 1 | 1 |
| Bridge to candidacy | 1.357 (0.825–2.231, 0.23) | 2.281 (0.997–5.219, 0.051) | 1.460 (0.787– 2.709, 0.23) | 0.377 (0.134–1.060, 0.064) | 0.531 (0.257–1.097, 0.087) |
| Bridge to recovery | 1.894 (0.823–4.360, 0.13) | 1.736 (0.367–8.202, 0.49) | 0.881 (0.203–3.827, 0.87) | 2.170 (0.705–6.683, 0.18) | 1.402 (0.481–4.086, 0.54) |
| Destination therapy | 2.158 (1.258–3.702, 0.0052) | 1.656 (0.574–4.779, 0.35) | 0.799 (0.315–2.028, 0.64) | 1.907 (0.853–4.265, 0.12) | 1.156 (0.560–2.388, 0.69) |
| Surgical approach | |||||
| Primary sternotomy | 1 | 1 | 1 | 1 | 1 |
| Re-sternotomy | 1.355 (0.730–2.514, 0.34) | 0.783 (0.237–2.585, 0.69) | 0.749 (0.267– 2.097, 0.58) | 1.469 (0.499–4.326, 0.48) | 1.387 (0.578–3.330, 0.46) |
| Left lateral thoracotomy | 1.713 (1.053–2.788, 0.030) | 0.912 (0.351– 2.370, 0.85) | 0.887 (0.396–1.984, 0.77) | 2.548 (1.184–5.484, 0.017) | 1.744 (0.875–3.474, 0.11) |
CI: confidence interval; COAG death: death due to stroke or systemic bleeding; COAG death/uHTx: death due to stroke or systemic bleeding, or urgent heart transplantation due to difficulties of coagulation management (i.e. embolic events or bleeding); HR: hazard ratio; INF death: death due to sepsis; INF death/uHTx: death due to sepsis, or urgent heart transplantation due to device infection.
aINTERMACS level 2 vs levels 3 and 4. P-values less than 0.10 are shown in bold.
Multivariate Cox analysis revealed that a BSA of <1.867 m², INTERMACS level 2 (vs levels 3 and 4) and age were independent risk factors for all-cause death (Table 3). Among these variables, a BSA of <1.867 m² was solely an independent risk factor for COAG death. In addition, a BSA of <1.867 m² was an independent risk factor for COAG death/uHTx. INTERMACS level 2 (vs levels 3 and 4) was also identified as an independent risk factor for COAG death/uHTx. The age was not an independent risk factor for COAG death but was for INF death. Destination therapy (vs other LVAD indications) was entered into the multivariate model for all-cause death. Bridge to candidacy (vs other LVAD indications) was entered into the multivariate model for COAG death, INF death and INF death/uHTx. Finally, bridge to candidacy was identified as an independent prognostic factor for INF death/uHTx, which reduces the risk.
Independent prognostic factors for endpoint events
| Hazard ratio | 95% CI | P-value | |
|---|---|---|---|
| All-cause death | |||
| BSA < 1.867 m2 | 1.977 | 1.277–3.061 | 0.0022 |
| Age (years) | 1.040 | 1.018–1.062 | 0.0003 |
| INTERMACS level 2a | 1.709 | 1.011–2.889 | 0.045 |
| COAG death | |||
| BSA < 1.867 m2 | 2.665 | 1.349–5.265 | 0.0048 |
| COAG death/uHTx | |||
| BSA < 1.867 m2 | 2.449 | 1.370–4.377 | 0.0025 |
| INTERMACS level 2a | 2.076 | 1.058–4.072 | 0.034 |
| INF death | |||
| Age (years) | 1.077 | 1.033–1.123 | 0.0005 |
| INF death/uHTx | |||
| Bridge to candidacyb | 0.493 | 0.251–0.967 | 0.040 |
CI: confidence interval; COAG death: death due to stroke or systemic bleeding; COAG death/uHTx: death due to stroke or systemic bleeding, or urgent heart transplantation due to difficulties of coagulation management (i.e. embolic events or bleeding); INF death: death due to sepsis; INF death/uHTx: death due to sepsis, or urgent heart transplantation due to device infection.
aINTERMACS level 2 vs levels 3 and 4.
bBridge to candidacy vs other indications.
DISCUSSION
Various risk factors for mortality during MCS were identified in previous studies [14–18]. However, the BSA was not one of them. Even when the BSA (lowest quartile) was selected after univariate analysis, it was not identified as an independent risk factor after multivariate analysis [16]. We previously presented worse prognosis in patients with a smaller BSA who received an INCOR LVAD for the purpose of bridge to HTx [19]. In the present study, after increasing the patient number, we investigated whether the lower BSA is an independent risk factor for mortality during MCS with the INCOR LVAD.
On the line graph showing the relationship between the BSA for the cut-off and the P-value of the log-rank test for the Kaplan–Meier probability of freedom from all-cause death (Fig. 2A), it is difficult to determine the definitive cut-off point to discriminate the poor prognosis group of patients with the lower BSA, because the line graph has several valleys. If we use a minimal P-value approach, data point c (BSA = 1.916, P = 0.0002), which corresponds to the bottom of the deepest valley, should be selected as the cut-off point. However, the minimal P-value approach is known to inflate the effect of the prognostic variable in the Cox analysis [20]. Another basis for the choice of the particular cut-off point should be given. We determined the definitive cut-off point on the basis that with a decrease in the BSA below this value, the P-value gradually increases. According to this approach, data point b (BSA = 1.884, P = 0.0003) should be selected as the cut-off point in Fig. 2A. However, data point d (BSA = 1.867, P = 0.0033) in Fig. 2B and data point g (BSA = 1.867, P = 0.0007) in Fig. 2C are also appropriate values to cut off the poor prognosis group. Finally, we chose BSA = 1.867 as the cut-off of the poor prognosis group. The reason is as follows: major causes of death in our patient cohort are COAG death and INF death as shown in Fig. 1A, and the valleys of the line graph in Fig. 2A (all-cause death) are generated after integration of those in Fig. 2B (COAG death) and Fig. 2D (INF death). COAG death is related to a lower BSA as shown in Fig. 2B; however, there is no relationship between INF death and the BSA, as shown in Fig. 2D. Therefore, the cut-off point determined in Fig. 2B (BSA = 1.867) should also be applied in Fig. 2A. The data point b (BSA = 1.884, P = 0.0003) in Fig. 2A (all-cause death) corresponds to j (BSA = 1.884, P = 0.046) in Fig. 2D (INF death), which is a data point of the deepest valley of the line graph. The data point in Fig. 2A which corresponds to data point d in Fig. 2B is data point a (BSA = 1.867, P = 0.0005), which does not lie at the bottom of the valley of the line graph.
The BSA of 1.867 was determined as the cut-off point to discriminate the poor prognosis group, which corresponds to the lowest quartile in our patient cohort. The value of 1.867 m2 as a cut-off point is effective in the present study, although this value may change if the number of patients increases in our study cohort or if the matter is studied in other institutes where the strategy for VAD implantation and the healthcare system are different from ours. The important thing is that the lower BSA is a risk factor for COAG death and accordingly a risk factor for all-cause death during the INCOR LVAD support.
Mortality during MSC is a combination of deaths due to various causes, each of which may have a dominant covariate for the prediction of death. The lower BSA is a dominant covariate for the prediction of COAG death and the age is one for INF death (Table 3). As a result, the lower BSA and the age have been identified as independent risk factors for all-cause death, which consists mainly of COAG death and INF death. If in other studies, COAG death represents a smaller proportion of all-cause death, the lower BSA may not be recognized as an independent risk factor for all-cause death. Actually, death due to stroke or bleeding (COAG death) accounts for 12.3–19.9% of all-cause deaths in other studies [16, 17], in which the BSA is not an independent risk factor, whereas in the present study, the COAG death accounts for 35 of 97 (36.1%) all-cause deaths.
The left lateral thoracotomy for the implantation of the INCOR LVAD with configuration from the LV apex to the descending aorta was a significant risk factor for all-cause death and INF death in univariate Cox analysis; however, it was not a risk factor for COAG death or COAG death/uHTx. When the LVAD is implanted by the lateral thoracotomy, kinking or deformation of the inflow or outflow cannula after a postural change may induce thrombus formation in the cannulae. However, the cannulae of the INCOR LVAD are made of hard silicon rubber and they may be resistant to such kinking or deformation. In addition, there is a risk of thrombus formation in the aortic root due to the stagnation of the blood flow when the outflow cannula is anastomosed to the descending aorta and the aortic valve remains closed during MCS [21, 22]. In the present study, there were no patients with INTERMACS level 1 (critical cardiogenic shock) in the study cohort and if there was some ejection flow from the LV, the risk of thrombus formation in the aortic root should have been reduced.
The median BSA of female patients was 1.75 m2 (range: 1.57–1.92 m2; IQR: 1.69–1.78 m2) and most of the female patients (15 of 16, 93.8%) belonged to Group S. Female patients with an LVAD were reported to have worse prognosis after LVAD implantation; however, this worse survival was due to more severe medical status before LVAD implantation in women than in men, and gender was not an independent predictor of survival after LVAD implantation [23]. In our study, female gender was not identified as a significant risk factor for any endpoint events (all-cause death, COAG death, COAG death/uHTx, INF death and INF death/uHTx) in univariate Cox regression analysis.
In the present study, it has been revealed that lower BSA is a risk factor for COAG death and accordingly a risk factor for all-cause death during the INCOR LVAD support. The cause, we suppose, may be thrombus formation in the system due to a lower flow rate through the pump in the smaller adult patients than in patients with the target BSA (1.9–2.0 m2). Another possible cause could be anatomical. In the smaller body, the possibility of kinking or the deformation of the LVAD inflow and outflow cannulae may be higher than in the larger body; however, the cannulae of the INCOR LVAD are made of hard silicon rubber, which is resistant to such problems. If malposition of the inflow cannula within the LV cavity should occur more often in smaller adults after the operation, especially after the decrease in LV size, this anatomical reason would be supported; however, we do not have such data.
Each type of LVAD may have an intrinsic value of the BSA for the bottom of the valley (as shown in Fig. 2) which discriminates the poor prognosis group with the smaller BSA from the good prognosis group with the larger BSA. Among the existing LVADs, if there is one that can be shown to cover the smaller adults, we should use it. Otherwise, the development of an LVAD targeted at the BSA of smaller adults is necessary.
As a limitation of this study, its design is retrospective and observational and it, therefore, has the inherent bias of a retrospective study. In the line graph showing the relationship between the BSA and the P-value of the log-rank test (Fig. 2), in order to connect each data point, adjacent data should be distinguished and for that purpose, the BSA was calculated up to three decimal places (e.g. 1.867 m2). However, the number of significant figures of the BSA in our study was three (two decimal places). Therefore, to be accurate, the BSA of 1.867 m2 for the definitive cut-off point should be expressed as 1.87 m2. As each data point corresponding to each patient was plotted in the line graph, there is fluctuation in the data. If we can smooth out the fluctuations in some way, the bottom of the valley that discriminates the poor prognosis group with the smaller BSA from the good prognosis group with the larger BSA will lie at around 1.87–1.88 m2.
ACKNOWLEDGEMENTS
We are indebted to Julia Stein, of the Deutsches Herzzentrum Berlin, for her valuable advice in the statistical analysis of this study. We also thank Anne M. Gale, Editor in the Life Sciences, of the Deutsches Herzzentrum Berlin for her editorial assistance and Detlef Goesmann for support with data acquisition.
Conflict of interest: none declared.
