


Abstract
This prespecified subgroup analysis examined the effect of diabetes on left main coronary disease (LM) and/or three-vessel disease (3VD) in patients treated with percutaneous coronary intervention (PCI) or coronary artery bypass grafting (CABG) in the SYNTAX trial.
Patients (n = 1800) with LM and/or 3VD were randomized to receive either PCI with TAXUS Express paclitaxel-eluting stents or CABG. Five-year outcomes in subgroups with (n = 452) or without (n = 1348) diabetes were examined: major adverse cardiac or cerebrovascular events (MACCE), the composite safety end-point of all-cause death/stroke/myocardial infarction (MI) and individual MACCE components death, stroke, MI and repeat revascularization. Event rates were estimated with Kaplan–Meier analyses.
In diabetic patients, 5-year rates were significantly higher for PCI vs CABG for MACCE (PCI: 46.5% vs CABG: 29.0%; P < 0.001) and repeat revascularization (PCI: 35.3% vs CABG: 14.6%; P < 0.001). There was no difference in the composite of all-cause death/stroke/MI (PCI: 23.9% vs CABG: 19.1%; P = 0.26) or individual components all-cause death (PCI: 19.5% vs CABG: 12.9%; P = 0.065), stroke (PCI: 3.0% vs CABG: 4.7%; P = 0.34) or MI (PCI: 9.0% vs CABG: 5.4%; P = 0.20). In non-diabetic patients, rates with PCI were also higher for MACCE (PCI: 34.1% vs CABG: 26.3%; P = 0.002) and repeat revascularization (PCI: 22.8% vs CABG: 13.4%; P < 0.001), but not for the composite end-point of all-cause death/stroke/MI (PCI: 19.8% vs CABG: 15.9%; P = 0.069). There were no differences in all-cause death (PCI: 12.0% vs CABG: 10.9%; P = 0.48) or stroke (PCI: 2.2% vs CABG: 3.5%; P = 0.15), but rates of MI (PCI: 9.9% vs CABG: 3.4%; P < 0.001) were significantly increased in the PCI arm in non-diabetic patients.
In both diabetic and non-diabetic patients, PCI resulted in higher rates of MACCE and repeat revascularization at 5 years. Although PCI is a potential treatment option in patients with less-complex lesions, CABG should be the revascularization option of choice for patients with more-complex anatomic disease, especially with concurrent diabetes.
INTRODUCTION
The global prevalence of diabetes mellitus has continuously increased over the last decades, currently affecting more than 347 million people [1, 2]. Diabetes is a common co-morbidity in patients with coronary artery disease who are evaluated for revascularization, and is shown to be a predictor of adverse events during follow-up after coronary artery bypass grafting (CABG) and percutaneous coronary intervention (PCI) [3–5]. However, long-term data from randomized trials are limited, particularly for the comparison between CABG and PCI with drug-eluting stents.
The Synergy Between Percutaneous Coronary Intervention With TAXUS and Cardiac Surgery (SYNTAX) trial compared PCI with paclitaxel-eluting stents (PES) and CABG for patients with de novo three-vessel and/or left main disease [6, 7]. Prespecified subgroup analyses of diabetic vs non-diabetic patients have been reported at 1- and 3-year follow-up [8, 9]. This study examined the impact of diabetes on 5-year outcomes after PCI and CABG.
METHODS
Study design
The design and methods of the SYNTAX trial have been reported previously [10]. It was a prospective multinational randomized (1:1) trial in which 1800 patients with de novo three-vessel and/or left main coronary artery disease were randomly assigned to undergo PCI with TAXUS Express paclitaxel-eluting stents (Boston Scientific, Natick, MA, USA) or CABG. Based on the clinical judgment and consensus of a multidisciplinary Heart Team consisting of a cardiovascular surgeon and an interventional cardiologist [11], patients with anticipated clinical revascularization equipoise through PCI and CABG were randomized (CABG: n = 897, PCI: n = 903). Those with expected unfavourable outcomes for PCI or CABG were included in the CABG-ineligible PCI registry (n = 198) or PCI-ineligible CABG registry (n = 1077), respectively [12]. Five-year clinical follow-up was completed by a clinic visit or telephone call in 86.5% of CABG patients and 94.5% of PCI patients. Follow-up was complete (clinical follow-up or death) in 88.0 and 95.2%, respectively.
Randomization was stratified according to the status of diabetes and left main disease. The subgroup analysis according to diabetes status was prespecified in the trial protocol, although no formal statistical hypothesis was defined a priori.
The institutional review board of each of the 85 participating cites approved the protocol. All patients provided written informed consent before enrolment. The trial is registered on the National Institute of Health website with identifier NCT00114972.
Definitions
Medically treated diabetes was defined as treatment with oral hypoglycaemic agents or insulin at the time of enrolment. The composite end-point of major adverse cardiac or cerebrovascular events (MACCE) included all-cause death, cerebrovascular accident (CVA), myocardial infarction (MI) or repeat revascularization (subsequent PCI or CABG). Cerebrovascular events, or stroke, were defined as focal neurological deficits of central origin lasting >72 h, resulting in permanent brain damage or body impairment. MI was defined in relation to intervention status as follows: (i) after allocation but before treatment: Q-wave [new pathological Q-waves in ≥2 leads lasting ≥0.04 s with creatine kinase-MB (CK-MB) levels elevated above normal] and non-Q-wave MI [elevation of CK levels >2× the upper limit of normal (ULN) with positive CK-MB or elevation of CK levels to >2× ULN without new Q-waves if no baseline CK-MB was available]; (ii) <7 days after intervention: new Q-waves and either peak CK-MB/total CK >10% or plasma level of CK-MB 5× ULN and (iii) ≥7 days after intervention: new Q-waves or peak CK-MB/total CK >10% or plasma level of CK-MB 5× ULN or plasma level of CK 5× ULN. The CK/CK-MB enzyme levels were obtained and measured by a core laboratory for all randomized patients. An independent Clinical Event Committee adjudicated the events.
Statistical analysis
All analyses were according to the intention-to-treat principle and performed using SAS software version 8.0 or higher (SAS Institute, Cary, NC, USA). Data are summarized using descriptive statistics, presented as proportions (%, count/sample size) or mean ± standard deviation. Continuous variables were compared using the Student's t-test; differences in discrete variables were assessed with the χ2 test or Fisher's exact test, where appropriate. Time-to-event Kaplan–Meier estimates with log-rank testing were used to compare PCI and CABG in diabetic and non-diabetic patients, and to compare diabetics vs non-diabetics in PCI and CABG groups. P-values for interaction were generated by logistic regression χ2 test. Post hoc subgroup analyses according to SYNTAX Score tertiles (low: 0–22, intermediate: 23–32, high: ≥33) were performed using time-to-event Kaplan–Meier estimates [13]. Univariate analysis, including a combination of preoperative and intraoperative variables, was used to identify potential predictors of 5-year outcomes. Subsequently, multivariate predictors of MACCE, the composite safety end-point of all-cause death/stroke/MI, and repeat revascularization after PCI and CABG were identified using stepwise selection with a significance level of <0.10 for entry and exit in a logistic regression model. A P-value <0.05 was considered to be statistically significant.
RESULTS
Baseline characteristics
In the SYNTAX trial, 1800 patients were randomly assigned to PCI (n = 903) and CABG (n = 897), producing two well-matched treatment groups [6]. Compared with non-diabetic patients (n = 1348), those with diabetes (n = 452) had a significantly higher risk profile, which was reflected in a higher EuroSCORE of 4.0 ± 2.7 vs 3.7 ± 2.6, respectively (P = 0.027) (Table 1). Diabetics also had more coronary lesions (4.6 ± 1.8 vs 4.3 ± 1.8, P = 0.003) and a trend towards more diffuse disease or small vessels (13 vs 10%, P = 0.061), although the mean SYNTAX Score was comparable with non-diabetics (29.0 ± 11.2 vs 28.6 ± 11.5, P = 0.52).
Baseline characteristics
| Non-diabetic (n = 1348) | Diabetic (n = 452) | P-value | |
|---|---|---|---|
| Age (years) | 65.0 ± 9.9 (1348) | 65.4 ± 9.2 | 0.049 |
| Male gender | 79.9 (1077/1348) | 71.0 (321/452) | <0.001 |
| Comorbid risk factors | |||
| Body mass index (kg/m2) | 27.5 ± 4.4 | 29.5 ± 5.2 | <0.001 |
| Metabolic syndromea | 37% (398/1064) | 70% (258/369) | <0.001 |
| Waist >40 in. for male, >35 in. for female | 42% (502/1194) | 61% (238/393) | <0.001 |
| Triglycerides ≥150 mg/dlb | 33% (409/1230) | 42% (170/408) | 0.002 |
| HDL <40 mg/dl male, <50 mg/dl femaleb | 45% (544/1199) | 61% (238/389) | <0.001 |
| Blood pressure ≥130/85 mmHg | 65% (80/1348) | 70% (316/452) | 0.071 |
| Fasting glucose ≥110 mg/dl | 28% (260/934) | 82% (286/348) | <0.001 |
| Haemoglobin A1c ≥7.0%b | 3% (31/1179) | 57% (215/378) | <0.001 |
| Hyperlipidaemia | 77% (1029/1341) | 82% (362/444) | 0.035 |
| Medically treated diabetes | 0% (0/1348) | 100% (452/452) | <0.001 |
| Insulin-requiring diabetes | 0% (0/1348) | 40% (182/452) | <0.001 |
| Cardiovascular history | |||
| Current smoker | 22% (292/1343) | 16% (71/450) | 0.006 |
| Prior myocardial infarction | 33% (442/1333) | 32% (143/447) | 0.65 |
| Congestive heart failure | 4% (50/1334) | 7% (33/444) | 0.001 |
| Carotid artery disease | 7% (99/1348) | 11% (49/452) | 0.019 |
| Prior cerebrovascular accident | 4% (51/1341) | 6% (27/448) | 0.046 |
| Prior transient ischaemic attack | 4% (58/1341) | 6% (26/448) | 0.20 |
| Peripheral vascular disease | 8% (111/1348) | 15% (66/452) | <0.001 |
| Creatinine >200 μmol/l | 1% (13/1348) | 3% (13/452) | 0.003 |
| Unstable angina | 28% (378/1348) | 30% (134/452) | 0.51 |
| LVEF <30%c | 2% (21/1348) | 3% (13/452) | 0.075 |
| Parsonnet score | 7.5 ± 6.8 | 11.3 ± 6.4 | <0.001 |
| Additive EuroSCOREd | 3.7 ± 2.6 | 4.0 ± 2.7 | 0.027 |
| Lesion complexity | |||
| Diffuse disease or small vesselsb | 10% (136/1338) | 13% (60/449) | 0.061 |
| SYNTAX scoreb | 28.6 ± 11.5 | 29.0 ± 11.2 | 0.52 |
| Lesion characteristics | |||
| Number of lesionsb | 4.3 ± 1.8 | 4.6 ± 1.8 | 0.003 |
| Left main, anyb | 36% (480/1338) | 29% (130/449) | 0.007 |
| Left main only | 4% (52/1338) | 2% (10/449) | 0.096 |
| Left main + 1-vessel | 6% (75/1338) | 4% (18/449) | 0.19 |
| Left main + 2-vessel | 12% (160/1338) | 11% (50/449) | 0.64 |
| Left main + 3-vessel | 14% (193/1338) | 12% (52/449) | 0.13 |
| Three-vessel disease onlyb | 64% (858/1338) | 71% (319/449) | 0.007 |
Values are shown as mean ± SD (n) or % (n/N). Reprinted from Ref. [8].
HDL: high-density lipoprotein; LVEF: left ventricular ejection fraction.
aMetabolic syndrome was defined as at least three of the following: (i) waist circumference >40 in. for male or >35 in. for female; (ii) triglycerides ≥150 mg/dl; (iii) high-density lipoprotein <40 mg/dl for male or <50 mg/dl for female; (iv) blood pressure ≥130/85 mmHg and (v) fasting glucose ≥110 mg/dl [25].
bCore laboratory reported.
cOr indicated by clinical site as ‘poor’ if exact value was not available.
dAdditive EuroSCORE calculated from site-reported baseline data.
Diabetes status subgroups
Table 2 lists the clinical outcomes according to diabetes status and treatment arm. The rate of MACCE was significantly different between CABG and PCI among both non-diabetic and diabetic patients (Fig. 1). There were no differences in the composite safety end-point of all-cause death/stroke/MI in non-diabetic or diabetic patients. Rates of all-cause death were similar among non-diabetic CABG and PCI patients [HR = 1.12 (95% CI 0.81–1.55), P = 0.48], and diabetic patients [HR = 1.57 (95% CI 0.97–2.55), P = 0.065]. Cardiac death was significantly more frequent in patients treated with PCI than those who underwent CABG, in non-diabetics [HR = 1.62 (95% CI 1.03–2.55); P = 0.035] and diabetics [HR = 2.01 (95% CI 1.04–3.88); P = 0.034]. Increased repeat revascularization after PCI when compared with CABG was present in non-diabetic [HR = 1.82 (95% CI 1.39–2.38); P < 0.001] and diabetic [HR = 2.75 (95% CI 1.78–4.24); P < 0.001] patients. There was a significantly higher rate of MI after PCI than after CABG in non-diabetic patients [HR = 2.90 (95% CI 1.79–4.70); P < 0.001], but this was not significant in diabetic patients [HR = 1.62 (95% CI 0.77–3.41); P = 0.20]. There were no differences in stroke or graft occlusion/stent thrombosis between groups.
Five-year clinical outcomes according to diabetes status
| Clinical outcome | Non-diabetic (n = 1348) | Diabetic (n = 452) | Non-diabetic vs diabetic | ||||||
|---|---|---|---|---|---|---|---|---|---|
| CABG (n = 676) | PCI (n = 672) | P-value | CABG (n = 221) | PCI (n = 231) | P-value | P-value (CABG) | P-value (PCI) | Interaction P-valuea | |
| MACCEb | 26.3% (167) | 34.1% (226) | 0.002 | 29.0% (59) | 46.5% (105) | <0.001 | 0.37 | <0.001 | 0.17 |
| All-cause death/stroke/myocardial infarction | 15.9% (101) | 19.8% (131) | 0.069 | 19.1% (39) | 23.9% (54) | 0.26 | 0.25 | 0.18 | 0.76 |
| All-cause death | 10.9% (68) | 12.0% (79) | 0.48 | 12.9% (26) | 19.5% (44) | 0.065 | 0.34 | 0.003 | 0.43 |
| Cardiac death | 4.9% (30) | 7.7% (50) | 0.035 | 6.5% (13) | 12.7% (28) | 0.034 | 0.31 | 0.018 | |
| Stroke | 3.5% (22) | 2.2% (14) | 0.15 | 4.7% (9) | 3.0% (6) | 0.34 | 0.49 | 0.55 | 0.97 |
| Myocardial infarction | 3.4% (22) | 9.9% (64) | <0.001 | 5.4% (11) | 9.0% (19) | 0.20 | 0.22 | 0.66 | 0.18 |
| Repeat revascularization | 13.4% (82) | 22.8% (145) | <0.001 | 14.6% (28) | 35.3% (75) | <0.001 | 0.60 | <0.001 | 0.081 |
| PCI | 12.9% (78) | 19.3% (123) | 0.001 | 12.9% (24) | 28.5% (60) | <0.001 | 0.95 | 0.004 | |
| CABG | 1.1% (7) | 5.8% (36) | <0.001 | 1.9% (4) | 8.7% (18) | 0.004 | 0.35 | 0.12 | |
| Graft occlusion/stent thrombosis | 3.9% (24) | 5.6% (36) | 0.14 | 4.3% (8) | 5.3% (11) | 0.61 | 0.84 | 0.84 | 0.73 |
Data are Kaplan–Meier time-to-event estimates expressed as % (n); log-rank P-value.
CABG: coronary artery bypass grafting; MACCE: major adverse cardiac or cerebrovascular events; PCI: percutaneous coronary intervention.
aBinary logistic regression interaction term for diabetes status by treatment arm.
bMACCE consists of all-cause death, stroke, myocardial infarction, or repeat revascularization (CABG or PCI) in any vessel.
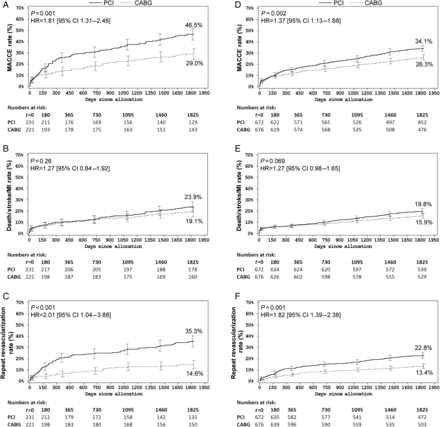
Five-year outcomes of percutaneous coronary intervention vs coronary artery bypass grafting in diabetic and non-diabetic patients. Kaplan–Meier estimates of (A and D) major adverse cardiac or cerebrovascular events (MACCE), (B and E) the composite end-point of all-cause death/stroke/myocardial infarction and (C and F) repeat revascularization in diabetic patients (A–C) and non-diabetic patients (D–F). CABG: coronary artery bypass grafting (dotted lines); PCI: percutaneous coronary intervention (solid lines).
Although patients with diabetes who underwent CABG had numerically higher rates of clinical adverse events than non-diabetic CABG patients, there were no statistically significant differences at 5-year follow-up. However, diabetic patients who underwent PCI had significantly higher rates of MACCE (P < 0.001), death (P = 0.003) and repeat revascularization (P < 0.001) than non-diabetic patients. There were no significant interactions between diabetes status and treatment.
Diabetes control subgroups
Subgroup analyses according to diabetes treatment (oral hypoglycaemic agents or insulin) (Table 3) showed that the MACCE rate was significantly increased after PCI in the group on oral hypoglycaemic agents (PCI: 40.4% vs CABG: 26.4%; P = 0.022) and insulin (PCI: 56.2% vs CABG: 32.6%; P = 0.002). Rates of repeat revascularization were also higher in both the insulin-dependent and the oral hypoglycaemic groups (PCI: 29.9% vs CABG: 12.0%; P < 0.001 and PCI: 44.3% vs CABG: 18.1%; P = 0.001, respectively). However, the composite safety end-point of all-cause death/stroke/MI was comparable between PCI and CABG in the group on oral hypoglycaemic agents (PCI: 18.8% vs CABG: 17.7%; P = 0.92), although there was a significantly higher rate of cardiac death (PCI: 18.8% vs CABG: 7.1%; P = 0.023) in patients who underwent PCI. There were no differences in stroke or MI in the groups of patients on oral hypoglycaemic agents or insulin.
Five-year clinical outcomes according to diabetes treatment
| Clinical outcome | Oral hypoglycaemic agents (n = 270) | Insulin (n = 452) | Oral vs insulin treatment | Interaction P-valuea | |||||
|---|---|---|---|---|---|---|---|---|---|
| CABG (n = 128) | PCI (n = 142) | P-value | CABG (n = 93) | PCI (n = 89) | P-value | P-value (CABG) | P-value (PCI) | ||
| MACCEb | 26.4% (31) | 40.4% (56) | 0.022 | 32.6% (28) | 56.2% (49) | 0.002 | 0.37 | 0.023 | 0.34 |
| All-cause death/stroke/myocardial infarction | 17.7% (21) | 18.8% (26) | 0.92 | 21.0% (18) | 32.1% (28) | 0.091 | 0.65 | 0.018 | 0.25 |
| All-cause death | 12.0% (14) | 16.6% (23) | 0.32 | 14.0% (12) | 24.1% (21) | 0.082 | 0.70 | 0.15 | 0.53 |
| Cardiac death | 6.0% (7) | 8.9% (12) | 0.42 | 7.1% (6) | 18.8% (16) | 0.023 | 0.79 | 0.030 | |
| Stroke | 5.2% (6) | 1.6% (2) | 0.094 | 4.0% (3) | 5.2% (4) | 0.65 | 0.56 | 0.13 | 0.17 |
| Myocardial infarction | 5.1% (6) | 7.5% (10) | 0.49 | 5.7% (5) | 11.6% (9) | 0.23 | 0.83 | 0.34 | 0.76 |
| Repeat revascularization | 12.0% (13) | 29.9% (40) | <0.001 | 18.1% (15) | 44.3% (35) | 0.001 | 0.19 | 0.063 | >0.99 |
| PCI | 12.9% (78) | 24.8% (33) | 0.004 | 15.0% (12) | 34.6% (27) | 0.005 | 0.41 | 0.21 | |
| CABG | 1.1% (7) | 7.0% (9) | 0.020 | 3.3% (3) | 11.6% (9) | 0.064 | 0.19 | 0.23 | |
| Graft occlusion/stent thrombosis | 5.7% (6) | 3.2% (4) | 0.35 | 2.5% (2) | 8.6% (7) | 0.081 | 0.30 | 0.072 | 0.046 |
Data are Kaplan–Meier time-to-event estimates expressed as % (n); log-rank P-value.
CABG: coronary artery bypass grafting; MACCE: major adverse cardiac or cerebrovascular events; PCI: percutaneous coronary intervention.
aBinary logistic regression interaction term for diabetes status by treatment arm.
bMACCE consists of all-cause death, stroke, myocardial infarction or repeat revascularization (CABG or PCI) in any vessel.
The rate of graft occlusion or stent thrombosis was not significantly different in the oral hypoglycaemic agents group (PCI: 3.2% vs CABG: 5.7%; P = 0.35) or the patients who were on insulin (PCI: 8.6% vs CABG: 2.5%; P = 0.081). However, the interaction term was statistically significant (P = 0.046), suggesting a different impact of diabetes treatment effect on outcomes after PCI and CABG. None of the interaction terms for the other outcomes was significant.
SYNTAX score subgroups
Subgroup analyses according to the complexity of coronary artery disease demonstrated that there was a consistent increase in adverse events after PCI with increasing SYNTAX Scores, while this was not the case for CABG patients (Fig. 2). Event rates of MACCE and the composite safety end-point therefore showed a stepwise increase in the difference between PCI and CABG with increasing SYNTAX Scores, irrespective of the diabetes status. Among non-diabetic patients, the rates of repeat revascularization showed a similar trend as for MACCE and the composite safety end-point. However, in diabetic patients even in the low SYNTAX Score tertile, there was a significantly higher event rate after PCI than after CABG (PCI: 39.4% vs CABG: 17.2%; P = 0.006).
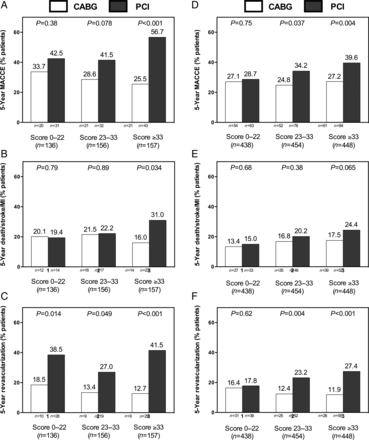
Five-year outcomes for diabetic patients and nondiabetic patients according to anatomic lesion complexity, as measured by the SYNTAX Score. Binary event rates of (A and D) major adverse cardiac or cerebrovascular events (MACCE), (B and E) the composite end-point of all-cause death/stroke/myocardial infarction and (C and F) repeat revascularization in diabetic (A–C) and non-diabetic patients (D–F). Rates are separated according to SYNTAX Score tertiles, indicating low (0–22), intermediate (23–32) and high (≥33) anatomic lesion complexity. CABG: coronary artery bypass grafting (open bars); PCI: percutaneous coronary intervention (solid bars).
Multivariate analysis
The final multivariate model did not identify medically treated diabetes as an independent predictor in the CABG cohort. However, for patients who underwent PCI, medically treated diabetes was an independent predictor of MACCE (OR = 1.71 [95% CI 1.22–2.39]; P = 0.002) and repeat revascularization (OR = 1.73 [95% CI 1.27–2.36]; P < 0.001), but not for the composite safety end-point of all-cause death/stroke/MI.
DISCUSSION
This study examined the impact of diabetes on clinical outcomes after PCI and CABG in the SYNTAX trial. The rates of MACCE were significantly higher after PCI as compared to CABG in both the diabetic and the non-diabetic patient subgroups, and this difference is mainly driven by an increase in repeat revascularization. However, the difference between PCI and CABG is larger for patients with diabetes than for those without. In contrast to the previous 1- and 3-year follow-up reports, patients who underwent PCI also had significantly higher rates of cardiac death at 5 years.
Randomized comparisons between PCI and CABG for the treatment of coronary artery disease in diabetic patients have mainly been limited by subgroup analyses of large trials. These trials found no significant difference in long-term survival between the two treatment strategies for diabetic patients but were underpowered and limited by being post hoc exploratory subgroup analyses. The only analysis that found a significant benefit of CABG over PCI from the BARI trial included 353 patients and reported 10-year survival rates of 57.9 and 45.5% (P = 0.025), respectively [14]. These data of 10 randomized trials (of which only four used bare-metal stents) were summarized in a meta-analysis of 7794 patients, demonstrating that CABG is superior over PCI in diabetic patients [3]. A pooled analysis of trials exclusively using stents showed no difference in outcomes between PCI and CABG, irrespective of diabetes status [15]. The debate between PCI and CABG remained ongoing, but the introduction of drug-eluting stents was promising since it showed a reduction in the rate of restenosis in diabetic patients [16, 17]. This drove new analyses of CABG vs PCI with drug-eluting stents. Although results were indeed better with drug-eluting stents, PCI failed to reach non-inferiority to CABG in the first randomized trial dedicated to patients with diabetes (CARDia) [18]. Recently, the results from the randomized FREEDOM trial (n = 1900) even showed that CABG was superior to drug-eluting stents for the composite primary end-point of death, stroke and MI (P = 0.005) [19].
This substudy of the SYNTAX trial was also from a hypothesis-generating subgroup analysis and, although predefined, should be interpreted with caution. Nevertheless, the results are similar to that from the CARDia and FREEDOM trials [18, 19]. There was a significant difference between PCI and CABG in clinical outcomes, which was more pronounced in diabetic than non-diabetic patients. This suggests that diabetes may be more relevant in PCI patients than in CABG patients. Clinical outcomes in CABG patients were similar for diabetic and non-diabetic patients, while outcomes after PCI were significantly worse for diabetic when compared with non-diabetic patients. A reason for this might be that a patent distal graft functions as protection for future more proximal lesions caused by progressing diffuse disease. After PCI, progression of diffuse disease in diabetic patients forms new lesions that may cause ischaemia and/or symptoms. This may also explain why diabetes was not an independent predictor of MACCE after CABG in the SYNTAX trial [20, 21].
Analyses according to diabetes control show that insulin-dependent diabetic patients are particularly at higher risk of adverse events during follow-up. Diabetic patients on insulin who underwent PCI had significantly higher rates of MACCE, the composite safety end-point of all-cause death/stroke/MI, and cardiac death than patients on oral hypoglycaemic agents who underwent PCI. Apart from MACCE and repeat revascularization, there were no significant differences between PCI and CABG for patients on oral hypoglycaemic agents. In contrast, compared with insulin-dependent patients who underwent CABG, those who underwent PCI had significantly more cardiac deaths (P = 0.023). Therefore, the Heart Team may particularly advocate for CABG to treat insulin-dependent patients, while it should be carefully assessed whether PCI should be preferred over medical therapy for insulin-dependent patients unsuitable for CABG. The SYNTAX trial did not include a medical therapy treatment arm, but it will be interesting to see what the new developments in improved antiplatelet therapy (e.g. prasugrel, ticagrelor) will contribute to the debate regarding PCI vs medical therapy for diabetics with complex coronary disease.
The complexity of coronary artery disease is crucial when considering different revascularization options. In contrast to the results from the FREEDOM trial where there was no treatment-by-SYNTAX Score interaction [19], previous studies found that the SYNTAX Score was a predictor of adverse events after PCI but not after CABG. In the current study, differences in outcomes increased incrementally with lesion complexity, even more so in diabetics than non-diabetics. However, recent evidence suggests that a Logistic Clinical SYNTAX Score—consisting of the SYNTAX Score, age, creatinine clearance and left ventricular ejection fraction—is a better predictor of 1-year all-cause death than the SYNTAX Score itself [22]. The addition of diabetes resulted in little improvement of the model performance of the Logistic Clinical SYNTAX Score. Nevertheless, in our study, the presence of diabetes seems to reinforce the superiority of CABG over PCI and current SYNTAX Score thresholds may need to be adjusted for patients with diabetes.
According to the SYNTAX study, CABG should remain the gold standard for patients with complex coronary artery disease, especially those with diabetes. However, new stents may have the potential of reducing rates of adverse events after PCI. In the SYNTAX trial, paclitaxel-eluting stents were exclusively used, a stent that is less frequently used in current practice due to the superiority of other sirolimus- and everolimus-eluting stents. It is still unclear which stent should be preferred for patients with diabetes, since improved outcomes with sirolimus- or everolimus-eluting stents over paclitaxel-eluting stents for diabetics has been debated [23, 24]. In the FREEDOM trial, both paclitaxel- and sirolimus-eluting stents were used, but the absolute difference in the primary end-point between stenting and CABG did not differ: Δ6.5 and Δ6.7%, respectively [19].
Study limitations
Subgroup analyses have been criticized by methodologists and should be interpreted with caution. The diabetes subgroup was predefined and stratified randomization was performed to ensure equal distribution of diabetic patients over the PCI and CABG treatment arms. Nevertheless, the current analyses were not adequately powered and the results should be viewed as ‘hypothesis-generating’ only.
The SYNTAX trial enrolled patients with complex left main and/or three-vessel disease, and the results should therefore not be extrapolated to the overall cohort of patients with symptomatic coronary artery disease evaluated for coronary revascularization.
CONCLUSION
In both diabetic and non-diabetic patients, PCI resulted in higher rates of MACCE, cardiac death and repeat revascularization at 5 years. Although PCI is a potential treatment option in patients with less-complex lesions, CABG should be the revascularization option of choice for patients with more-complex anatomic disease, particularly with concurrent diabetes.
FUNDING
A.P. Kappetein, M.C. Morice, A.P. Banning and P.W. Serruys have received institutional research grant support from Boston Scientific. A.P. Banning is partially funded by the NIHR Biomedical Research Centre in Oxford, United Kingdom.
Conflict of interest: Keith D. Dawkins is a full-time employee of Boston Scientific Corporation.
ACKNOWLEDGEMENTS
The authors thank Vicki Houle and Jian Huang (Boston Scientific) for help preparing the manuscript and statistical analysis. The SYNTAX trial was sponsored and funded by Boston Scientific Corporation, Natick, MA, USA.
REFERENCES
APPENDIX. CONFERENCE DISCUSSION
Dr D. Taggart(Oxford, UK): I received this paper for review in advance of the meeting, and my only comment is that in the abstract it says there were no differences in any of the primary end points, but in fact there is a 7% difference in mortality comparing diabetics and non-diabetics, and if you look at the insulin versus the non-insulin group, the difference in mortality is 10%. So my suggestion to the authors of the paper would be to list these in the abstract, because most people who go on MEDLINE read the abstract; they do not download the paper. So they will be given a false impression that there is no difference in mortality in these groups that may not have reached conventional statistical significance because the numbers are relatively small. But anything that gives you a mortality benefit of between 7 to 10% is clinically very important and that should be in the abstract.
One of the things I found counter-intuitive when I read this paper was that there was no difference in the SYNTAX score between the diabetic and the non-diabetic population. Now, I have always said and maintained, and we all believe that diabetics have more severe diffuse coronary artery disease, so I was going to ask, can you explain why, at least according to the SYNTAX score, there didn't seem to be any difference?
Dr Kappetein: We will highlight this, and you are absolutely right. I didn't have the time to show the difference between the insulin-treated ones and the non-insulin-treated diabetic patients, but there is a significant difference also in mortality between the two. As you could see, the P-value was 0.06, and you are right, we should not focus too much on this, whether it's 0.06 or 0.05. In two weeks’ time we will have the results from the FREEDOM trial presented, which randomized CABG versus PCI in only diabetic patients: this study includes a much larger diabetic population, and hopefully we will see a significant difference there.
In patients with a low SYNTAX score, there was no difference between CABG and PCI. So you could say that those patients with diabetes that have a low SYNTAX score are probably a different type from those patients with a high SYNTAX score. Patients with a low SYNTAX score are patients with their glucose under control and therefore their disease is not as severe as the ones with not so very well controlled glucose treatment. In patients with a high SYNTAX score, findings are the same as in the overall cohort, and CABG is doing much better.
We can make the comparison with patients with peripheral vascular disease: there are diabetic patients who do very badly and need amputations, but there are also diabetic patients who do quite well and are well controlled.
Dr P. Sergeant(Leuven, Belgium): Can you repeat to us the definition of diabetes in the SYNTAX trial?
Dr Kappetein: The group of patients that I showed were the patients that were medically-treated and insulin-treated. We have also made a split between the medically-treated ones and the insulin-treated ones, and if you only look at the insulin-treated group, then there is a significant difference also in cardiac mortality, but not in the medically-treated diabetic patients.
Dr Sergeant: So in reality you should not have combined the orally-treated and the insulin-treated?
Dr Kappetein: You are absolutely right. In the manuscript we have split these two.
Author notes
Presented at the 26th Annual Meeting of the European Association for Cardio-Thoracic Surgery, Barcelona, Spain, 27–31 October 2012.
