


Abstract
Little is known about the association between the type of admission ward and quality of care and outcomes for non-ST-segment elevation myocardial infarction (NSTEMI).
We analysed data from 337 155 NSTEMI admissions between 2010 and 2017 in the UK Myocardial Ischaemia National Audit Project (MINAP) database. The cohort was dichotomised according to receipt of care either on a medical (n = 142,876) or cardiac ward, inclusive of acute cardiac wards and cardiac care unit (n = 194,279) on admission to hospital. Patients admitted to a cardiac ward were younger (median age 70 y vs. 75 y, P < 0.001), and less likely to be female (33% vs. 40%, P < 0.001). Independent factors associated with admission to a cardiac ward included ischaemic ECG changes (OR: 1.20, 95% CI: 1.18–1.23) and prior percutaneous coronary intervention (PCI) (OR: 1.19, 95% CI: 1.16–1.22). Patients admitted to a cardiac ward were more likely to receive optimal pharmacotherapy with statin (85% vs. 81%, P < 0.001) and dual antiplatelet therapy (DAPT) (91% vs. 88%, P < 0.001) on discharge, undergo invasive coronary angiography (78% vs. 59%, P < 0.001), and receive revascularisation in the form of PCI (52% vs. 36%, P < 0.001). Following multivariable logistic regression, the odds of inhospital all-cause mortality (OR: 0.75, 95% CI: 0.70–0.81) and major adverse cardiovascular events (MACE) (OR: 0.84, 95% CI: 0.78–0.91) were lower in patients admitted to a cardiac ward.
Patients with NSTEMI admitted to a cardiac ward on admission were more likely to receive guideline directed management and had better clinical outcomes.
Introduction
Non-ST-segment elevation myocardial infarction (NSTEMI) represents a global health and economic burden,1 with greater than 50 000 patients presenting yearly in England and Wales.2 In many hospitals, these patients are triaged through the ‘acute medical take’ (admission from the emergency department to a medical team) and transferred to acute or general medical wards,3 with limited provision to care for these patients on dedicated cardiac wards or on cardiac care units (CCUs) where appropriate staffing, medical, and nursing expertise is concentrated to manage patients during the acute phase of their ischaemic syndrome.
While the impact of admitting patients to dedicated cardiac wards has been studied extensively for cardiovascular conditions such as acute heart failure (HF),4,5 limited data exist on the care quality and outcomes for patients with NSTEMI admitted to these facilities. NSTEMI patients represent a heterogeneous group with the high-risk subgroup having similar mortality rates to those presenting with ST-segment elevation myocardial infarction (STEMI).6 Better understanding of the impact of the admitting ward for NSTEMI patients is necessary to guide future triaging on admission for these patients.
Using data from a large national registry in the UK, our study aims to look at the impact of admission ward on care quality and outcomes for patients with NSTEMI.
Methods
Study design
We used the Myocardial Ischaemia National Audit Project (MINAP), a prospective national registry of patients admitted to hospitals in the UK with an acute coronary syndrome. The MINAP dataset contains over 130 variables including baseline demographics and clinical characteristics, comorbid conditions, management strategies, pharmacotherapy, place of care, inhospital clinical outcomes, and diagnoses on discharge.7–9 Data are submitted by each hospital's clinical and clerical staff and approximately 90 000 pseudonymised records annually are uploaded to the National Institute for Cardiovascular Outcomes Research (NICOR) database.
Study population
The sampling frame included patients admitted with NSTEMI to any of the 230 participating hospitals in England and Wales between 1 January 2010 and 31 March 2017. The discharge diagnosis of NSTEMI was determined by local clinicians according to presenting history, clinical examination, and the results of inpatient investigations in keeping with the consensus document of the Joint European Society of Cardiology and American College of Cardiology.10 Missing records for mortality and admission ward were excluded from the analysis (Figure1). The admission ward included patients directly admitted to a ward as well as patients admitted to a ward through the emergency department. The analytic cohort was dichotomised according to admission ward, group 1: not admitted to a cardiac ward (acute or general medical ward); group 2: admitted to a cardiac ward (acute cardiac ward and CCU).

STROBE diagram to show all participant inclusion and exclusion. AMU, acute medical unit; CCU, cardiac care unit; ICU, intensive care unit; MINAP, Myocardial Ischaemia National Audit Project; NSTEMI, non-ST-segment elevation myocardial infarction.
*Non-medical and non-cardiac wards.
Quality indicators
We assessed the European Society of Cardiology (ESC) Association for Acute Cardiovascular Care (ACVC) quality indicators (QIs),11 looking specifically at the use of invasive coronary angiography (ICA) within 72 h of admission; the assessment of left ventricular (LV) function; the use of fondaparinux or low molecular weight heparin (LMWH); and the prescription of P2Y12 inhibition, adequate dual antiplatelet therapy (DAPT), and statins on discharge. For patients with moderate and severe LV systolic dysfunction (LVSD), the use of angiotensin converting enzyme inhibitor (ACEi) or angiotensin receptor blocker (ARB) and beta-blocker on discharge was also evaluated. The ESC QI for LVSD is defined as an ejection fraction (EF) less than or equal to 40%. The MINAP database do not have the same cut-off points for LVSD, thus moderate (EF < 49%) and severe LVSD (EF < 30%) was used as a surrogate. Furthermore, MINAP does not record the specific type or dose of statin prescribed so ‘statin prescription’ was used as a surrogate for high-intensity statin.
Outcomes
Primary
Primary outcomes of interest were inhospital all-cause mortality and major adverse cardiovascular events (MACE) (composite endpoint of inpatient all-cause mortality and reinfarction).
Secondary
Secondary outcomes of interest were inhospital cardiac mortality (death attributable to myocardial ischaemia or infarction, HF, and cardiac arrest of unknown cause) and major bleeding (a composite of gastrointestinal, retroperitoneal, and intracranial haemorrhage).
Statistical analysis
Baseline characteristics and management strategies were summarised according to the admitting ward. Group-wise comparisons were performed using Pearson's chi squared, Student’s t-test, or Mann–Whitney as appropriate. Gaussian continuous variables are expressed as mean ± standard deviation (SD); non-Gaussian continuous variables as median (IQR) and categorical variables as numbers and percentages. Where data were missing, this was assumed to be at random and we applied multiple imputations using chained equations (MICE) with 10 imputations of the dataset. For imputation, we applied linear regression models for continuous data, multinomial logistic regression for ordinal data, and logistic regression for binary data. For each binary outcome of interest, multivariable logistic regression analysis was applied on imputed datasets to estimate the risk of adverse outcomes between groups. Estimates were combined using Rubin's rules.12 Logistic regression models were fitted using maximum likelihood estimation and were adjusted for age; sex; ethnicity; heart rate; blood pressure; serum creatinine concentration on admission; family history of coronary artery disease (CAD); previous coronary artery bypass graft (CABG) surgery; ischaemic ECG changes; history of HF; LVSD; prior percutaneous coronary intervention (PCI); co-morbid conditions (history of diabetes mellitus, hypercholesterolaemia, angina, previous myocardial infarction, cerebrovascular accident, peripheral vascular disease, hypertension, smoking, asthma/chronic obstructive pulmonary disease); pharmacotherapy (prescription of LMWH warfarin, un-fractionated heparin, GP IIb/IIIa inhibitor, intravenous nitrate, furosemide, aldosterone antagonist, fondaparinux, beta-blockers, ACEi/ARB's, aspirin, P2Y12 inhibitor, statins); cardiac arrest; procedures and investigations including ICA, PCI, and CABG surgery during admission; type of centre according to catheter laboratory status; admission under a cardiologist in the first 24 h; hospital; and year.
Subgroup analysis
We further subdivided the patients who were admitted to a cardiac ward into those admitted to CCU and those who were not, and looked at the quality of care and outcomes between the two groups.
Factors associated with admission ward type
Multivariable logistic regression models were applied on the imputed data set to identify independent factors associated with ward type.
Temporal and geographical changes
We evaluated all participating hospitals in our study to look at how the proportion of patients admitted to a cardiac ward varied according to the hospital they were treated at. Risk-standardised mortality rates adjusted for patients’ demographics were calculated for each centre in our study. Subsequently, we undertook logistic regression to see if there was a correlation with the adjusted mortality rates and proportion of patients admitted to a cardiac ward. A secondary analysis with the same methodology was performed looking at patients admitted to a cardiac ward, with the exclusion of CCU patients. Furthermore, temporal changes in the proportions of patients with NSTEMI admitted according to the admission ward were evaluated.
All statistical analyses were performed with Stata 14.2 (College Station, Texas, USA) with data anonymised. All statistical analyses were two-tailed, and an alpha of 5% was used throughout, without multiplicity adjustment.
Results
Baseline characteristics
Between January 2010 and March 2017, there were 369 435 patients admitted to hospital in England and Wales with a diagnosis of NSTEMI. Applying relevant exclusion criteria (Figure1) produced a study cohort consisting of 337 155 (9% excluded). Of these, 194 729 (58%) were admitted to a cardiac ward.
Differences in clinical characteristics at admission between the two groups are presented in Table1. Patients admitted to a cardiac ward were more frequently younger (median age of 70 y vs. 75 y), had previous PCI (16% vs. 13%), hypercholesterolemia (40% vs. 33%), and a family history of cardiovascular disease (31% vs. 25%). Those admitted to a non-cardiac ward were more likely to have a higher GRACE risk score (81% vs. 74%) and were more likely to be female (40% vs. 33%). Furthermore, 12% of patients admitted to a cardiac ward were not admitted under a cardiologist during the first 24 h of their admission; whereas 16% of patients admitted to a medical ward were admitted under the care of a cardiologist. Pharmacotherapy, management strategies, and unadjusted crude clinical outcomes for both cohorts are presented in Table2. Patients admitted to a cardiac ward more frequently received ICA (78% vs. 59%), PCI (52% vs. 36%), and CABG surgery (8% vs. 7%) than those admitted to medical wards.
Clinical characteristics
| Non-cardiac ward | Cardiac ward | ||
|---|---|---|---|
| Variables | (n = 142 876) | (n = 194 279) | P-value |
| Age (y) | 75 (64–84) | 70 (60–80) | <0.001 |
| Women (%) | 57 445/142 876 (40%) | 63 182/194 279 (33%) | <0.001 |
| Caucasians (%) | 122 583/132 589 (92%) | 160 472/176 053 (91%) | <0.001 |
| BMI median [IQR] | 27 (24–31) | 27 (24–31) | <0.001 |
| Killip class | |||
| No Heart failure | 62 375/85 715 (73%) | 105 810/130 951(81%) | <0.001 |
| Basal crepitations | 17 659/85 715 (21%) | 17 255/130 951 (13%) | <0.001 |
| Pulmonary oedema (%) | 5378/85 715 (6.3%) | 7226/130 951 (5.5%) | <0.001 |
| Cardiogenic shock (%) | 303/85 715 (0.4%) | 660/130 951 (0.5%) | <0.001 |
| GRACE score | |||
| High-risk GRACE score >140 (%) | 67 328/82 775 (81%) | 93 206/125 406 (74%) | <0.001 |
| Intermediate-risk GRACE score 109–140 (%) | 12 651/82 775 (15%) | 25 259/125 406 (20%) | <0.001 |
| Low-risk GRACE score <109 (%) | 2796/82 775 (3%) | 6941/125 406 (6%) | <0.001 |
| Other clinical characteristics | |||
| ECG ST changes (%) | 105 930/139 390 (76%) | 147 775/188 843 (78%) | <0.001 |
| Previous smoker (%) | 51 288/134 378 (38%) | 69 409/186 830 (37%) | <0.001 |
| Current smoker (%) | 26 037/134 378 (19%) | 44 345/186 830 (24%) | <0.001 |
| Chronic renal failure (%) | 13 743/132 773 (10%) | 14 710/184 215 (8%) | <0.001 |
| Prior PCI (%) | 17 088/132 799 (13%) | 30 115/184 234 (16%) | <0.001 |
| Diabetes (%) | 37 949/140 728 (27%) | 50 300/191 585 (26%) | <0.001 |
| CCF (%) | 12 974/132 800 (10%) | 12 892/184 199 (7%) | <0.001 |
| Hypercholesterolemia (%) | 43 238/132 019 (33%) | 73 252/182 804 (40%) | <0.001 |
| Previous MI (%) | 42 651/133 758 (32%) | 56 168/185 925 (30%) | <0.001 |
| Angina (%) | 44 210/133 000 (33%) | 57 864/183 600 (32%) | <0.001 |
| Cerebrovascular disease (%) | 16 080/133 081 (12%) | 16 467/184 390 (9%) | <0.001 |
| Peripheral vascular disease (%) | 7332/132 161 (6%) | 10 288/183 789 (6%) | 0.54 |
| Hypertension (%) | 74 359/134 226 (55%) | 104 478/185 402 (56%) | <0.001 |
| Asthma/COPD (%) | 25 864/133 287 (19%) | 30 187/184 499 (16%) | <0.001 |
| Family history of CAD (%) | 26 043/105 843 (25%) | 50 835/161 511 (31%) | <0.001 |
| Heart rate, bpm, median (IQR) | 79 (67–93) | 76 (65–90) | <0.001 |
| Systolic blood pressure, median (IQR) | 140 (121–158) | 140 (122–158) | 0.32 |
| Moderate LVSD | 17 159/109 898 (16%) | 29 240/149 150 (20%) | <0.001 |
| Severe LVSD | 7521/109 898 (7%) | 11 587/149 150 (8%) | <0.001 |
| Admission under cardiologist during first 24 h (%) | 21 512/137 246 (16%) | 146 681/188 115 (78%) | <0.001 |
| Cardiac arrest (%) | 3447/140 174 (2.5%) | 4454/189 140 (2.4%) | 0.05 |
| Previous CABG (%) | 12 420/133 037 (9%) | 18 279/184 379 (10%) | <0.001 |
BMI, body mass index; CABG surgery, coronary artery bypass grafting surgery; CAD, coronary artery disease; CCF, congestive cardiac failure; COPD, chronic obstructive pulmonary disease; ECG, electrocardiograph; EF, ejection fraction; GRACE, Global Registry of Acute Coronary Events; IQR, interquartile range; LVSD, left ventricular systolic dysfunction; MI, myocardial infarction; PCI, percutaneous coronary intervention.
Management strategy and crude clinical outcome
| Variables | Non-cardiac ward (n = 142 876) | Cardiac ward (n = 194 279) | P-value |
|---|---|---|---|
| Pharmacotherapy | |||
| Low molecular weight heparin (%) | 63 846/120 734 (53%) | 83 223/167 934 (50%) | <0.001 |
| Fondaparinux | 60 060/121 133 (50%) | 75 242/168 577 (45%) | <0.001 |
| Warfarin (%) | 8357/120 040 (7%) | 10 366/166 921 (6%) | <0.001 |
| Unfractionated heparin | 10 643/119 617 (9%) | 32 930/166 376 (20%) | <0.001 |
| Glycoprotein 2b/3a inhibitor (%) | 2579/122 017 (2%) | 7426/169 024 (4%) | <0.001 |
| IV nitrate | 13 010/119 981 (11%) | 24 094/166 887 (14%) | <0.001 |
| Furosemide (%) | 38 875/120 378 (32%) | 44 599/167 376 (27%) | <0.001 |
| Calcium channel blockers (%) | 23 969/120 179 (20%) | 33 689/167 133 (20%) | 0.16 |
| IV beta-blockers (%) | 971/120 689 (0.8%) | 2273/167 860 (1.4%) | <0.001 |
| MRA (%) | 8339/119 730 (7%) | 12 073/165 600 (7%) | 0.001 |
| Thiazide diuretics (%) | 5956/119 771 (5%) | 7730/166 687 (4.6%) | <0.001 |
| Aspirin (%) | 135 989/142 413 (95%) | 188 631/193 737 (97%) | <0.001 |
| P2Y12 inhibitor (%) | 129 478/142 323 (91%) | 179 672/193 534 (93%) | <0.001 |
| Statins (%) | 115 283/141 645 (81%) | 164 792/193 178 (85%) | <0.001 |
| ACE inhibitors/ARB (%) | 110 538/141 607 (78%) | 161 248/193 311 (83%) | <0.001 |
| Beta-blockers (%) | 110 647/140 980 (78%) | 161 757/192 558 (84%) | <0.001 |
| Management strategy | |||
| Radionuclide Study (%) | 3298/123 456 (2.7%) | 3961/164 393 (2.4%) | <0.001 |
| Exercise test | 3030/123 897 (2%) | 7330/168 632 (4%) | <0.001 |
| Coronary angiogram (%) | 80 147/136 934 (59%) | 144 457/184 895 (78%) | <0.001 |
| Percutaneous coronary intervention (%) | 37 361/104 436 (36%) | 82 071/157 704 (52%) | <0.001 |
| CABG (%) | 6821/104 436 (7%) | 12 156/157 704 (8%) | <0.001 |
| Revascularisation (CABG/PCI) | 44 182/104 436 (42%) | 94 227/157 704 (60%) | <0.001 |
| Crude inhospital clinical outcomes | |||
| Death (%) | 8903/142 876 (6.2%) | 5299/194 279 (2.7%) | <0.001 |
| Cardiac mortality (%) | 6829/142 876 (4.8%) | 4373/194 279 (2.2%) | <0.001 |
| Reinfarction (%) | 1229/132 239 (0.9%) | 1572/182 182 (0.9%) | 0.05 |
| Major bleeding (%) | 2340/139 507 (1.7%) | 2396/190 628 (1.3%) | <0.001 |
| MACEa (%) | 9810/142 876 (6.9%) | 6638/194 279 (3.4%) | <0.001 |
ACE, angiotensin converting enzyme; ARB, angiotensin receptor blocker; CABG surgery, coronary artery bypass grafting surgery; IV, intravenous; MACE, major adverse cardiovascular events; MRA, mineralocorticoid receptor antagonist.
aMACE is defined as composite endpoint of inpatient mortality and reinfarction.
Quality indicators
Patients admitted to a cardiac ward more frequently received ICA within a 72 h time frame from admission (74% vs. 53%), adequate DAPT (91% vs. 88%), or high-intensity statins on discharge (85% vs. 81%); and for those with LVSD received ACEi/ARB (86% vs. 83%) or beta-blockers (87% vs. 82%) (Table3).
ESC ACVC quality indicators
| Non-cardiac ward (n = 142 876) | Cardiac ward (n = 194 279) | P-value | |
|---|---|---|---|
| Coronary angiography received within 72 h | 25 332/47 473 (53%) | 72 415/98 747 (74%) | <0.001 |
| GRACE risk score recorded in notes | N/A | N/A | N/A |
| CRUSADE risk score recorded in notes | N/A | N/A | N/A |
| LV function recorded in notes | 65 414/109 898 (60%) | 99 975/149 150 (67%) | <0.001 |
| Adequate P2Y12 inhibition on discharge | 129 478/142 323 (91%) | 179 672/193 534 (93%) | <0.001 |
| Fondaparinux or LMWH received | 107 386/122 714 (88%) | 140 166/170 891 (82%) | <0.001 |
| DAPT received on discharge | 125 165/142 109 (88%) | 175 886/193 337 (91%) | <0.001 |
| High-intensity statin on discharge | 115 283/141 645 (81%) | 164 792/193 178 (85%) | <0.001 |
| ACE inhibitor or ARB on discharge for those with moderate and severe LVSD (%) | 20 192/24 425 (83%) | 34 887/40 703 (86%) | <0.001 |
| Beta-blocker on discharge for those with moderate and severe LVSD (%) | 20 009/24 363 (82%) | 35 143/40 562 (87%) | <0.001 |
ACEi/ARB, angiotensin converting enzyme inhibitor/angiotensin receptor blocker; ACVC, Association for Acute Cardiovascular Care; CRUSADE, can rapid risk stratification of unstable angina patients suppress adverse outcomes with early implementation of the ACC/AHA guidelines; DAPT, dual antiplatelet therapy; ESC, European Society of Cardiology; GRACE, Global Registry of Acute Coronary Events; LMWH, low molecular weight heparin; LV, left ventricle; LVSD, left ventricular systolic dysfunction; N/A, not available.
MINAP does not record the specific type of statins, so ‘statin prescription’ was used as a surrogate for high-intensity statin.
Clinical outcomes
Patients admitted to a cardiac ward had lower unadjusted outcomes of mortality (2.7% vs. 6.2%), cardiac mortality (2.2% vs. 4.8%), major bleeding (1.3% vs. 1.7%), and MACE (3.4% vs. 6.9%). After adjustment for differences in baseline clinical and treatment characteristics on multivariate analysis, odds of all-cause mortality (OR: 0.75, 95% CI: 0.71–0.80), cardiac mortality (OR: 0.84, 95% CI: 0.78–0.91), MACE (OR: 0.85, 95% CI: 0.79–0.90), and major bleeding (OR: 0.76, 95% CI: 0.71–0.83) were all lower in patients admitted to a cardiac ward (Table4).
Risk of inhospital adverse outcomes following multivariate adjustments
| Clinical outcomes | Adjusted odds∗ ratio as compared to reference (non-cardiac ward) | P-value | 95% CI |
|---|---|---|---|
| Primary outcomes | |||
| Death (n of observations = 337 155) | OR: 0.75 | <0.001 | 0.70–0.81 |
| MACEa (n of observations = 337 155) | OR: 0.85 | <0.001 | 0.79–0.90 |
| Secondary outcomes | |||
| Cardiac death (n of observations = 337 155) | OR: 0.84 | <0.001 | 0.78–0.91 |
| Major bleeding (n of observations = 337 155) | OR: 0.76 | <0.001 | 0.71–0.83 |
Adjusted for age, sex, ethnicity, heart rate, blood pressure, serum creatinine level, family history of coronary heart diseases, previous coronary artery bypass graft surgery, ischaemic ECG changes, history of heart failure, left ventricle systolic dysfunction, prior percutaneous coronary intervention (PCI), history of diabetes mellitus, hypercholesterolaemia, history of angina, history of myocardial infarction, history of cerebrovascular accident, history of peripheral vascular disease, hypertension, smoking, asthma/chronic obstructive pulmonary disease, prescription of low molecular weight heparin, warfarin, un-fraction heparin, GP 2b/3a inhibitor, IV nitrate, furosemide, aldosterone antagonist, fondaparinux, beta-blockers, angiotensin converting enzyme inhibitor/angiotensin receptor blockers, aspirin, P2Y12 inhibitor, statins, cardiac arrest, coronary angiogram, PCI, CABG surgery, type of centre (catheter laboratory status), admission under a cardiologist in the first 24 h, hospital, and year on imputed data.
CABG surgery, coronary artery bypass grafting surgery; MACE, major adverse cardiovascular events.
aMACE is defined as composite endpoint of inpatient mortality and reinfarction.
Factors associated with admission ward type
Independent factors of admission to a cardiac ward included cardiometabolic risk factors such as hypertension (OR: 1.04, 95% CI: 1.02–1.06), hypercholesterolemia (OR: 1.09, 95% CI: 1.07–1.12), and current smoking status (OR: 1.04, 95% CI: 1.02–1.07). Further predictors included previous PCI (OR: 1.19, 95% CI: 1.16–1.22) and CABG surgery (OR: 1.05, 95% CI: 1.01–1.09), ischaemic ECG changes (OR: 1.20, 95% CI: 1.18–1.23) as well as admission under the care of a cardiologist in the first 24 h of admission (OR: 18.2, 95% CI: 17.9–18.6) (Table5).
Factors associated with admission to a cardiac ward
| Odds ratio | 95% CI (lower) | 95% CI (upper) | P-value | |
|---|---|---|---|---|
| Age | 0.99 | 0.99 | 0.99 | <0.001 |
| Sex (female) | 0.88 | 0.87 | 0.90 | <0.001 |
| Ethnicity (White reference) | ||||
| Black | 0.96 | 0.87 | 1.05 | 0.36 |
| Asian | 0.96 | 0.92 | 1.00 | 0.07 |
| Other non-White ethnicities | 1.00 | 0.93 | 1.08 | 0.98 |
| Ischaemic ECG changes | 1.20 | 1.18 | 1.23 | <0.001 |
| LV function (normal—reference) | ||||
| Moderate impairment | 1.25 | 1.21 | 1.28 | <0.001 |
| Severe impairment | 1.21 | 1.16 | 1.27 | <0.001 |
| Heart failure | 0.89 | 0.86 | 0.91 | <0.001 |
| Diabetes | 0.96 | 0.94 | 0.99 | 0.001 |
| Hypercholesterolemia | 1.09 | 1.07 | 1.12 | <0.001 |
| Hypertension | 1.04 | 1.02 | 1.06 | <0.001 |
| History of CVA | 0.88 | 0.85 | 0.90 | <0.001 |
| History of PVD | 0.94 | 0.91 | 0.98 | 0.002 |
| History of AMI | 0.94 | 0.92 | 0.96 | <0.001 |
| History of angina | 0.97 | 0.95 | 0.99 | 0.02 |
| Family history of coronary heart disease | 1.07 | 1.04 | 1.09 | <0.001 |
| Previous PCI | 1.19 | 1.16 | 1.22 | <0.001 |
| Previous CABG surgery | 1.05 | 1.01 | 1.09 | 0.002 |
| Smoking (never smoked—reference) | ||||
| Ex-smoker | 1.05 | 1.03 | 1.07 | <0.001 |
| Current smoker | 1.04 | 1.02 | 1.07 | 0.001 |
| Asthma/COPD | 0.90 | 0.88 | 0.92 | <0.001 |
| Admissions as a cardiac arrest | 1.03 | 0.97 | 1.09 | 0.31 |
| Admitted under cardiologist (first 24 h of care) | 18.2 | 17.9 | 18.6 | <0.001 |
| Admitted to a centre with catheter laboratory facilities | 0.96 | 0.94 | 0.98 | <0.001 |
AMI, acute myocardial infarction; CABG surgery, coronary artery bypass graft surgery; CHD, coronary heart disease; COPD, chronic obstructive pulmonary disease; CVA, cerebrovascular accident; ECG, electrocardiograph; LV, left ventricle; PCI, percutaneous coronary intervention; PVD, peripheral vascular disease.
Temporal and geographical changes
The proportion of patients with NSTEMI admitted to a cardiac ward increased from 52% in 2010 to 64% in 2017 (Supplementary material online, Figure S1). Figure2 demonstrates a statistically significant, albeit weak, inverse correlation between the mortality rate (adjusted for demographics) and admission to a cardiac ward (coefficient −0.021, 95% CI: −0.031 to −0.010, P < 0.001), with an R2 of 0.06. Supplementary material online, Figure S2 demonstrates the significant variability in the proportion of patients admitted to a cardiac ward depending on which hospital they were treated at, varying from 0 to 100%. Supplementary material online, Figure S3 demonstrates the same trend between adjusted mortality rate and admission to a cardiac ward, with CCU patients excluded (coefficient −0.024, 95% CI: −0.038 to −0.010, P < 0.001), with an R2 of 0.05.

A figure to show the correlation between the risk-standardised mortality rate (adjusted for patient demographics) for each centre and the proportion of NSTEMI patients admitted to a cardiac ward. ∗RSMR Adjusted for age, sex, ethnicity, serum creatinine level, family history of coronary heart diseases, previous coronary artery bypass graft, ischaemic ECG changes, history of heart failure, left ventricle systolic dysfunction, prior percutaneous coronary intervention (PCI), history of diabetes mellitus, hypercholesterolaemia, history of angina, history of myocardial infarction, history of cerebrovascular accident, history of peripheral vascular disease, hypertension, smoking, asthma/chronic obstructive pulmonary disease. CI, confidence interval; RSMR, risk-standardised mortality rate.
Subgroup analysis
In subgroup analysis, we studied characteristics, quality of care, and outcomes in patients who were admitted to a cardiac ward (excluding CCU) to those admitted to CCU or medical wards. Patients admitted to a cardiac ward had similar characteristics to those admitted to CCU but were less likely to present as a cardiac arrest (1.3% vs. 2.8%) and had lower inhospital mortality (1.9% vs. 3.1%), cardiac mortality (1.5% vs. 2.6%), and MACE (2.6% vs. 3.8%) compared with those admitted directly to CCU (Supplementary material online, Tables S1andS2). Patients admitted to a cardiac ward had similar rates of ICA within 72 h (72% vs. 74%), adequate P2Y12 inhibition on discharge (93% vs. 93%), and DAPT on discharge (91% vs. 91%) to those presenting to CCU. They were more likely to be discharged with a high-intensity statin (88% vs. 84%) (Supplementary material online, Table S3). Supplementary material online, Table S4 shows that the primary outcomes of mortality and MACE were all significantly lower in those admitted to a cardiac ward compared with those admitted to CCU (Mortality: OR: 0.80, 95% CI: 0.73–0.87, MACE: OR: 0.92, 95% CI: 0.86–0.99, P = 0.02) or medical wards (Mortality: OR: 0.64, 95% CI: 0.58–0.70, MACE: OR: 0.80, 95% CI: 0.74–0.86).
Our key study findings are summarised in the central illustration figure (Figure3).
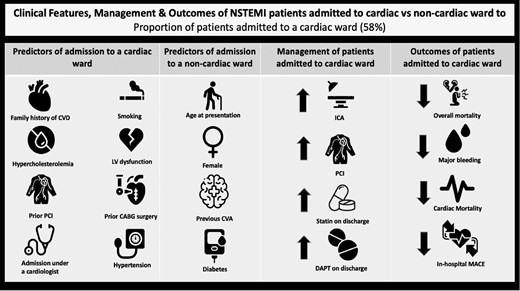
Central illustration figure. CABG, coronary artery bypass graft; CVA, cerebrovascular accident; CVD, cardiovascular disease; DAPT, dual antiplatelet therapy; ICA, invasive coronary angiogram; LV, left ventricle; MACE, major adverse cardiovascular events; NSTEMI, non-ST-segment elevation myocardial infarction; PCI, percutaneous coronary intervention.
∗MACE is defined as composite endpoint of inpatient mortality and reinfarction.
Discussion
The results of this analysis of greater than 300 000 patients within a centrally funded healthcare system shows differences in care exist for patients presenting with NSTEMI dependent on their admission ward independent of treating physician. Patients admitted to a cardiac ward tended to be younger, male, and more likely to receive optimal pharmacotherapy treatments, ICA and PCI with greater overall quality of care compared with those not admitted to a cardiac ward. Importantly, once differences in baseline characteristics and presentation were adjusted for, there were reduced odds of inhospital mortality and MACE in patients admitted to a cardiac ward. Furthermore, we report significant differences in practice across the 230 hospitals in England and Wales with wide variation in the proportion admitted to a cardiac ward. There was a significant, albeit weak, correlation between standardised mortality rates of the individual centres and the proportion of patients admitted to a cardiac ward.
Previous studies examining the impact of the admitting ward in AMI have several important limitations. The majority of studies have focused on the impact of the specialty of admitting physician, with the assumption that patients admitted under a cardiologist are treated on a cardiac ward and vice versa. While STEMI patients are often directly taken to CCU or the catheter laboratory for revascularisation, NSTEMI patients in the UK are admitted from the emergency department via the ‘acute medical take’.3 Often, the admitting specialty of the physician and type of ward the patient is admitted to are not mutually exclusive, with some patients admitted to general medical wards under the care of a cardiologist or to acute cardiac wards/CCU under the care of general medical physician. Thus, a knowledge gap exists looking at the independent association of the admitting ward. Furthermore, prior studies have predominantly focused on the effects of the CCU and less on acute cardiac wards.13–15 With the ‘sickest’ patients, often perceived as STEMI, getting admitted to CCU, there is limited data on outcomes for NSTEMI patients as well as the direct effects of cardiac wards, excluding CCU.
Our analysis demonstrates that significant sex disparities exist, with women less likely to be admitted to a cardiac ward. This is consistent with findings from Alfredsson et al., who assessed 570 consecutive patients with NSTEMI, finding that while there were no significant differences in mortality, women were significantly less likely to be admitted to a coronary care unit.15 Our previous work has shown that they were also less likely to be admitted under the care of a cardiologist within the first 24 h of admission.16 Patients admitted to a cardiac ward were significantly more likely to receive ICA and PCI than those admitted to medical wards. This may explain why women are less likely to receive invasive treatment for NSTEMI, and when they do are less likely to be offered it in line with guideline recommendations.17,18 Reassuringly, our study shows that race was not an independent predictor of admission to a cardiac ward. Prior studies have shown that ethnic minorities are disadvantaged in process of care for AMI.19,20 Having equitable access to the resource allocation with expert nursing, medical, and allied health professionals aligned to caring for patients available on a cardiac ward is likely to facilitate better outcomes in this group.
Patients admitted to a cardiac ward were more likely to attain the ESC QIs for acute myocardial infarction, where attainment of these specific QIs has been shown to have an inverse association with 30 day mortality.21 This was also evident in our subgroup analysis; cardiac ward patients (CCU patients excluded), as well as CCU patients independently were more likely to attain these QIs compared with patients on medical wards. The cause of this is likely a combination of increasingly being managed by cardiologists on cardiac wards as well as having the benefits of an integrated service of a specialist unit where the multidisciplinary team works cohesively together. Jolis et al. found that cardiologists were more likely than other physicians to treat patients with medications associated with improved survival, and have increased use of echocardiography, coronary angiography, and revascularisation22; while Langhorne et al. demonstrated that stroke patients who receive organised care in specialist units were more likely to be alive, independent, and living at home 1 y after the stroke.23 Furthermore, Birkhead et al. found that patients admitted under a cardiologist or to a cardiac ward (CCU included) were less likely to be treated with an invasive strategy compared with those not admitted under a cardiologist and on a medical ward, respectively.24
Clinical outcomes for NSTEMI patients including mortality (all-cause and cardiac), major bleeding, and MACE were reduced in patients admitted to a cardiac ward. Potential factors that may explain this include the medical and nursing staff dealing with large numbers of NSTEMI patients, thus being adept at recognising complications such as major bleeding; while also being able to identify inaccuracies with medications and suboptimal management in a timelier fashion. There are likely to be additional unmeasured confounders that would contribute to this. Differences in the use of ICA and revascularisation procedures may have contributed to improved survival; however, the benefits would become more apparent after 1 y of follow-up.22 It is possible that differences in severity of illness have led to lower inhospital morality and MACE in patients admitted to a cardiac ward. Our analysis shows that patients admitted to a medical ward tended to be older and have a higher GRACE-risk score on admission, which is associated with greater inhospital mortality.25,26
Our subgroup analysis showed that the characteristics of patients admitted to a cardiac ward and CCU were similar, with the main difference being patients in CCU representing a ‘sicker’ cohort of patients as evidenced by a greater proportion presenting as a cardiac arrest or with a high GRACE risk score. The main structural differences of a CCU in comparison to a ‘general’ cardiac ward include increased nursing ratios, fewer patients, and increased use of invasive monitoring equipment.13,14 It is likely that their worse outcomes of inhospital mortality and MACE compared with cardiac ward patients is largely driven by the more unwell cohort of patients and less by structural differences to ‘general’ cardiac wards. It is interesting to note that almost one in four patients admitted to CCU were not admitted under the care of a cardiologist. This is likely a reflection of how hospitals are set up in the UK with some smaller hospitals having the provision of a CCU, but not necessarily having cardiologist cover out of normal working hours.27 The odds of inhospital mortality and MACE were significantly lower in patients admitted to a cardiac ward compared with medical wards. Resource allocations with easier access to specialist care, provisions such as telemetry, frequent non-invasive monitoring, and healthcare staff who routinely deal with acutely unwell NSTEMI patients are likely to be the key determinants as to why their outcomes are worse.
Given the vast disparities in quality of care and outcomes between the type of admitting ward, our study has clinical implications that would support changes in the practice of NSTEMI management in healthcare systems such as the UK. While the proportion of patients being admitted to a cardiac ward has steadily increased from 2010 to 2017, more can be done. Currently there may not be capacity to accommodate all NSTEMI patients on cardiac wards due to limited beds and staff. However, setting the ‘gold standard’ for NSTEMI patients as admission to a cardiac ward is likely to place increased prominence on the importance of admission ward to those responsible in the admitting pathway of these patients. Incorporating admission to a cardiac ward as an NSTEMI QI, for example, may go some way to achieving this. Our previous work has shown that patients admitted directly under a cardiologist in the first 24 h of care had better quality of care and outcomes compared with those who were not admitted under a cardiologist but reviewed by them during their admission.16 Thus, having increased presence of cardiologists reviewing NSTEMI patients on medical wards is unlikely to solely bridge the gap in quality of care compared with those who were directly admitted to a cardiac ward. If there is not a provision to manage all NSTEMI patients on cardiac wards as it is a finite resource, our focus should look to concentrate patients who definitively require invasive management on cardiac wards to improve the timing of their revascularisation with efforts to provide further education for staff dealing with NSTEMI patients on medical wards. It is important to highlight that these decisions are complex where vast experience, in the form of either cardiologists or senior ward-based cardiology-trained nurses, would be most optimally placed to identify these patients.28 Until such provisions are met that all patients with NSTEMI can be managed on a cardiac ward, the utilisation of cardiology-trained nursing staff with triaging experience is likely to help select in a timelier fashion the patients who benefit most from an invasive strategy, particularly in hospitals in which cardiology consults are not available during weekends.
There are a number of strengths to this study. Our analysis represents the largest study to date that looks at differences in care quality and outcomes of NSTEMI patients by the specialty of the admitting ward. The MINAP database encapsulates an almost complete record of NSTEMI patients admitted in the UK and represents one of the largest national real-world databases of this cohort of patients in the world, including those who are high risk and have multiple comorbid illness, such that they are either not included or under-represented in clinical trials.
Despite these strengths, there are several important limitations common to observational studies of this type. The MINAP data collection shares the weakness of other national registries, including self-reporting of adverse events where there is no external validation of these. Although the MINAP dataset include important clinical and demographic variables of interest, there are limitations to data collected. For instance, the database does not capture frailty score or index, severity of CAD, contraindications to medications, or an exhaustive list of comorbid conditions; nor does the database capture the type or dose of statin used. This is important as there is emerging evidence that this has a key role in inhospital mortality outcomes.29 Our data do not show the precise degree of involvement of cardiologists’ input to patients on different wards, nor does it show any data regarding transfer of patients from their admission ward. In addition, the MINAP database only records inhospital clinical outcomes and it is possible that long-term follow-up data may reveal further differences in the crude clinical outcomes of patients admitted to a cardiac ward vs. those who were not. Finally, some cases of NSTEMI may have been misdiagnosed or misclassified as a type 2 myocardial infarction.
Conclusions
Our study demonstrates that between 2010 and 2017, only 58% of patients diagnosed with NSTEMI were admitted to a cardiac ward. There is wide variation of practice among centres in England and Wales, and a significant correlation exists which shows that the mortality rate for individual centres decreases as the proportion of patients admitted to a cardiac ward increases. Those admitted to a cardiac ward were more likely to attain the ESC ACVC QIs and had better outcomes of mortality, major bleeding, and MACE, independent of admitting physicians. While a randomised control trial may give more credence to our work, a significant opportunity exists to improve the management of NSTEMI patients by accelerating the proportion of NSTEMI patients admitted to a cardiac ward, subsequently improving the quality of care and outcomes in this cohort.
Funding
None.
Conflict of interest
Prof. Gale reports personal fees from AstraZeneca, personal fees from Amgen, personal fees from Bayer, grants from BMS, personal fees from Boehringer-Ingelheim, personal fees from Daiichi Sankyo, personal fees from Vifor Pharma, grants from Abbott, personal fees from Menarini, personal fees from Wondr Medical, personal fees from Raisio Group, grants from British Heart Foundation, grants from NIHR, grant from Horizon 2020, personal fees from Oxford University Press, grants from ESC, outside the submitted work.
No other conflicts declared.
Data availability
The authors do not have authorisation to share the data, but it can be accessed through contacting the National Institute for Cardiovascular Outcomes Research (NICOR) upon approval.
