


Abstract
To examine combined and sex-specific temporal changes in risks of adverse cardiovascular events and coronary revascularization in patients with chronic coronary syndrome undergoing coronary angiography.
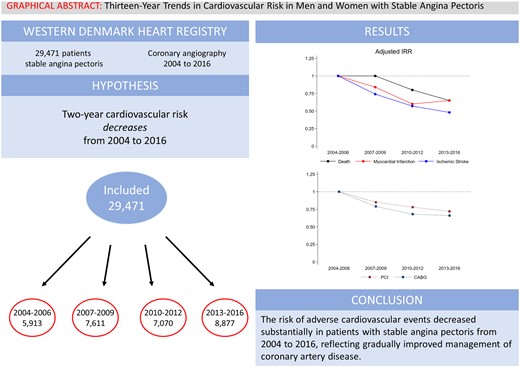
We included all patients with stable angina pectoris and coronary artery disease examined by coronary angiography in Western Denmark from 2004 to 2016. Patients were stratified by examination year interval: 2004–2006, 2007–2009, 2010–2012, and 2013–2016. Outcomes were 2-year risk of myocardial infarction, ischaemic stroke, cardiac death, and all-cause death estimated by adjusted incidence rate ratios using patients examined in 2004–2006 as reference. A total of 29 471 patients were included, of whom 70% were men. The 2-year risk of myocardial infarction [2.8% vs. 1.9%, adjusted incidence rate ratio 0.65, 95% confidence interval (CI) 0.53–0.81], ischaemic stroke (1.8% vs. 1.1%, adjusted incidence rate ratio 0.48, 95% CI 0.37–0.64), cardiac death (2.1% vs. 0.9%, adjusted incidence rate ratio 0.38, 95% CI 0.29–0.51), and all-cause death (5.0% vs. 3.6%, adjusted incidence rate ratio 0.65, 95% CI 0.55–0.76) decreased from the first examination interval (2004–2006) to the last examination interval (2013–2016). Coronary revascularizations also decreased (percutaneous coronary intervention: 51.6% vs. 42.5%; coronary artery bypass grafting: 24.6% vs. 17.5%). Risk reductions were observed in both men and women, however, women had a lower absolute risk.
The risk for adverse cardiovascular events decreased substantially in both men and women with chronic coronary syndrome from 2004 to 2016. These results most likely reflect the cumulative effect of improvements in the management of chronic coronary artery disease.
Introduction
Atherosclerosis is the underlying cause of coronary artery disease and may ultimately result in symptoms due to either chronic stenosis or acute thrombosis—i.e. myocardial infarction.1 To mitigate the atherosclerotic process and to improve prognosis, patients with established symptomatic coronary artery disease are recommended lifestyle changes, pharmacological preventive treatments, and, when found indicated, coronary revascularization to reduce symptom burden.2,3
In the past decades, the management of coronary artery disease has evolved substantially, particularly in terms of novel pharmacological treatments (i.e. new anti-thrombotic and lipid-lowering therapies), stricter guideline-directed treatment targets (i.e. lower blood pressure and lipid targets), and refined invasive diagnostic and revascularization techniques.2,3 Although most of these changes are based on clinical trial evidence showing efficacy of each individual change, it remains unknown how the cumulative impact of all changes translate into reduced risk of subsequent cardiovascular events in real-world patients with chronic coronary syndrome. Moreover, women have historically been underrepresented in randomized clinical trials,4 and there is potential underutilization of endorsed treatment strategies in women with coronary artery disease.
We conducted a cohort study examining the changes in 2-year risk of cardiovascular events and coronary revascularization in patients with chronic coronary syndrome who underwent coronary angiography in Western Denmark from 2004 to 2016, and further assessed sex-dependent differences. We hypothesized that cardiovascular risk decreased during the study period, and that similar reductions would be seen in women and men.
Methods
Setting
We identified patients using the Western Denmark Heart Registry, which provides an unselected all-comers cohort of patients examined by coronary angiography in Western Denmark (approximately 3.5 million inhabitants) since 1999. The registry records administrative data, medical history, procedural and lesion-specific data, and complication data.5 Using unique personal identifiers assigned by the Civil Registration System,6 we linked data from the Western Denmark Heart Registry with the Danish National Patient Registry, the Danish National Prescription Registry, and the Danish Register of Causes of Death.7–9
Patient selection
We included all patients examined by first-time coronary angiography from 1 January 2004 to 31 December 2016 (Figure 1). If a patient underwent more than one coronary angiography during the study period, the first coronary angiography was defined as the index procedure. We excluded patients <18 years (n = 4), patients without coronary artery disease (n = 51 181), patients with a history of myocardial infarction, percutaneous coronary intervention, or coronary artery bypass grafting prior to coronary angiography (n = 8159), patients undergoing non-elective coronary angiography (n = 44 529), patients with procedural indications other than stable angina pectoris (n = 12 846), and patients with an invalid personal identifier (n = 1). Patients were stratified according to examination year interval (2004–2006, 2007–2009, 2010–2012, and 2013–2016).
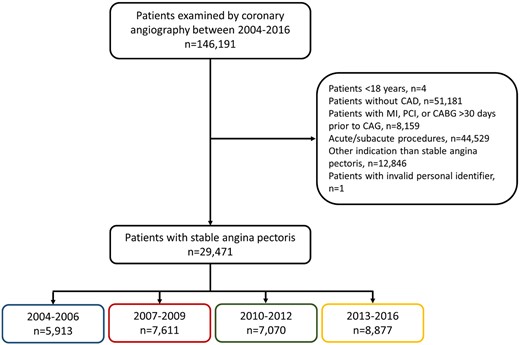
Patient selection. CABG, coronary artery bypass grafting; CAD, coronary artery disease; MI, myocardial infarction; PCI, percutaneous coronary intervention.
Coronary artery disease
Initially, coronary artery disease was defined as one or more obstructive stenoses with ≥50% lumen narrowing while diffuse coronary artery disease pragmatically was defined as non-significant coronary artery disease in involving >1 vessel. During the study period, functional assessment by pressure measures (fractional flow reserve, instantaneous wave-free ratio, etc.) gradually replaced visual assessment of intermediate stenosis and the definition of coronary artery disease, reflecting this change in daily clinical practice, was changed to ‘one or more obstructive stenoses with ≥50% lumen narrowing or, if available, fractional flow reserve ≤ 0.80’ around 2014.
Outcomes
Outcomes included myocardial infarction, ischaemic stroke, cardiac death, percutaneous coronary intervention, coronary artery bypass grafting, and all-cause death (Supplementary material online, Table S1).
Medication
Use of antiplatelet agents, oral anticoagulants, antihypertensive drugs, and statins were defined as redemption of ≥1 prescription ≤6 months before coronary angiography. We also estimated drug use after coronary angiography, defined as redemption of ≥1 prescription ≤6 months after coronary angiography restricted to patients who survived and did not emigrate ≤6 months after coronary angiography (n = 29 071). We also examined types of statins and adenosine diphosphate-inhibitors used before and after coronary angiography.
Statistical analysis
Follow-up started on the day of coronary angiography examination and continued until outcome, emigration, death, or 2 years after examination. To avoid the risk of double registration of procedure-related myocardial infarctions, follow-up for myocardial infarction was postponed to 30 days after coronary angiography.10 We calculated 2-year cumulative incidence proportions, accounting for the competing risk of all-cause death. We estimated crude and adjusted incidence rate ratios by fitting a modified Poisson regression model using the event as outcome and the natural log of person-years as the offset.11 Incidence rate ratios were adjusted for age group (<65 years, 65–74 years, ≥75 years), sex, hypertension, diabetes, peripheral artery disease, smoking status, antiplatelet drug use (aspirin and adenosine diphosphate-inhibitors), oral anticoagulant drug use (vitamin K-antagonists and non-vitamin K-antagonists), and statin use. We used patients examined between 2004 and 2006 as reference. In the case of ischaemic stroke, cardiac death, and all-cause death, we also adjusted for heart failure (defined as left ventricular ejection fraction <40% or diagnosis of heart failure), previous ischaemic stroke, and atrial fibrillation/flutter. Smoking status was missing in 10.1% of patients. Missing data were handled through multiple imputation using chained equations, imputing 11 datasets.12 We performed 2 sensitivity analyses of patients with obstructive coronary artery disease and patients with obstructive 3-vessel disease to examine the effect of coronary artery disease severity. We also performed an analysis in which we included patients with previous myocardial infarction or coronary revascularization. We examined the risk of myocardial infarction in patients suspected of chronic coronary syndrome but with normal angiograms compared to patients with angiographic chronic coronary syndrome. We examined the adjusted 2-year risk of myocardial infarction associated with post-procedural high-intensity statin treatment (atorvastatin or rosuvastatin) compared to simvastatin treatment.
Sex-stratified analyses
We examined 2-year cardiovascular risk stratified by sex. We also estimated 2-year risk difference and adjusted incidence rate ratio by examination year interval using men as reference.
Landmark analysis
We wanted to estimate risk during the immediate post-procedural period, and risk during a more stable phase after coronary angiography. Thus, we performed two landmark analyses for the following time periods: 0–90 days and 3–24 months after coronary angiography. We used a logistic regression model to estimate crude and adjusted 90-day odds ratios as a measure of relative risk including the same covariates as in the main analysis. In the 3–24-month analysis, we estimated incidence rate ratio as described above. Covariates (except for smoking) included in the multivariate regression model were updated according to changes in comorbidity and medication use within 3 months after coronary angiography. We also adjusted for coronary revascularization (percutaneous coronary intervention and coronary artery bypass grafting) within 3 months.
Revascularization
We also estimated the risk of percutaneous coronary intervention and coronary artery bypass grafting within 3 months after coronary angiography and 3–24 months after coronary angiography as described above.
Coronary artery disease extent
Using data from the Western Denmark Heart Registry, we assessed numbers of diseased coronary arteries (one-vessel disease, 2-vessel disease, 3-vessel disease, and diffuse vessel disease) and tested the hypothesis of no difference in coronary artery disease extent between examination year intervals using Pearson’s χ2 test.
Ethical considerations
The study was approved by a regional branch of the Danish Data Protection Agency (record no. 1-16-02-193-18). According to Danish authorities, registry-based studies do not require approval from ethics committees or informed consent from participants. The study complies with the Declaration of Helsinki.
Results
We included 29 471 patients with chronic coronary syndrome undergoing coronary angiography during 2004–2006 (n = 5913), 2007–2009 (n = 7611), 2010–2012 (n = 7070), or 2013–2016 (n = 8887, Figure 1).
From 2004 to 2016, proportions of men, smokers, and heart failure declined, while the proportion of patients diagnosed with hypertension, atrial fibrillation or flutter, diabetes, and renal disease increased (Table 1). Changes in medication use during follow-up are provided in Supplementary material online, Figure S1 and Table S2. Lipid-lowering therapy was intensified during the study period, with gradually increased use of atorvastatin instead of simvastatin (Supplementary material online, Table S3 and Figure S2). Clopidogrel remained the most prescribed adenosine diphosphate-inhibitor, but treatment with adenosine diphosphate-inhibitors declined from 2004–2006 to 2013–2016 (Supplementary material online, Table S3 and Figure S2).
Baseline characteristics by examination year interval
| 2004–2006 (n = 5913) | 2007–2009 (n = 7611) | 2010–2012 (n = 7070) | 2013–2016 (n = 8877) | |
|---|---|---|---|---|
| n (%) | n (%) | n (%) | n (%) | |
| Age (years), mean ± SD | 66 ± 9.7 | 66 ± 9.7 | 66 ± 9.9 | 66 ± 9.9 |
| Male sex | 4334 (73.3) | 5340 (70.2) | 4790 (67.8) | 6144 (69.2) |
| Family history of ischaemic heart diseasea | 2776 (46.9) | 3563 (46.8) | 3384 (47.9) | 4013 (45.2) |
| Smoking | 1532 (25.9) | 1714 (22.5) | 1610 (22.8) | 1830 (20.6) |
| CCTA, SPECT, or PET before CAG | 27 (0.5) | 141 (1.8) | 269 (3.8) | 646 (7.3) |
| Comorbidity | ||||
| Hypertension | 3708 (62.7) | 5221 (68.6) | 5089 (72.0) | 6071 (68.4) |
| Ischaemic stroke | 79 (1.3) | 140 (1.8) | 173 (2.4) | 233 (2.6) |
| Atrial fibrillation/flutter | 477 (8.1) | 640 (8.4) | 633 (9.0) | 862 (9.7) |
| Peripheral artery disease | 361 (6.1) | 523 (6.9) | 530 (7.5) | 611 (6.9) |
| Heart failure | 506 (8.6) | 620 (8.1) | 512 (7.2) | 521 (5.9) |
| Diabetes | 1066 (18.0) | 1507 (19.8) | 1523 (21.5) | 1835 (20.7) |
| Renal disease | 83 (1.4) | 129 (1.7) | 148 (2.1) | 247 (2.8) |
| eGFR (mL/min), mean ± SD | 81 ± 24 | 86 ± 24 | 89 ± 24 | 88 ± 24 |
| BMI (kg/m2), median (IQR) | 27 (25–30) | 27 (25–30) | 27 (25–30) | 27 (25–30) |
| Left ventricular ejection fraction (%), median (IQR) | 60 (50–60) | 60 (55–60) | 60 (55–60) | 60 (60–60) |
| CAD extent | ||||
| 1 VD | 2071 (35.0) | 2771 (36.4) | 2551 (36.1) | 3231 (36.4) |
| 2 VD | 1505 (25.5) | 1773 (23.3) | 1453 (20.6) | 1791 (20.2) |
| 3 VD | 1968 (33.3) | 1842 (24.2) | 1377 (19.5) | 1525 (17.2) |
| Diffuse VD | 369 (6.2) | 1225 (16.1) | 1689 (23.9) | 2330 (26.2) |
| CCS scale | ||||
| Grade I | 1052 (17.8) | 1170 (15.4) | 952 (13.5) | 1384 (15.6) |
| Grade II | 3495 (59.1) | 4978 (65.4) | 4744 (67.1) | 5929 (66.8) |
| Grade III | 1253 (21.2) | 1336 (17.6) | 999 (14.1) | 976 (11.0) |
| Grade IV | 47 (0.8) | 50 (0.7) | 40 (0.6) | 15 (0.2) |
| Missing | 66 (1.1) | 77 (1.0) | 335 (4.7) | 573 (6.5) |
| Physiological measurements and intra-coronary imaging | ||||
| FFR/iFR | 35 (0.6) | 89 (1.2) | 346 (4.9) | 913 (10.3) |
| IVUS | 36 (0.6) | 115 (1.5) | 94 (1.3) | 82 (0.9) |
| OCT | 0 (0.0) | 2 (0.0) | 28 (0.4) | 59 (0.7) |
Values are numbers (n) and percentages (%) unless otherwise stated.
BMI, body mass index; CAD, coronary artery disease; CAG, coronary angiography; CCS, Canadian Cardiovascular Society; CCTA, coronary computed tomography angiography; eGFR, estimated glomerular filtration rate; FFR, fractional flow reserve; iFR, instantaneous wave-free ratio; IQR, interquartile range; OCT, optical coherence tomography; PET, positron emission tomography; SD, standard deviation; SPECT, single-photon emission computed tomography; VD, vessel disease.
First-degree relatives with ischaemic heart disease before the age of 55 (men) or 65 (women) years.
Men were younger, more frequent smokers, and more often had heart failure, while women more often had hypertension and peripheral artery disease (Supplementary material online, Tables S4 and S5). Post-procedural treatment with statin and aspirin were high in both men and women (Supplementary material online, Table S6). However, men were more often treated with statin and aspirin compared to women.
The proportion of patients presenting with 2-vessel disease and 3-vessel disease on the coronary angiography declined during the study period, while more patients were diagnosed with diffuse non-obstructive coronary artery disease, and distributions of coronary artery disease extent differed significantly across examination year intervals (Table 1, Supplementary material online, Figure S3). Men were more frequently diagnosed with multi-vessel obstructive coronary artery disease than women (Supplementary material online, Tables S4 and S5, Figure S4).
From 2004–2006 to 2013–2016, 2-year incidences of myocardial infarction (2.8% vs. 1.9%), ischaemic stroke (1.8% vs. 1.1%), cardiac death (2.1% vs. 0.9%), all-cause death (5.0% vs. 3.6%) declined relatively by 28–62% (Table 2 and Figure 2). This decline was observed both for events occurring within 90 days (Supplementary material online, Table S7) as well as for events occurring from 3 to 24 months (Supplementary material online, Table S8).
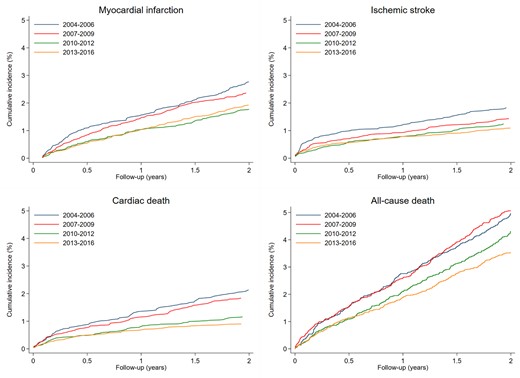
Two-year cumulative incidence proportion of myocardial infarction, ischaemic stroke, cardiac death, and all-cause death after coronary angiography.
Two-year risk of adverse clinical outcomes and 90-day risk of revascularization in patients with stable angina pectoris undergoing elective coronary angiography
| Patients | Events | Two-year incidence (95% CI) | Unadjusted IRR (95% CI) | Adjusted IRRa (95% CI) | |
|---|---|---|---|---|---|
| Myocardial infarctionb | |||||
| 2004–2006 | 5892 | 163 | 2.8% (2.4–3.2) | Reference | Reference |
| 2007–2009 | 7544 | 179 | 2.4% (2.0–2.7) | 0.85 (0.69–1.05) | 0.84 (0.68–1.04) |
| 2010–2012 | 7034 | 125 | 1.8% (1.5–2.1) | 0.63 (0.50–0.80) | 0.60 (0.47–0.75) |
| 2013–2016 | 8832 | 171 | 1.9% (1.7–2.2) | 0.69 (0.57–0.86) | 0.65 (0.53–0.81) |
| Ischaemic stroke | |||||
| 2004–2006 | 5913 | 108 | 1.8% (1.5–2.2) | Reference | Reference |
| 2007–2009 | 7611 | 109 | 1.4% (1.2–1.7) | 0.78 (0.60–1.02) | 0.74 (0.56–0.96) |
| 2010–2012 | 7070 | 88 | 1.2% (1.0–1.5) | 0.67 (0.51–0.89) | 0.57 (0.43–0.76) |
| 2013–2016 | 8877 | 97 | 1.1% (0.9–1.3) | 0.59 (0.45–0.78) | 0.48 (0.37–0.64) |
| Cardiac death | |||||
| 2004–2006 | 5913 | 126 | 2.1% (1.8–2.5) | Reference | Reference |
| 2007–2009 | 7611 | 140 | 1.8% (1.6–2.2) | 0.86 (0.68–1.10) | 0.83 (0.65–1.06) |
| 2010–2012 | 7070 | 82 | 1.2% (0.9–1.4) | 0.54 (0.41–0.72) | 0.50 (0.38–0.67) |
| 2013–2016 | 8877 | 80 | 0.9% (0.7–1.1) | 0.42 (0.32–0.56) | 0.38 (0.29–0.51) |
| All-cause death | |||||
| 2004–2006 | 5913 | 298 | 5.0% (4.5–5.6) | Reference | Reference |
| 2007–2009 | 7611 | 389 | 5.1% (4.6–5.6) | 1.02 (0.88–1.19) | 1.00 (0.86–1.17) |
| 2010–2012 | 7070 | 304 | 4.3% (3.9–4.8) | 0.86 (0.73–1.01) | 0.80 (0.68–0.95) |
| 2013–2016 | 8877 | 316 | 3.6% (3.2–4.0) | 0.71 (0.60–0.83) | 0.65 (0.55–0.76) |
| Patients | Events | 90-day incidence (95% CI) | Unadjusted OR (95% CI) | Adjusted ORa (95% CI) | |
| Percutaneous coronary intervention, 0–90 days | |||||
| 2004–2006 | 5913 | 2897 | 49.0% (47.7–50.3) | Reference | Reference |
| 2007–2009 | 7611 | 3364 | 44.2% (43.1–45.3) | 0.82 (0.77–0.88) | 0.84 (0.78–0.89) |
| 2010–2012 | 7070 | 2999 | 42.4% (41.3–43.6) | 0.77 (0.72–0.82) | 0.79 (0.73–0.84) |
| 2013–2016 | 8877 | 3583 | 40.4% (39.3–41.4) | 0.70 (0.66–0.75) | 0.72 (0.67–0.77) |
| Coronary artery bypass grafting, 0–90 days | |||||
| 2004–2006 | 5913 | 1266 | 21.4% (20.4–22.5) | Reference | Reference |
| 2007–2009 | 7611 | 1286 | 16.9% (16.1–17.7) | 0.75 (0.68–0.81) | 0.74 (0.68–0.81) |
| 2010–2012 | 7070 | 1195 | 16.9% (16.0–17.8) | 0.75 (0.68–0.82) | 0.75 (0.69–0.82) |
| 2013–2016 | 8877 | 1457 | 16.4% (15.6–17.2) | 0.72 (0.66–0.78) | 0.73 (0.67–0.79) |
CI, confidence interval; IRR, incidence rate ratio.
Adjusted for sex, age, smoking, diabetes, hypertension, peripheral artery disease, statin treatment, antiplatelet treatment, and oral anticoagulant treatment. Ischaemic stroke and all-cause death were further adjusted for atrial fibrillation, previous ischaemic stroke, and heart failure.
Start of follow-up was postponed to 30 days after coronary angiography to exclude procedure-related myocardial infarctions.
Both men and women experienced reduced risk of myocardial infarction, ischaemic stroke, cardiac death, and all-cause death from 2004–2006 to 2013–2016 (Table 3). In every examination interval, women had lower absolute risks of myocardial infarction, ischaemic stroke, cardiac death, and all-cause death compared to men examined during the same period (with the exception of all-cause mortality in 2009–2012), but the relative risk differences between men and women remained stable throughout the study period (Table 3).
Two-year adjusted incidence rate ratio of cardiovascular risk and coronary revascularization after coronary angiography in elective patients with stable angina pectoris by sex
| Men | Women | Women vs. men | |||||||
|---|---|---|---|---|---|---|---|---|---|
| Cumulative incidence | Unadjusted IRR | Adjusted IRRa | Cumulative incidence | Unadjusted IRR | Adjusted IRRa | Risk difference | Adjusted IRRa | ||
| Myocardial infarction | |||||||||
| 2004–2006 | 2.9% (2.4–3.5) | Reference | Reference | 2.6% (1.9–3.5) | Reference | Reference | −0.3% (−1.3 to 0.6) | 0.82 (0.57–1.17) | |
| 2007–2009 | 2.6% (2.2–3.1) | 0.89 (0.70–1.14) | 0.89 (0.70–1.14) | 2.0% (1.5–2.6) | 0.76 (0.50–1.17) | 0.72 (0.47–1.11) | −0.6% (−1.3 to 0.1) | 0.65 (0.46–0.92) | |
| 2010–2012 | 1.9% (1.5–2.3) | 0.64 (0.49–0.84) | 0.60 (0.46–0.80) | 1.7% (1.2–2.3) | 0.64 (0.40–1.00) | 0.58 (0.37–0.90) | −0.2% (−0.9 to 0.4) | 0.76 (0.51–1.13) | |
| 2013–2016 | 2.0% (1.7–2.4) | 0.69 (0.53–0.88) | 0.64 (0.50–0.84) | 1.9% (1.4–2.4) | 0.71 (0.47–1.08) | 0.66 (0.44–1.01) | −0.2% (−0.8 to 0.5) | 0.84 (0.60–1.17) | |
| Ischaemic stroke | |||||||||
| 2004–2006 | 1.9% (1.6–2.4) | Reference | Reference | 1.7% (1.2–2.5) | Reference | Reference | −0.3% (−1.0 to 0.5) | 0.77 (0.49–1.22) | |
| 2007–2009 | 1.6% (1.3–2.0) | 0.83 (0.61–1.13) | 0.78 (0.57–1.06) | 1.1% (0.8–1.7) | 0.67 (0.38–1.15) | 0.60 (0.34–1.07) | −0.5% (−1.0 to 0.1) | 0.63 (0.39–1.01) | |
| 2010–2012 | 1.5% (1.2–1.9) | 0.75 (0.55–1.04) | 0.61 (0.44–0.85) | 0.9% (0.5–1.3) | 0.50 (0.28–0.91) | 0.42 (0.23–0.78) | −0.6% (−1.1 to −0.1) | 0.55 (0.33–0.92) | |
| 2013–2016 | 1.2% (0.9–1.5) | 0.60 (0.44–0.83) | 0.48 (0.35–0.67) | 1.0% (0.7–1.4) | 0.57 (0.33–0.98) | 0.48 (0.27–0.84) | −0.2% (−0.6 to 0.3) | 0.75 (0.48–1.18) | |
| Cardiac death | |||||||||
| 2004–2006 | 2.3% (1.9–2.8) | Reference | Reference | 1.8% (1.2–2.6) | Reference | Reference | −0.5% (−1.3 to 0.3) | 0.69 (0.45–1.03) | |
| 2007–2009 | 2.0% (1.6–2.4) | 0.87 (0.66–1.15) | 0.83 (0.65–1.11) | 1.6% (1.1–2.2) | 0.87 (0.53–1.43) | 0.81 (0.49–1.34) | −0.4% (−1.1 to 0.2) | 0.67 (0.46–0.99) | |
| 2010–2012 | 1.1% (0.9–1.5) | 0.49 (0.35–0.68) | 0.44 (0.31–0.62) | 1.3% (0.9–1.8) | 0.72 (0.43–1.21) | 0.64 (0.38–1.09) | 0.2% (−0.4 to 0.7) | 1.02 (0.65–1.59) | |
| 2013–2016 | 1.0% (0.8–1.3) | 0.45 (0.33–0.62) | 0.41 (0.30–0.57) | 0.6% (0.4–1.0) | 0.35 (0.19–0.64) | 0.31 (0.17–0.56) | −0.4% (−0.8 to −0.01) | 0.56 (0.33–0.97) | |
| All-cause death | |||||||||
| 2004–2006 | 5.1% (4.5–5.8) | Reference | Reference | 4.5% (3.6–5.6) | Reference | Reference | −0.6% (−1.8 to 0.6) | 0.77 (0.59–1.01) | |
| 2007–2009 | 5.3% (4.8–6.0) | 1.03 (0.87–1.24) | 1.02 (0.86–1.22) | 4.5% (3.7–5.4) | 0.99 (0.73–1.34) | 0.97 (0.71–1.32) | −0.9% (−1.9 to 0.2) | 0.73 (0.58–0.92) | |
| 2010–2012 | 4.2% (3.7–4.9) | 0.82 (0.68–0.99) | 0.75 (0.62–0.91) | 4.4% (3.7–5.4) | 0.98 (0.73–1.33) | 0.93 (0.68–1.27) | 0.2% (−0.8 to 1.2) | 0.93 (0.73–1.19) | |
| 2013–2016 | 3.9% (3.4–4.4) | 0.75 (0.63–0.91) | 0.68 (0.57–0.83) | 2.7% (2.2–3.4) | 0.60 (0.43–0.83) | 0.55 (0.40–0.77) | −1.2% (−2.0 to −0.4) | 0.63 (0.49–0.82) | |
Adjusted for age, smoking, diabetes, hypertension, peripheral artery disease, statin treatment, antiplatelet treatment, and oral anti-coagulant treatment. In ischaemic stroke and death, additionally adjusted for atrial fibrillation, previous ischaemic stroke, and heart failure.
Revascularization decreased within the first 3 months after index coronary angiography by either percutaneous coronary intervention (49.0% vs. 40.4%) and coronary artery bypass grafting (21.4% vs. 16.4%) (Table 2). Men were more likely to undergo revascularization throughout the inclusion period compared to women (Supplementary material online, Table S9). Restricting the analyses to patients with obstructive coronary artery disease on the coronary angiography, risks of myocardial infarction, ischaemic stroke, cardiac death, and all-cause death continued to decrease, while the rate of percutaneous coronary intervention increased by 13% and the rate of coronary artery bypass grafting decreased by 14% (Supplementary material online, Table S10). When further restricting analyses to patients with 3-vessel disease only, we observed no change in myocardial infarction risk, however, ischaemic stroke, cardiac death, and all-cause death remained reduced by 52%, 40%, and 32%, respectively (Supplementary material online, Table S11).
Sensitivity analysis including patients with previous myocardial infarction or coronary revascularization yielded similar results as the main analysis (Supplementary material online, Table S12). The 2-year risk of myocardial infarction remained stable throughout the inclusion period in patients with normal angiograms (0.3–0.5%), however, the relative risks associated with coronary artery disease declined from a 7-fold increased risk to approximately 3-fold increased risk in the following examination year intervals (Supplementary material online, Table S13). High-intensity statin was not associated with a significant reduction in myocardial infarction compared to simvastatin (adjusted incidence rate ratio 0.94, 95% confidence interval 0.78–1.12).
Discussion
In this large population-based study of patients with chronic coronary syndrome, we provide real-world data on the temporal trend in cardiovascular risk in men and women with documented coronary artery disease. From 2004 to 2016, a time period where new evidence-based treatment opportunities for coronary artery disease gradually have been adopted by European and US guidelines, cardiovascular event risk decreased substantially and were evident immediately after coronary angiography (0–90 days) as well as during long-term follow-up (3–24 months). Although part of the improved prognosis may be due to declining coronary artery disease severity among patients undergoing coronary angiography (i.e. fewer patients with 2- and 3-vessel disease), the improved prognosis was also observed in analyses restricted to patients with obstructive coronary artery disease as well as to patients with 3-vessel disease. Thus, the markedly improved prognosis in contemporary coronary artery disease patients likely reflect the cumulative effect of improvements in the management of symptomatic coronary artery disease patients, including optimized lesion assessment,13–16 improved stent technology,17 implementation of rehabilitation programmes,18 stricter guideline-directed risk factor control, and use of more efficient preventive therapeutics, including more potent statins.19
The most important finding in our study is the steady risk reduction from study interval to study interval, throughout the entire study period, for each single endpoint. This included a 35% reduction of myocardial infarction, a 52% reduction in stroke, and a 35% reduction of all-cause death. These results were similar for men and women. Interestingly, the improved prognosis coincided with reduced use of revascularizations. In a British study, the incidence of coronary artery disease remained stable from 2006 to 2015.20 During the same period, cardiac death decreased by 40% in patients diagnosed with coronary artery disease. Similar results were seen for myocardial infarction and ischaemic stroke. In 2 Swedish studies of patients with acute coronary syndromes, the use of antiplatelet drugs, antihypertensive drugs, and statins increased during the study period of 1995–2014.21,22 They reported a corresponding reduction in 1-year mortality and adverse ischaemic events, findings confirmed among patients with chronic coronary syndrome in this study.21,22 Such changes can be explained by changes in the baseline characteristics and/or by improved preventive treatment following the diagnosis. The baseline characteristics in our cohort, however, did not suggest that patients had less comorbidities over time. In fact, the opposite was found for several diseases such as previous stroke, atrial fibrillation, renal disease, and diabetes. Smoking, however, became less prevalent in our study period. This is one of several factors that may explain the major risk reductions observed. Coronary computed tomography angiography and other non-invasive imaging modalities are used more frequently in elective patients in Western Denmark.5 Compared to coronary angiography, coronary computed tomography angiography provides high-specificity information on disease severity and plaque characteristics and is currently recommended in diagnosing chronic coronary syndrome.23,24 With the increased implementation of non-invasive imaging in recent years, the pre-test likelihood of coronary artery disease in elective patients examined by coronary angiography may have increased, as patients with normal or insignificant disease would not be referred to coronary angiography in the later examination year intervals. Other contributing factors include the introduction of coronary pressure measurements, which have led to a refined assessment of stenosis significance and likely explains the downgrading of coronary artery disease severity over time as well as leading to a more accurate selection of patients who would benefit the most from coronary revascularization.25 The gradual change from a purely visual angiographic assessment to a combination of angiographic assessment and pressure measurements have led to a reduced number of lesions being classified as haemodynamically significant.26 Fractional flow reserve-guided percutaneous coronary intervention is associated with a reduction in cardiovascular risk and has likely contributed to the clinical improvements observed throughout the inclusion period.27 Furthermore, to streamline the identification of chronic coronary syndrome in the primary health care sector, Danish authorities implemented formalized referral and diagnostic procedures for patients with suspected stable angina pectoris on 1 January 2012. This may have resulted in earlier disease detection from 2012 onward, leading to reduced atherosclerotic burden. We observed shifts in post-procedural lipid-lowering treatment from mainly simvastatin in beginning of the study to the more potent statins atorvastatin and rosuvastatin. These newer statins are more efficient in reducing LDL cholesterol than simvastatin,28 and atorvastatin has been shown to be superior to simvastatin in reducing the risk of myocardial infarction in patients with stable coronary artery disease.29 The patent protection of atorvastatin expired on 30 November 2011, which explains the substantial increase in atorvastatin use during the 2013–2016 period.30 Patients with stable angina pectoris are currently recommended high-dose atorvastatin after percutaneous coronary intervention to achieve a reduction in peri-procedural myocardial infarction risk compared to low-dose statin.19,31 Overall, proportions of pre- and post-procedural statin treatment remained similar during the study period, yet treatment intensity changed. However, we found no significant reduction associated with high-intensity statin treatment. Lastly, optimal antihypertensive medical treatment strategies are other factors that have likely contributed to reduced atherosclerotic burden and subsequent risk reductions.
Other potential contributing factors deserve consideration. First, in 2004 Denmark became the first country to ban use of industrial trans fats in food products. It has been estimated that cardiovascular mortality decreased by 14.2 deaths per 100 000 people per year in Denmark following the ban.32 Second, coronary stents were substantially improved between 2004 and 2016. The transition from bare-metal stents and first-generation drug-eluting stents to newer-generation drug-eluting stents has reduced the risk of stent thrombosis and subsequent myocardial infarction in patients undergoing percutaneous coronary intervention.33 Third, new therapeutic options such as biventricular pacing and implantable cardioverter-defibrillators may overall have influenced clinical outcomes favourably.
Women had lower cardiovascular risk following diagnosis of chronic coronary syndrome than men despite lower revascularization rates and post-coronary angiography preventative treatment frequency. The difference in mortality between the sexes was the greatest in the most recent examination period (2013–2016). We also observed a more severe burden of coronary artery disease among men than women, which may explain the minor differences in absolute risks. Less than 30% of participants in cardiovascular randomized trials are women, reflecting the sex-distribution in our real-world cohort of patients with chronic coronary syndrome.4 Our results suggest that, despite not being equally represented in randomized clinical trials, women have improved their cardiovascular risk to a similar extent as men, and women remained at lower risk throughout the study period.
Limitations
Some limitations have been discussed above. Furthermore, since our study is registry-based, changes in registration patterns may have affected baseline comorbidities and outcomes. For instance, as the definition of myocardial infarction changed in 2007 and 2012, the diagnostic threshold of myocardial infarction may have risen during the study period.34,35 Introduction of high-sensitivity troponin assays has been associated with an increased incidence of myocardial infarction and coronary revascularization.36 As such, the decreasing rates of myocardial infarction and revascularization in this study occurred in spite of the transition to high-sensitivity troponin assays, and we thus likely have underestimated the actual reduction in myocardial infarction rates during the study period. We are unable to estimate the completeness of revascularization during index angiography.
In conclusion, we observed major reductions in risk of cardiovascular events in patients with chronic coronary syndrome from 2004 to 2016. Reductions were seen in both men and women, however, women had lower risk than men. These improvements likely reflect the cumulative effect of multiple evidence-based changes in the management of patients with chronic coronary syndrome, including smoking cessation, more efficient coronary stents, and more qualified assessment of coronary artery disease severity.
Supplementary material
Supplementary material is available at European Heart Journal – Quality of Care and Clinical Outcomes online.
Funding
This work was supported by the Research Unit, Department of Cardiology, Aarhus University Hospital, Aarhus, Denmark.
Conflict of interest: K.K.W.O. has received a speaking fee from Bayer. M.W. has received lecture fees and advisory board fees from Bayer, BMS/Pfizer, and Boehringer-Ingelheim. B.L.N. has received research grants from Siemens and HeartFlow. H.T.S. reports that the Department of Clinical Epidemiology is involved in studies with funding from various companies as research grants to and administered by Aarhus University. None of these studies are related to the current study. M.M. has received advisory board fees from Boehringer-Ingelheim, AstraZeneca, Novo Nordisk, BMS, Boston Scientific, and Bayer. E.S.J., C.G., M.B.M., and H.E.B. have no disclosures to report.
Data availability statement
The data underlying this article cannot be shared publicly due to Danish data protection regulations and cannot be shared upon request.
