


Abstract
We sought to investigate if sex disparity exists for secondary prevention pharmacotherapy following acute coronary syndrome (ACS) and impact on long-term clinical outcomes.
We analysed data on medical management 30-day post-percutaneous coronary intervention (PCI) for ACS in 20 976 patients within the multicentre Melbourne Interventional Group registry (2005–2017). Optimal medical therapy (OMT) was defined as five guideline-recommended medications, near-optimal medical therapy (NMT) as four medications, sub-optimal medical therapy (SMT) as ≤3 medications. Overall, 65% of patients received OMT, 27% NMT and 8% SMT. Mean age was 64 ± 12 years; 24% (4931) were female. Women were older (68 ± 12 vs. 62 ± 12 years) and had more comorbidities. Women were less likely to receive OMT (61% vs. 66%) and more likely to receive SMT (10% vs. 8%) compared to men, P < 0.001. On long-term follow-up (median 5 years, interquartile range 2–8 years), women had higher unadjusted mortality (20% vs. 13%, P < 0.001). However, after adjusting for medical therapy and baseline risk, women had lower long-term mortality [hazard ratio (HR) 0.88, 95% confidence interval (CI) 0.79–0.98; P = 0.02]. NMT (HR 1.17, 95% CI 1.05–1.31; P = 0.004) and SMT (HR 1.79, 95% CI 1.55–2.07; P < 0.001) were found to be independent predictors of long-term mortality.
Women are less likely to be prescribed optimal secondary prevention medications following PCI for ACS. Lower adjusted long-term mortality amongst women suggests that as well as baseline differences between gender, optimization of secondary prevention medical therapy amongst women can lead to improved outcomes. This highlights the need to focus on minimizing the gap in secondary prevention pharmacotherapy between sexes following ACS.
Introduction
Cardiovascular disease remains the leading cause of death in women worldwide,1 with women being more than three times as likely to die from coronary heart disease than from breast cancer.2 While the prevalence of coronary heart disease continues to fall overall, the rate of decline amongst women is only half that of men, with a decrease in prevalence of 2.3% and 5.4% respectively over the last decade.1 Of particular concern is increasing rates of death from ischaemic heart disease in women aged 35–44, while rates in aged-matched men continue to decline.3,4 It has been well established that women have differing physiology which leads to its own unique set of cardiovascular risk factors.4 However, these unique characteristics do not account for all differences in treatment and outcomes for women presenting with acute coronary syndrome (ACS). Women are more likely to be misdiagnosed, less likely to undergo coronary angiography and are less likely to have percutaneous coronary intervention (PCI) within 72 h of admission compared to men.5,6 In addition to documented discrepancies in in-hospital management following ACS, several studies have identified that women are less likely to be prescribed secondary prevention medications at discharge.3,5,6 A recent meta-analysis of randomized controlled data demonstrated women presenting with non-ST-elevation ACS were less likely to be treated with aspirin and statins despite their baseline risk profile being higher.7 This translated into poorer unadjusted outcomes in women, but similar outcomes by sex after adjustment for baseline differences and medical therapy.7 Secondary prevention medications for cardiovascular events are known to reduce recurrence of events and improve outcomes.8,9 Currently, there is a paucity of data detailing the impact of sex discrepancy in secondary prevention medication prescribing on long-term outcomes. We aimed to explore if sex discrepancy in secondary prevention medication prescribing existed within a large multicentre registry and what impact this had on short- and long-term outcomes.
Methods
We analysed prospectively collected data from 20 976 consecutive patients from the multicentre Melbourne Interventional Group (MIG) registry between January 2005 and June 2017. Adults greater than 18 years presenting with ACS and proceeding to PCI who were alive at 30 days were included. Those with incomplete data on medication use at 30 days were excluded from analysis (5.2%). Patients were grouped according to documented sex (female, male) and secondary prevention medication status [optimal medical therapy (OMT), near-optimal medical therapy (NMT) and sub-optimal medical therapy (SMT)].
The primary outcome was OMT vs. NMT vs. SMT secondary prevention medications between sexes at 30 days. Secondary outcomes included all-cause mortality, recurrent myocardial infarction (MI), target vessel revascularization (TVR), stroke, rehospitalization, and major adverse cardiac and cerebrovascular events (MACCE) at 30 days and 12 months, as well as long-term mortality.
The MIG registry, established 2005, is a collaboration between six major public hospitals across Victoria, Australia.10,11 The six hospitals include both metropolitan and regional representation and range in size from 400 to 900 beds, averaging 630 beds. Every public (government funded) hospital in Australia is a university-affiliated teaching hospital and they account for the majority of hospitalizations for ACS at a state and national level. Four of the six included hospitals have on-site cardiothoracic surgery services available. Coordination of the registry is undertaken by the Centre for Cardiovascular Research and Education in Therapeutics within the Department of Epidemiology and Preventive Medicine, Monash University, Melbourne, Australia. MIG undergoes periodic auditing processes by an independent party to ensure robust and accurate data collection by participating sites. The most recent audit demonstrated highly accurate data collection, with agreement of 98%.12 The registry runs on an ‘opt-out’ consent method, and has ethics committee approval from all participating sites. MIG will share de-identified data analysed for the purpose of this study on reasonable request with permission of the corresponding author.
Guideline-recommended medications are defined as per recommendations for secondary prevention of cardiovascular disease from both European and American evidence-based guidelines.8,9 These include the following five medication classes: aspirin, P2Y12 inhibitor, beta-blocker, renin–angiotensin–aldosterone system blockers [angiotensin converting enzyme inhibitor (ACEi)/angiotensin II receptor blocker (ARB)], and cholesterol-lowering agents (statin/fibrate/ezetimibe). We defined OMT as all five guideline-recommended medication classes. NMT is defined as four of the five guideline-recommended medication classes. SMT is defined as three or less guideline-recommended medication classes.
MIG utilizes standardized definitions for data collection across participating sites.11 Data abstraction is performed by interventional cardiologists or cardiac-trained research nurses.11 Follow-up data at 30 days and 12 months is obtained via contact with patients or treating practitioners by telephone and verified against medical records. All events are independently verified by the data managers at each site. ACS definition includes unstable angina (UA), non-ST-elevation myocardial infarction (NSTEMI), and ST-elevation myocardial infarction (STEMI). UA is defined as prolonged ischaemic chest pain that is occurring at rest, in the absence of elevation of biomarkers for myocardial necrosis. NSTEMI defined as ischaemic chest pain with elevation in biomarkers for myocardial necrosis, with or without ischaemic changes on electrocardiogram (ECG), such as ST-segment depression or T-wave abnormalities. STEMI is defined as typical clinical features, elevation in biomarkers for myocardial necrosis and ECG changes of either ST-segment elevation or development of new pathological Q-waves in two contiguous leads. Recurrent MI utilizes the same definitions and includes ACS occurring after the primary event and prior to follow-up. TVR is defined as any repeated percutaneous revascularization within the target coronary artery and/or the same arterial branch. Stroke is defined as loss of neurological function persisting for >72 h caused by an ischaemic or haemorrhagic event. Rehospitalization includes readmission to any Hospital following discharge post the primary event and prior to follow-up. MACCE includes recurrent MI, stent thrombosis, TVR or stroke, with the addition of all-cause mortality at 12 months.
Long-term mortality is collected via linkage with the Australian National Death Index (NDI).13 The NDI is a database linked with the Registry of Births, Deaths and Marriages in each Australian state and territory. Demographic data (name, date of birth, age at death, sex, date of death, state/territory of registration and registration number) are used to match deceased patients in the NDI database with those in the MIG registry database.
Categorical variables were analysed with Pearson chi-squared test and expressed as counts (proportions). Continuous variables were analysed with Student’s t-test or Kruskal–Wallis rank test and expressed as mean (± standard deviation) or median (interquartile range) as appropriate. Kaplan–Meier method was used to produce survival curves for sex and medical therapy, with differences in survival assessed using the log-rank test. We explored the relationship between secondary prevention medical therapy, sex and long-term mortality using multivariable Cox proportional hazards regression model. Variables were included in the final model if the P-value on univariable analysis was <0.10. If correlation was high between two variables, only one was included in the final model. The final model included the following variables; medical therapy (OMT/NMT/SMT), sex, age, diabetes mellitus, renal function, heart failure, left ventricular ejection fraction, chronic obstructive pulmonary disease (COPD), cerebrovascular disease, previous MI, femoral access, ACS type (UA/NSTEMI/STEMI), and rheumatoid arthritis. A subgroup analysis of the STEMI cohort was performed in order to capture those with a non-disputed indication for all five medication classes. A two-sided P-value of <0.05 was considered statistically significant. All statistical analyses performed using Stata 15.0 (Stata-Corp LP, College Station, TX, USA).
Results
Amongst the total cohort of 20 976 patients, 4931 (24%) women and 16 045 (76%) men underwent PCI for ACS. Table 1 summarizes baseline, presentation and angiographic characteristics between sexes. The mean age for the overall cohort was 64 ± 12 years, with women being on average 6 years older. Women also had more comorbidities compared to their male counterparts, with higher mean body mass index and higher prevalence of hypertension, dyslipidaemia, diabetes mellitus, renal dysfunction, prior heart failure, COPD, stroke, rheumatoid arthritis, and atrial fibrillation. Men were more likely to be current or ex-smokers and were more likely to have had previous MI, previous PCI and previous coronary bypass surgery compared to women. Women were more likely to present with UA or NSTEMI, while men were more likely to present with STEMI and out-of-hospital cardiac arrest, P < 0.001. For the STEMI cohort of 9350 patients, women had on average 14 min longer symptom-to-door time and 9 minutes longer door-to-balloon time compared to men, P < 0.001. In the catheterization laboratory, women were less likely to have radial access, P < 0.001.
Comparison of baseline, presentation and angiographic characteristics between sexes for patients undergoing percutaneous intervention for acute coronary syndrome
| Characteristic | Female (n = 4931) | Male (n = 16 045) | P-value |
|---|---|---|---|
| Age (years) | 68 ± 12 | 62 ± 12 | <0.001 |
| BMI (kg/m2) | 29 ± 7 | 28 ± 5 | <0.001 |
| Hypertension | 71% (3489) | 58% (9370) | <0.001 |
| Dyslipidaemia | 63% (3107) | 60% (9678) | 0.001 |
| Current smoker | 27% (1331) | 32% (5125) | <0.001 |
| Ex-smoker | 26% (1285) | 39% (6218) | |
| Diabetes mellitus | 27% (1315) | 21% (3308) | |
| eGFR (mL/min/1.73 m2) | |||
| <30 | 4.4% (209) | 2.2% (342) | <0.001 |
| 30–60 | 29% (1373) | 16% (2442) | |
| >60 | 67% (3195) | 82% (12 553) | |
| Existing heart failure | 4.0% (196) | 2.7% (438) | <0.001 |
| COPD | 6.4% (316) | 5.4% (867) | 0.007 |
| Cerebrovascular disease | 6.6% (327) | 4.7% (761) | <0.001 |
| PVD | 5.5% (270) | 5.1% (813) | 0.26 |
| OSA | 2.4% (117) | 4.1% (653) | <0.001 |
| Rheumatoid arthritis | 3.6% (170) | 1.5% (227) | <0.001 |
| Atrial fibrillation | 5.9% (239) | 4.6% (605) | <0.001 |
| Previous myocardial infarction | 18% (885) | 21% (3381) | <0.001 |
| Previous PCI | 16% (773) | 19% (3002) | <0.001 |
| Previous CABG | 5.4% (268) | 6.5% (1043) | 0.007 |
| Family history of CAD | 39% (1827) | 38% (5809) | 0.29 |
| Cardiac status at presentation | |||
| Unstable angina | 15% (744) | 13% (2024) | <0.001 |
| NSTEMI | 45% (2210) | 41% (6648) | |
| STEMI | 40% (1977) | 46% (7373) | |
| OHCA | 1.8% (87) | 3.3% (536) | |
| STEMI cohort, n = 9350 | |||
| Symptom-to-door time (min) | 126 (80–240) | 112 (70–208) | <0.001 |
| Door-to-balloon time (min) | 84 (52–130) | 75 (49–115) | <0.001 |
| Symptom-to-balloon time (min) | 220 (154–361) | 200 (142–323) | <0.001 |
| New heart failure (within last 2 weeks) | 5.4% (266) | 4.3% (681) | 0.001 |
| Ejection fraction | 0.002 | ||
| >45% | 76% (3376) | 74% (10 815) | |
| 30–45% | 22% (980) | 24% (3540) | |
| <30% | 1.8% (80) | 1.4% (205) | |
| Cardiogenic shock | 3.2% (160) | 2.9% (461) | 0.18 |
| Single-vessel disease | 45% (2235) | 42% (6679) | <0.001 |
| Double-vessel disease | 23% (1118) | 24% (3866) | |
| Triple-vessel disease | 12% (583) | 15% (2366) | |
| Left main disease | 8.1% (138) | 6.6% (413) | |
| In catheterization laboratory | |||
| Heart rate (b.p.m.) | 75 ± 15 | 73 ± 16 | <0.001 |
| Systolic blood pressure (mmHg) | 134 ± 27 | 127 ± 24 | <0.001 |
| Intra-aortic balloon pump | 2.1% (70) | 2.9% (318) | 0.005 |
| On inotropes | 3.3% (105) | 3.1% (328) | 0.6 |
| Radial/brachial access | 22% (1062) | 25% (4039) | <0.001 |
| Femoral access | 79% (3868) | 75% (12 006) | |
| GP IIb/IIIa blockade | 34% (1690) | 40% (6430) | |
| Lesion information | |||
| ACC/AHA lesion type B2 and C | 57% (2819) | 59% (9456) | 0.03 |
| Chronic total occlusion | 1.7% (85) | 2.0% (324) | 0.19 |
| Estimated lesion length (mm) | 19.7 ± 9.1 | 20.3 ± 9.1 | <0.001 |
| No reflow | 4.0% (189) | 3.9% (590) | 0.51 |
| DES | 51% (2499) | 50% (8039) | 0.48 |
| BMS | 41% (2032) | 41% (6646) | 0.79 |
| BMS and DES | 0.6% (27) | 0.5% (84) | 0.84 |
| POBA | 6.7% (328) | 6.4% (1030) | 0.56 |
| Mean stent length (mm) | 17.7 ± 5.8 | 18.4 ± 6.0 | <0.001 |
Continuous variables presented as mean ± standard deviation or median (interquartile range) as appropriate. Categorical variables presented as % (number).
ACC/AHA, American College of Cardiology/American Heart Association; BMI, body mass index; BMS, bare metal stent; CABG, coronary artery bypass grafting; CAD, coronary artery disease; COPD, chronic obstructive pulmonary disease; DES, drug eluting stent; eGFR, estimated glomerular filtration rate; IRDM, insulin requiring diabetes mellitus; NIRDM, non-insulin requiring diabetes mellitus; NSTEMI, non-ST-elevation myocardial infarction; OHCA, out of hospital cardiac arrest; OSA, obstructive sleep apnoea; PCI, percutaneous coronary intervention; POBA, plain old balloon angioplasty; PVD, peripheral vascular disease; STEMI, ST-elevation myocardial infarction.
At 30 days, 65% of the overall cohort were prescribed optimal secondary prevention medical therapy. Women were significantly less likely to be prescribed OMT (61% vs. 66%) and more likely to be prescribed SMT (10% vs. 7.7%) compared to men, P < 0.001. Table 2 details secondary prevention pharmacotherapy between sexes, including details for each medication class. Women demonstrated consistently lower rates of OMT over the study period, with overall trends for OMT remaining stable (P for trend = 0.11); see Figure 1.
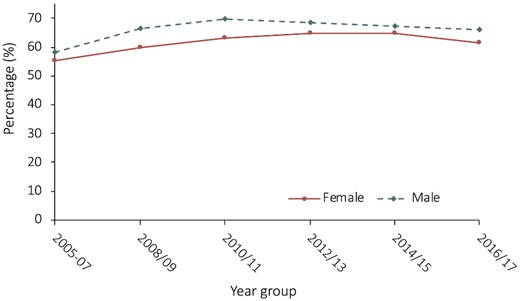
Rates of optimal medical therapy in year groups over the study period, stratified by sex. Females had consistently lower rates of optimal medical therapy over the study period, with optimal medical therapy rates between sexes remaining stable over the course of follow-up; P-value for trend = 0.11.
Comparison of secondary prevention pharmacotherapy between sexes following percutaneous coronary intervention for acute coronary syndrome
| Female (n = 4931) | Male (n = 16 045) | P-value | |
|---|---|---|---|
| Medication at 30 days | <0.001 | ||
| OMT | 61% (3024) | 66% (10 525) | |
| NMT | 29% (1410) | 27% (4282) | |
| SMT | 10% (497) | 7.7% (1236) | |
| Medication by class at 30 days | |||
| Aspirin | 96.9% (4774) | 97.3% (15 598) | 0.13 |
| P2Y12 inhibitor | 95.8% (4920) | 96.5% (15 443) | 0.03 |
| Clopidogrel | 71.3% (3500) | 65.4% (10 466) | <0.001 |
| Ticagrelora | 41.1% (1033) | 45.0% (3774) | 0.001 |
| Prasugrela | 5.6% (187) | 11.0% (1210) | <0.001 |
| Anti-cholesterol agent | 95.0% (4658) | 96.8% (15 440) | <0.001 |
| Statin | 94.0% (4602) | 96.2% (15 309) | <0.001 |
| Fibrate | 1.2% (51) | 1.5% (215) | 0.11 |
| Ezetimibe | 4.6% (200) | 4.3% (607) | 0.30 |
| ACEi/ARB | 81.2% (3979) | 83.7% (13 314) | <0.001 |
| Beta blocker | 81.6% (3994) | 83.9% (13 335) | <0.001 |
| Warfarin | 7.0% (341) | 7.4% (1170) | 0.38 |
| DOACa | 2.2% (56) | 1.9% (156) | 0.24 |
| MRA | 5.5% (238) | 4.6% (660) | 0.02 |
Smaller denominator due to introduction to the market 5 or more years after commencement of MIG Registry.
ACEi, angiotensin converting enzyme inhibitor; ARB, angiotensin receptor blocker; DOAC, direct oral anticoagulant; MRA, mineralocorticoid receptor antagonist; NMT, near optimal medical therapy; OMT, optimal medical therapy; SMT, suboptimal medical therapy.
This discrepancy between sexes remained in a subgroup analysis of the STEMI cohort alone (n = 9350), found in Supplementary material online, Table S1. Women were significantly less likely to be prescribed OMT (66% vs. 73%) and more likely be prescribed SMT (8.6% vs. 5.6%), P < 0.001.
There was no sex difference for prescription of aspirin, however, women were less likely to be prescribed a second anti-platelet agent (P = 0.03), a statin (P < 0.001), an ACEi/ARB (P < 0.001), and a beta blocker (P < 0.001) compared to men. Within the P2Y12 class of medication, women were more likely to be prescribed clopidogrel (P < 0.001) and less likely to be prescribed ticagrelor (P = 0.001).
Table 3 summarizes comparison of outcomes between sexes. At 30-day women were significantly more likely to have experienced stroke (P = 0.002) and rehospitalization (P < 0.001) compared to men. However, rates of recurrent MI, TVR and MACCE were similar between the groups. At 12-month follow-up (n = 17 224) nearly all outcomes differed significantly between sexes. Women were significantly more likely to have suffered recurrent MI (P = 0.001), stroke (P < 0.001), rehospitalization (P < 0.001), and MACCE (P = 0.001) compared to men.
Comparison of outcomes between sexes following percutaneous intervention for acute coronary syndrome
| Female | Male | P-value | |
|---|---|---|---|
| 30-day outcomes | n = 4931 | n = 16 045 | |
| Recurrent MI | 1.9% (94) | 1.7% (265) | 0.23 |
| Target vessel revascularization | 2.4% (119) | 2.5% (397) | 0.81 |
| Stroke | 0.7% (34) | 0.4% (57) | 0.002 |
| Rehospitalization | 16% (765) | 13% (2050) | <0.001 |
| MACCE | 4.1% (204) | 3.7% (600) | 0.20 |
| 12-month outcomes | n = 4117 | n = 13 107 | |
| Recurrent MI | 6.0% (246) | 4.7% (610) | 0.001 |
| Target vessel revascularization | 7.1% (293) | 7.2% (949) | 0.79 |
| Stroke | 1.5% (60) | 0.8% (101) | <0.001 |
| Rehospitalization | 41% (1642) | 34% (4418) | <0.001 |
| All-cause mortality | 2.6% (116) | 2.2% (317) | 0.11 |
| MACCE | 14% (570) | 12% (1561) | 0.001 |
| Long-term all-cause mortality | n = 4931 | n = 16 045 | |
| Median follow-up, years | 5 (2–8) | 5 (2–8) | 0.12 |
| Overall | 20% (951) | 13% (2095) | <0.001 |
| OMT, n = 13 395 | 17% (497) | 10% (1076) | <0.001 |
| NMT, n = 5639 | 22% (301) | 17% (710) | <0.001 |
| SMT, n = 1717 | 31% (153) | 25% (309) | 0.02 |
MACCE, major adverse cardiac and cerebrovascular events, included MI or stent thrombosis, target vessel revascularization and stroke, plus all-cause mortality at 12 months; MI, myocardial infarction; NDI, national death index; NMT, near optimal medical therapy, includes four guideline recommended medications; OMT, optimal medical therapy, includes five guideline recommended medications; SMT, suboptimal medical therapy, includes ≤3 guideline recommended medications.
Overall NDI-linked long-term mortality for the entire cohort was 15%, with a median follow-up of 5 years (interquartile range 2–8 years). Overall long-term mortality rates increased as secondary prevention medical therapy decreased; for those on OMT overall long-term mortality was 12%, increasing to 18% for those on NMT, and further increasing to 27% for those on SMT. Women had significantly higher long-term mortality overall compared to men; with a mortality rate of 20% in women compared to only 13% in men, P < 0.001. Women also had higher rates of mortality within each of the secondary prevention medical therapy subgroups. For OMT, long-term mortality was 17% for women compared to 10% for men, P < 0.001. For women on NMT, mortality rates were 22%, compared to rates of 17% for men, P < 0.001. And for those on SMT, rates of long-term mortality reached 31% for women and 25% for men, P = 0.02. These results are summarized in Table 3.
Figure 2 depicts Kaplan–Meier survival analysis curve for long-term mortality, demonstrating that women prescribed SMT have significantly poorer outcomes overall, and women prescribed OMT have poorer long-term outcomes than men prescribed NMT, log-rank P < 0.001.
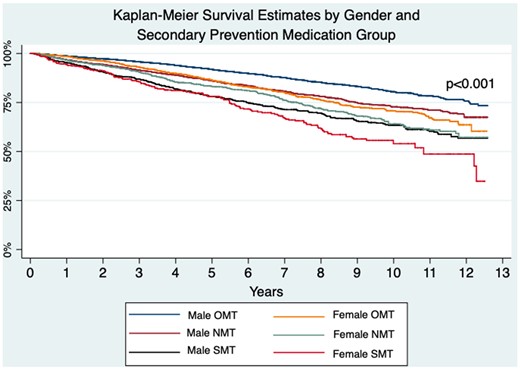
Kaplan–Meier long-term survival estimates by sex and secondary prevention medication group. Demonstrating women on suboptimal medical therapy have the highest long-term mortality overall, and men on optimal medical therapy and near-optimal medical therapy have better long-term mortality than women on optimal medical therapy, log-rank P < 0.001.
Multivariable analysis (Table 4) demonstrated that when accounting for differences in secondary prevention medical therapy and other potential confounders, women had 22% lower risk of long-term mortality compared to men [hazard ratio (HR) 0.88, 95% confidence interval (CI) 0.79–0.98, P = 0.02]. This analysis also demonstrated that NMT (HR 1.17, 95% CI 1.05–1.31, P = 0.004) and SMT (HR 1.79, 95% CI 1.55–2.07, P < 0.001) were independent predictors of poorer long-term mortality.
Multivariable Cox proportional hazards regression analysis for long-term mortality in all patients presenting with ACS (n = 12 717)
| HR (95%CI) | P-value | |
|---|---|---|
| Medical therapy | ||
| Optimal medical therapy | 1.00 | |
| Near optimal medical therapy | 1.17 (1.05–1.31) | 0.004 |
| Suboptimal medical therapy | 1.79 (1.55–2.07) | <0.001 |
| Sex, female | 0.88 (0.79–0.98) | 0.02 |
| Age, per year | 1.07 (1.07–1.08) | <0.001 |
| Diabetes status | ||
| No DM | 1.00 | |
| NIRDM | 1.37 (1.22–1.54) | <0.001 |
| IRDM | 1.95 (1.64–2.32) | <0.001 |
| eGFR, mL/min/1.73 m² | ||
| >60 | 1.00 | |
| 30–60 | 1.46 (1.30–1.63) | <0.001 |
| <30 | 3.35 (2.77–4.03) | <0.001 |
| Heart failure | 1.26 (1.04–1.51) | 0.02 |
| LV ejection fraction | ||
| >45% | 1.00 | |
| 30–45% | 1.38 (1.24–1.53) | <0.001 |
| <30% | 1.69 (1.33–2.16) | <0.001 |
| COPD | 2.08 (1.8–2.39) | <0.001 |
| Cerebrovascular disease | 1.37 (1.19–1.59) | <0.001 |
| Previous myocardial infarction | 1.39 (1.25–1.55) | <0.001 |
| Femoral access | 1.19 (1.02–1.40) | 0.03 |
| ACS type | ||
| STEMI | 1.00 | |
| NSTEMI | 1.00 (0.89–1.11) | 0.95 |
| UA | 0.79 (0.67–0.93) | 0.005 |
| Rheumatoid arthritis | 1.78 (1.39–2.29) | <0.001 |
ACS, acute coronary syndrome; COPD, chronic obstructive pulmonary disease; DM, diabetes mellitus; eGFR, estimated glomerular filtration rate; IRDM, insulin requiring diabetes mellitus; LV, left ventricle; NIRDM, non-insulin requiring diabetes mellitus; NSTEMI, non-ST-elevation myocardial infarction; STEMI, ST-elevation myocardial infarction; UA, unstable angina.
In the STEMI subgroup analysis (Supplementary material online, Table S2), there was no difference in long-term mortality between sexes (HR 1.03, 95% CI 0.86–1.22; P = 0.29).
Discussion
The main finding from this large multicentre registry is that, compared to men, women are significantly less likely to receive OMT following PCI for ACS. Despite higher baseline risk profile, rates of OMT at 30 days were 5% lower in women as compared to men. Within the STEMI cohort, this gap increased to 7% lower rates of OMT for women. This sex discrepancy remained stable over the course of the study, with women consistently having lower rates of OMT at each time period. We also identified that women have poorer unadjusted outcomes. At 12 months, women had significantly higher rates of recurrent MI, stroke, rehospitalization and MACCE. Long-term mortality was significantly higher in women, with 7% higher overall long-term mortality and 5–7% higher mortality amongst the pharmacotherapy subgroups (OMT, NMT, and SMT). However, our multivariable analysis, which adjusted for medical therapy in addition to other baseline characteristics, identified that women have better long-term survival compared to men within the all-comer cohort, and no sex difference in long-term mortality in the STEMI cohort. Additionally, our multivariable analysis identified that NMT and SMT were independent predictors of long-term mortality.
While the percentage difference between sexes for each medication class in this study appear small, it is important to consider these differences in real-world context. In 2015–2016, the number of Australians suffering ACS exceeded 100 000, of which 31% were women.14 This is a similar proportion of women seen in our dataset, and is also consistent with international data.7 These small percent differences equate to large absolute numbers of women who are not receiving optimal guideline-recommended secondary prevention pharmacotherapy following ACS.
Medical therapies were lower across nearly every medication class for women compared to men, which is consistent with previous observational and randomized controlled trial data.7,15–17 It has been reported that this disparity in secondary prevention pharmacotherapy is due to sex disparity in medication initiation rather than treatment adherence.16 Access to health care and prescriptions is unlikely to have impacted our results, as Australia is fortunate to have a Government funded universal health care scheme. This scheme provides free or low-cost health care to all Australians, including heavily subsidized medications.18 This Government funded scheme is likely an important factor in the high number of patients on at least four guideline-directed medications, with overall rate of 92% for combined OMT and NMT.
The lower rate of P2Y12 inhibitor prescription amongst women may be influenced by higher rates of in-hospital bleeding complications in women.19 However, despite women having increased rates of in-hospital bleeding complications, studies have demonstrated there is no sex difference for major bleeding risk at 12 months with use of dual antiplatelet therapy.15,20 It is important to recognize that women have higher rates of recurrent MI and ischaemic stroke; therefore, the risks vs. benefit of dual antiplatelet therapy need to be carefully assessed on an individual basis in order to reduce harm. Women had higher rates of baseline renal dysfunction, with 33% of women having an estimated glomerular filtration rate less than 60 mL/min/1.73 m2 compared to only 18% of men. This higher rate of renal dysfunction may have contributed to the lower rates of ACEi/ARB prescription amongst women. Many physicians remain cautious of prescribing ACEi/ARBs in patients with chronic kidney disease despite known long-term benefits.8,21,22 Lower rates of beta-blocker therapy amongst women may be a reflection of higher rates of underlying COPD in women, despite higher rates of current and ex-smokers amongst men. The use of cardio-selective beta blockers, such as nebivolol, has been shown to be well tolerated in patients with COPD and remain guideline-indicated therapy in this cohort.23,24 The lower rates of statin prescription for women is especially concerning given the higher rates of dyslipidaemia compared to men. This discrepancy may be related to previously reported higher rates of statin-related side effects in women, including statin-induced myopathy.25
It has been well described in the literature that women suffering ACS are older and have more comorbidities than their male counterparts,1,5,7,26 which is consistent with our findings. Previous reports have demonstrated that adjusting for these differences in baseline characteristics results in no difference in mortality between sexes following ACS,17,27,28 with some studies demonstrating a persisting increased mortality amongst women in STEMI cohorts even after adjustment.29 Similar to our results, Redfors et al.26 demonstrated that women had poorer unadjusted outcomes, however, after adjustment women had lower mortality than men in the NSTEMI cohort and similar mortality between sexes for STEMI patients. Women presenting with STEMI in our cohort had longer average time to revascularization compared to men, which may contribute to the pattern of these findings. Longer delays to reperfusion in women has been demonstrated in previous reports and is an important factor which has a more pronounced influence on outcomes in STEMI cohorts compared to NSTEMI cohorts.30 This pattern has also been demonstrated in a recently published meta-analysis of randomized controlled trial data. Sarma et al.7 combined data from the TIMI clinical trial database and identified higher rates of cardiovascular death, all-cause mortality, and stroke in women post-non ST-elevation acute coronary syndrome, which were attenuated on adjusted analysis. Our adjusted analysis controlled not only for baseline differences between sexes, but also for differences in secondary prevention medical therapy. A strength of our data is the long-term follow-up with median of 5 years, while previous reports are largely confined to follow-up less than 2-years. These robust long-term data suggest that optimization of baseline risk and secondary prevention medical therapy amongst women can lead to improved outcomes.
Within STEMI cohorts, use of protocols for patient care has shown to reduce the gap between sexes in treatment and outcomes.4,28 Within the more diverse NSTEACS cohort, use of protocols is controversial, however, it remains an important consideration for minimizing variability in care between sexes. The quality indicators for management of acute MI outlined by the European Society of Cardiology Acute Cardiovascular Care Association31 are an ideal frame work from which institutional specific protocols can be developed.
Study limitations
Some important limitations of this study include those inherent to the observational design. Our analysis has assumed OMT includes all five guideline-recommended medication classes. This fails to take into consideration circumstances in which not all five medication classes are indicated or where contraindications exist. There may be a proportion of patients on NMT or SMT that may not tolerate optimal guideline-directed medical therapy due to comorbidities such as severe heart failure or end stage renal failure. Such patients would also have an increased risk of mortality. We have attempted to account for this by inclusion of renal function and left ventricular ejection fraction in our multivariable analysis. One of the inclusion criteria for this study was being alive at 30 days, as this is when medication use is collected in the MIG registry. By excluding those who died within 30 days of procedure there is potential to introduce selection bias. Mortality within 30 days accounts for the majority of the 5.2% that were excluded due to incomplete medication data at 30 days, however, some of these were due to loss to follow-up, such as international or interstate patients returning home. The loss to follow-up at 12 months was due to specific centres within the registry no longer collecting 12-month data, therefore this loss is not random. However, the remaining 12-month data is from multiple sites and is sufficiently powered; therefore, is unlikely to have introduced bias. Sensitivity analysis excluding those without 12-month follow-up demonstrated similar outcomes.
Conclusions
Our report highlights that women are currently receiving lower rates of OMT following ACS compared to men and have higher rates of NMT or SMT, which we identified as independent predictors of long-term mortality. When adjusting for baseline risk in addition to medical therapy, women presenting with ACS have lower long-term mortality compared to men on robust follow-up of median 5 years. This highlights the importance of minimizing the gap in both baseline risk and secondary prevention pharmacotherapy between sexes in order to improve outcomes. Protocol-driven approaches may be one such method of achieving this.
Supplementary material
Supplementary material is available at European Heart Journal – Quality of Care and Clinical Outcomes online.
Acknowledgements
Sincerest thank you to the team at the Centre of Cardiovascular Research & Education in Therapeutics, Department of Epidemiology and Preventive Medicine, Monash University and Melbourne Interventional Group for maintaining a robust, prospective registry database. Without your tireless efforts this project, and many others, would not be possible. Thank you to all the patients included in the database, your contribution is invaluable.
Funding
The Melbourne Interventional Group gratefully acknowledges funding from: Abbott Vascular, Astra-Zeneca, BMS and Pfizer. These companies do not have access to data and do not have the right to review manuscripts or abstracts before publication. C.M.R. is supported by a National Health and Medical Research Council of Australia Principal Research Fellowship (reference no. 11136372). S.J.D. work is supported by a National Health and Medical Research Council of grant (reference no. 1111170).
Conflict of interest: none declared.
Data availability
Access to the de-identified data underlying this article will be considered by the MIG committee on reasonable request via email to the corresponding author.
