


Abstract
Limited data exist on the impact of COVID-19 on national changes in cardiac procedure activity, including patient characteristics and clinical outcomes before and during the COVID-19 pandemic.
All major cardiac procedures (n = 374 899) performed between 1 January and 31 May for the years 2018, 2019, and 2020 were analysed, stratified by procedure type and time-period (pre-COVID: January–May 2018 and 2019 and January–February 2020 and COVID: March–May 2020). Multivariable logistic regression was performed to examine the odds ratio (OR) of 30-day mortality for procedures performed in the COVID period. Overall, there was a deficit of 45 501 procedures during the COVID period compared to the monthly averages (March–May) in 2018–2019. Cardiac catheterization and device implantations were the most affected in terms of numbers (n = 19 637 and n = 10 453), whereas surgical procedures such as mitral valve replacement, other valve replacement/repair, atrioseptal defect/ventriculoseptal defect repair, and coronary artery bypass grafting were the most affected as a relative percentage difference (Δ) to previous years’ averages. Transcatheter aortic valve replacement was the least affected (Δ −10.6%). No difference in 30-day mortality was observed between pre-COVID and COVID time-periods for all cardiac procedures except cardiac catheterization [OR 1.25 95% confidence interval (CI) 1.07–1.47, P = 0.006] and cardiac device implantation (OR 1.35 95% CI 1.15–1.58, P < 0.001).
Cardiac procedural activity has significantly declined across England during the COVID-19 pandemic, with a deficit in excess of 45 000 procedures, without an increase in risk of mortality for most cardiac procedures performed during the pandemic. Major restructuring of cardiac services is necessary to deal with this deficit, which would inevitably impact long-term morbidity and mortality.
Introduction
The COVID-19 pandemic has had a substantial influence on the provision of healthcare globally. This has been particularly evident in across cardiac services, given the reliance on multidisciplinary teams and the need for intensive care unit (ICU) bed availability. Patients with cardiovascular disease were also subject to stricter isolation measures due to their increased risk of COVID-related death.1–5 While there have been multiple reports indicating a reduction in the volume of different cardiac procedures, these have been based on single-centre experiences or examination of specific procedures,3,6–9 rather than considering the broad spectrum of cardiac procedures from a national perspective. Therefore, little is known about the characteristics of patients undergoing procedures during the pandemic, and how these compare with those in the pre-COVID period. Furthermore, there is limited outcomes data for cardiac procedures performed prior to and during the COVID-19 pandemic.
The present study was designed to compare procedural activity between the pre-COVID and COVID period, as well as examine the associated 30-day mortality across cardiac procedures in England.
Methods
Data source, study design, and population
All major cardiac and cardiothoracic inpatient and outpatient procedures performed in adults (aged ≥18 years) in England 1 between January and 31 May for each of the years 2018, 2019, and 2020 were extracted from Hospital Episode Statistics (HES) (NHS Digital). The HES dataset collects all data on all hospital admissions, outpatient appointments, and accident and emergency attendances in NHS hospital.10 All elective and emergent/urgent hospital procedures studied included cardiac catheterization, cardiac device implantations, percutaneous coronary intervention (PCI), percutaneous ablation, coronary artery bypass grafting (CABG) surgery, surgical and transcatheter aortic valve replacements (SAVR and TAVR, respectively), mitral valve replacement (MVR), other valve replacement/repair, and atrioseptal and ventriculoseptal defects (ASD and VSD, respectively) repair. Given seasonality of procedural activity, we only included the first five months of each calendar year. Procedures were excluded if there was missing data for date and/or recording of death (n = 230). Patients who received multiple procedures (n = 35 984, 9.6% of final dataset) within a 30-day period were excluded in the analysis of 30-day mortality, as were deaths occurring more than 30 days after the procedure (n = 20 928). Thirty-day mortality was collected via record linkage with the Office for National Statistics (ONS) Civil Registrations of Death dataset (up to date as of 7 July 2020).11 The process of death certification and registration is a legal requirement in the UK, where a doctor who has seen the deceased within the last 14 days of life must complete a Medical Cause of Death Certificate unless a post-mortem examination is planned. International Classification of Diseases, 10th revision (ICD-10) codes were used to extract patient characteristics from HES, whereas OPCS Classification of Interventions and Procedures version 4.8 was used to identify procedures. A full list of the diagnosis codes used in the study is provided in Supplementary material online, Table S1.
Outcomes
The co-primary outcomes were change in proportion (Δ) of monthly procedural activity between 2020 and earlier years (2018–2019) as well as the 30-day mortality rate for procedures performed before and after the COVID-19 pandemic.
Statistical analysis
We examined the characteristics of patients undergoing the most common cardiac procedures over two time periods: 1 January–31 May 2018 and 2019; and 1 January–29 February 2020 (COVID period) and 1 March–31 May 2020 (COVID period). Age was normally distributed and, therefore summarized using mean and standard deviation and compared using the t-test. Categorical variables were summarized as percentages and analysed using the chi squared (χ2) test or Fisher’s exact test, where appropriate, and using the Kruskal–Wallis test for ordinal variables. Multivariable logistic regression models were fit to quantify the risk of 30-day mortality in the COVID period using the pre-COVID period as the reference category and are expressed as odds ratios (ORs) with corresponding 95% confidence intervals (CIs). Models were adjusted for age, sex, ethnicity, ST-elevation myocardial infarction, non-ST-elevation acute coronary syndromes, elective vs. inpatient admission, dyslipidaemia, smoking history, cardiac arrest, chronic heart failure, history of ischaemic heart disease, myocardial infarction, PCI, CABG surgery or cerebrovascular accident, atrial fibrillation, ventricular tachycardia or fibrillation, dementia, chronic renal failure, hypertension, anaemia, chronic lung disease, diabetes mellitus, coagulopathies, liver disease, cancers, metastatic disease, peripheral vascular disease, and cardiogenic shock. Statistical analyses were performed using Stata 16 MP (College Station, TX, USA).
Ethical approval
The UK Secretary of State for Health and Social Care has issued a time limited Notice under Regulation 3(4) of the NHS (Control of Patient Information Regulations) 2002 (COPI) to share confidential patient information. The study complies with the Declaration of Helsinki. This work was part of a work stream endorsed by the Scientific Advisory Group for Emergencies (SAGE), the body responsible for ensuring timely and coordinated scientific advice is made available to UK government decision makers. SAGE supports UK cross-government decisions in the Cabinet Office Briefing Room (COBR) and by NHS England, which oversees commissioning decisions in the NHS, and NHS Improvement, which is responsible for overseeing quality of care in NHS hospitals.
Patient and public involvement
Patient and public were not involved because this study was to analyse routinely collected mortality and procedural data.
Results
A total of 374 899 cardiac procedures were performed between 1 January and 31 May 2018 to 2020 in England. The most commonly performed procedure was cardiac catheterization (n = 152 656), followed by cardiac device implantation (n = 109 435), PCI (n = 90 245), percutaneous ablation (n = 22 903), CABG (n = 18 030), SAVR (n = 10 400), TAVR (n = 5664), MVR (n = 4774), other valve replacement/repair (n = 1400), and ASD/VSD repair (n = 1324).
Procedural activity
Overall, there was little change in procedural activity per 100 000 population in January and February 2020 compared with the corresponding monthly averages in 2018–2019, with an observed increase in some procedures (TAVR: Δ 24.6% and 32.3%, respectively, other valve replacement/repair: Δ 5.6% and 16.7%, ASD/VSD repair: Δ 2.7% and 3.2%) and a decline in others (cardiac catheterization: Δ −6.5% and −7.3%, CABG: Δ −4.0% and −9.1%, cardiac devices: Δ −8.8% and −9.7%) (Table 1, Figure 1).


Trend of procedural activity (January–May) over the study years. ASD/VSD, atrioseptal and ventriculoseptal defect; CABG, coronary artery bypass grafting; MVR, mitral valve replacement; PCI, percutaneous coronary intervention; SAVR, surgical aortic valve replacement; TAVR, transcatheter aortic valve replacement.
Cardiac procedural volumes (January–May) according to time period
| Year | January n (per 100 000) | % changea | February n (per 100 000) | % Changea | March n (per 100 000) | % changea | April n (per 100 000) | % changea | May n (per 100 000) | % changea | Total deficit in March–May 2020 [n (% change)] | |
|---|---|---|---|---|---|---|---|---|---|---|---|---|
| Cardiac catheterization | 2018–2019b | 12 139 (20.66) | 11 290 (19.22) | 11 768 (20.03) | 11 736 (19.98) | 12 571 (21.4) | ||||||
| 2020 | 11 313 (19.03) | −6.5 | 10 335 (17.39) | −7.3 | 7652 (12.87) | −34.3 | 3066 (5.16) | −73.1 | 4500 (7.57) | −62.8 | 19 637 (56.3) | |
| PCI | 2018–2019b | 6531 (11.12) | 5903 (10.05) | 6693 (11.39) | 6501 (11.07) | 6720 (11.44) | ||||||
| 2020 | 6551 (11.02) | −0.9 | 5982 (10.06) | −0.9 | 5299 (8.91) | −20.6 | 3763 (6.33) | −41.2 | 4311 (7.25) | −36.0 | 6257 (31.9) | |
| CABG | 2018–2019b | 1413 (2.41) | 1367 (2.33) | 1376 (2.34) | 1451 (2.47) | 1531 (2.61) | ||||||
| 2020 | 1342 (2.26) | −9.1 | 1284 (2.16) | −4.0 | 802 (1.35) | −43.6 | 245 (0.41) | −82.4 | 323 (0.54) | −78.0 | 2860 (67.6) | |
| ASD/VSD repair | 2018–2019b | 105 (0.18) | 94 (0.16) | 98 (0.17) | 107 (0.18) | 113 (0.19) | ||||||
| 2020 | 114 (0.19) | 2.7 | 96 (0.16) | 3.2 | 58 (0.1) | −44.4 | 20 (0.03) | −83.8 | 16 (0.03) | −81.8 | 217 (69.8) | |
| TAVR | 2018–2019b | 350 (0.6) | 306 (0.52) | 317 (0.54) | 369 (0.63) | 341 (0.58) | ||||||
| 2020 | 483 (0.81) | 24.6 | 466 (0.78) | 32.2 | 447 (0.75) | 20.0 | 251 (0.42) | −35.4 | 308 (0.52) | −18.1 | 119 (10.6) | |
| SAVR | 2018–2019b | 858 (1.46) | 771 (1.31) | 757 (1.29) | 805 (1.37) | 882 (1.5) | ||||||
| 2020 | 754 (1.27) | −11.8 | 698 (1.17) | −12.0 | 464 (0.78) | −43.3 | 187 (0.31) | −76.0 | 224 (0.38) | −73.0 | 1527 (63.6) | |
| MVR | 2018–2019b | 396 (0.67) | 341 (0.58) | 326 (0.55) | 416 (0.71) | 446 (0.76) | ||||||
| 2020 | 377 (0.63) | −1.6 | 337 (0.57) | 0.9 | 217 (0.37) | −38.3 | 58 (0.1) | −85.1 | 63 (0.11) | −83.8 | 810 (70.6) | |
| Other valves | 2018–2019b | 112 (0.19) | 98 (0.17) | 90 (0.15) | 128 (0.22) | 145 (0.25) | ||||||
| 2020 | 127 (0.21) | 16.7 | 115 (0.19) | 5.6 | 51 (0.09) | −45.5 | 15 (0.03) | −85.4 | 12 (0.02) | −89.7 | 252 (76.4) | |
| Percutaneous ablation | 2018–2019b | 1777 (3.02) | 1657 (2.82) | 1741 (2.96) | 1671 (2.84) | 1845 (3.14) | ||||||
| 2020 | 1894 (3.19) | 0.5 | 1695 (2.85) | 3.8 | 1199 (2.02) | −32.0 | 190 (0.32) | −88.8 | 476 (0.80) | −73.9 | 3369 (64.4) | |
| Cardiac devices | 2018–2019b | 8700 (14.81) | 8026 (13.66) | 8180 (13.92) | 8300 (14.13) | 8695 (14.8) | ||||||
| 2020 | 7708 (12.97) | −9.7 | 7081 (11.91) | −8.8 | 6469 (10.88) | −21.4 | 3752 (6.31) | −52.8 | 3585 (6.03) | −56.8 | 10 453 (43.1) |
% change between 2018 and 2019 average and 2020, based on procedure frequency per 100 000 population.
Average number of procedures over 2018 and 2019.
There was a decline in numbers of all procedures performed between March and May 2020 compared with the 2018–2019 average for these months (total deficit: 45 501 procedures) (Table 1). Cardiac catheterization and device implantations were the most affected in terms of numbers (n = 19 637 and n = 10 453), whereas surgical procedures such as MVR, other valve replacement/repair, ASD/VSD repair, and CABG were the most affected as a relative percentage to previous years’ averages. TAVR was the least affected (Δ −10.6%, 116 procedures). The decline in procedural activity was most pronounced in April and May 2020 (up to Δ −89.7%), with the least affected procedures being cardiac device implantation (Δ−52.8% to −56.8%), PCI (Δ−36.0% to −41.2%), and TAVR (Δ−18.1% to −35.4%) (Table 1).
Patient characteristics
In comparison with the pre-COVID period, patients undergoing certain procedures (PCI, cardiac catheterization, CABG, TAVR, and SAVR) were younger, whereas those undergoing percutaneous ablation and cardiac device implantation were older (Tables 2 and 3). Those undergoing PCI, cardiac catheterization, MVR, and CABG during the COVID period were more likely to be males compared to pre-COVID. Furthermore, there were fewer patients from Asian ethnic background during the COVID period amongst all procedural groups except other valve replacement/repair.
Patient characteristics of cardiology procedures according to time period
| Cardiac catheterization (n = 152 656) | PCI (n = 90 245) | TAVR (n = 5664) | Percutaneous ablation (n = 22 903) | Cardiac devices (n = 109 435) | |||||||||||
|---|---|---|---|---|---|---|---|---|---|---|---|---|---|---|---|
| Pre-COVIDa (n = 137 438) | COVIDb (n = 15 218) | P-value | Pre-COVIDa (n = 76 872) | COVIDb (n = 13 373) | P-value | Pre-COVIDa (n = 4658) | COVIDb (n = 1006) | P-value | Pre-COVIDa (n = 21 038) | COVIDb (n = 1865) | P-value | Pre-COVIDa (n = 95 629) | COVIDb (n = 13 806) | P-value | |
| Age, mean (SD) | 66.2 (12.6) | 65.7 (12.5) | <0.001 | 65.3 (12.5) | 64.6 (12.5) | <0.001 | 80.6 (9.7) | 75.9 (15.7) | <0.001 | 59.5 (15.5) | 60.5 (15.5) | 0.017 | 71.3 (15.0) | 72.5 (14.5) | <0.001 |
| Males | 64.5 | 65.9 | <0.001 | 74.6 | 75.9 | 0.002 | 54.5 | 57.7 | 0.065 | 61.2 | 62.5 | 0.305 | 66.5 | 67.2 | 0.130 |
| Ethnicity | <0.001 | <0.001 | <0.001 | 0.916 | <0.001 | ||||||||||
| White | 76.5 | 76.8 | 73.3 | 72.1 | 76.6 | 69.3 | 72.6 | 73.1 | 80.7 | 82.0 | |||||
| Asian | 6.6 | 5.3 | 7.7 | 6.8 | 2.2 | 1.7 | 2.2 | 2.0 | 3.8 | 2.8 | |||||
| Black | 1.6 | 1.3 | 1.0 | 0.9 | 0.6 | 0.3 | 1.0 | 1.0 | 1.3 | 1.1 | |||||
| Other | 15.3 | 16.6 | 17.9 | 20.2 | 20.6 | 28.7 | 24.2 | 23.8 | 14.2 | 14.2 | |||||
| STEMI | 3.0 | 4.8 | <0.001 | 31.1 | 37.8 | <0.001 | 0.1 | 0.0 | 0.255 | 0.1 | 0.1 | 0.695 | 1.6 | 1.5 | 0.321 |
| NSTEACS | 15.7 | 19.3 | <0.001 | 32.2 | 34.3 | <0.001 | 1.2 | 1.3 | 0.813 | 0.2 | 0.3 | 0.539 | 5.3 | 3.8 | <0.001 |
| Dyslipidaemia | 33.6 | 30.8 | <0.001 | 38.7 | 35.3 | <0.001 | 25.6 | 23.1 | 0.096 | 12.2 | 11.2 | 0.199 | 20.9 | 16.4 | <0.001 |
| Cardiac arrest | 0.2 | 0.3 | 0.016 | 0.7 | 0.6 | 0.150 | 0.7 | 0.5 | 0.542 | 0.0 | 0.0 | 0.346 | 0.5 | 0.5 | 0.568 |
| Heart failure | 15.4 | 15.4 | 0.818 | 15.3 | 15.8 | 0.053 | 27.7 | 24.4 | 0.024 | 13.3 | 18.0 | <0.001 | 25.2 | 25.9 | 0.08 |
| VF/VT | 1.6 | 2.1 | <0.001 | 2.7 | 3.6 | <0.001 | 1.7 | 1.9 | 0.635 | 5.7 | 6.4 | 0.186 | 4.4 | 5.3 | <0.001 |
| AF | 3.4 | 3.9 | 0.002 | 2.1 | 2.2 | 0.203 | 6.6 | 5.5 | 0.194 | 25.5 | 23.5 | 0.055 | 6.8 | 7.5 | 0.006 |
| History of IHD | 14.3 | 15.2 | 0.004 | 17.1 | 17.6 | 0.178 | 15.9 | 11.8 | 0.001 | 6.4 | 8.5 | 0.001 | 13.9 | 15.2 | <0.001 |
| Previous CABG | 5.4 | 4.8 | 0.003 | 6.1 | 4.8 | <0.001 | 12.0 | 7.9 | <0.001 | 3.3 | 3.8 | 0.237 | 5.6 | 5.7 | 0.561 |
| Dementia | 0.4 | 0.3 | 0.259 | 0.5 | 0.4 | 0.214 | 1.5 | 0.6 | 0.021 | 0.2 | 0.1 | 0.214 | 1.7 | 1.8 | 0.394 |
| Chronic renal failure | 8.1 | 7.1 | <0.001 | 7.5 | 6.6 | <0.001 | 23.9 | 18.1 | <0.001 | 3.6 | 4.9 | 0.003 | 11.0 | 11.4 | 0.155 |
| Hypertension | 54.8 | 53.9 | 0.048 | 55.2 | 52.9 | <0.001 | 61.2 | 58.2 | 0.076 | 31.7 | 32.3 | 0.604 | 47.0 | 46.2 | 0.079 |
| Anaemias | 2.1 | 1.8 | 0.05 | 2.0 | 1.6 | 0.009 | 10.3 | 8.3 | 0.063 | 1.0 | 0.9 | 0.79 | 4.9 | 4.0 | 0 |
| Chronic lung disease | 17.9 | 18.0 | 0.700 | 15.2 | 15.0 | 0.481 | 23.3 | 20.5 | 0.053 | 13.0 | 13.0 | 0.929 | 14.0 | 14.4 | 0.194 |
| Diabetes | 23.9 | 22.7 | 0.002 | 25.1 | 24.1 | 0.008 | 26.0 | 20.9 | 0.001 | 10.0 | 10.7 | 0.378 | 20.0 | 19.8 | 0.49 |
| Coagulopathies | 0.6 | 0.5 | 0.191 | 0.5 | 0.5 | 0.878 | 2.4 | 2.6 | 0.675 | 0.5 | 0.3 | 0.199 | 1.6 | 1.1 | <0.001 |
| Liver disease | 1.5 | 1.8 | 0.012 | 1.1 | 1.1 | 0.433 | 2.5 | 3.8 | 0.029 | 0.7 | 1.3 | 0.006 | 1.3 | 1.3 | 0.916 |
| Metastatic disease | 0.3 | 0.4 | 0.021 | 0.3 | 0.3 | 0.124 | 0.5 | 0.6 | 0.611 | 0.1 | 0.1 | 0.979 | 0.3 | 0.4 | 0.284 |
| PVD | 4.4 | 4.0 | 0.064 | 4.3 | 4.3 | 0.705 | 12.8 | 10.8 | 0.094 | 1.9 | 1.2 | 0.052 | 4.5 | 4.1 | 0.028 |
| Cardiogenic shock | 0.3 | 0.3 | 0.661 | 1.4 | 1.3 | 0.264 | 0.4 | 0.2 | 0.408 | 0.1 | 0.1 | 0.871 | 0.4 | 0.5 | 0.473 |
| Cancers | 1.7 | 1.7 | 0.651 | 1.8 | 1.5 | 0.056 | 3.5 | 4.3 | 0.234 | 0.7 | 0.9 | 0.495 | 2.1 | 2.2 | 0.236 |
January–May for years 2018 and 2019, and January–February 2020.
March–May 2020.
Patient characteristics of cardiothoracic procedures
| SAVR (n = 10 400) | MVR (n = 4774) | Other valves (n = 1400) | ASD VSD repair (n = 1324) | CABG (n = 18 030) | |||||||||||
|---|---|---|---|---|---|---|---|---|---|---|---|---|---|---|---|
| Pre-COVIDa (n = 9525) | COVIDb (n = 875) | P-value | Pre-COVIDa (n = 4436) | COVIDb (n = 338) | P-value | Pre-COVIDa (n = 1322) | COVIDb (n = 78) | P-value | Pre-COVIDa (n = 1230) | COVIDb (n = 94) | P-value | Pre-COVIDa (n = 16 660) | COVIDb (n = 1370) | P-value | |
| Age, mean (SD) | 67.3 (13.7) | 64.3 (16.2) | <0.001 | 64.9 (14.7) | 63.9 (15.0) | 0.250 | 61.2 (19.6) | 57.5 (19.8) | 0.112 | 48.9 (21.8) | 52.8 (17.7) | 0.141 | 66.8 (11.0) | 66.0 (9.9) | 0.006 |
| Males | 67.6 | 68.7 | 0.521 | 61.1 | 67.2 | 0.031 | 54.7 | 60.8 | 0.300 | 47.2 | 53.8 | 0.221 | 81.9 | 85.0 | 0.005 |
| Ethnicity | 0.016 | 0.155 | 0.037 | 0.814 | <0.001 | ||||||||||
| White | 73.8 | 73.0 | 70.5 | 69.2 | 70.7 | 60.3 | 64.0 | 63.8 | 69.0 | 70.1 | |||||
| Asian | 2.9 | 1.3 | 4.6 | 2.4 | 4.7 | 5.1 | 5.4 | 3.2 | 7.2 | 4.1 | |||||
| Black | 1.0 | 0.8 | 1.8 | 2.1 | 1.4 | 5.1 | 2.0 | 2.1 | 0.7 | 1.1 | |||||
| Other | 22.3 | 24.9 | 23.0 | 26.3 | 23.2 | 29.5 | 28.7 | 30.9 | 23.1 | 24.7 | |||||
| STEMI | 0.4 | 1.0 | 0.005 | 1.0 | 0.9 | 0.793 | 0.2 | 1.3 | 0.09 | 3.4 | 8.5 | 0.012 | 4.7 | 5.5 | 0.199 |
| NSTEACS | 3.9 | 4.2 | 0.649 | 2.6 | 3.0 | 0.684 | 0.6 | 1.3 | 0.467 | 1.3 | 3.2 | 0.137 | 28.4 | 32.4 | 0.002 |
| Dyslipidaemia | 35.6 | 31.2 | 0.008 | 23.4 | 19.2 | 0.077 | 18.6 | 21.8 | 0.484 | 12.0 | 8.5 | 0.307 | 55.6 | 54.2 | 0.311 |
| Cardiac arrest | 0.6 | 0.7 | 0.842 | 0.5 | 0.0 | 0.185 | 0.9 | 0.0 | 0.398 | 0.2 | 1.1 | 0.077 | 0.4 | 0.4 | 0.670 |
| Heart failure | 22.0 | 24.2 | 0.103 | 32.2 | 36.4 | 0.070 | 35.1 | 37.2 | 0.678 | 15.3 | 27.7 | 0.003 | 19.7 | 22.4 | 0.016 |
| VF/VT | 3.0 | 3.4 | 0.506 | 3.5 | 8.0 | <0.001 | 4.1 | 10.3 | 0.01 | 3.1 | 5.3 | 0.240 | 2.7 | 2.7 | 0.999 |
| AF | 6.2 | 5.9 | 0.805 | 8.9 | 8.9 | 0.992 | 7.3 | 7.7 | 0.887 | 5.3 | 7.4 | 0.373 | 4.0 | 3.6 | 0.486 |
| History of IHD | 8.9 | 9.3 | 0.741 | 6.9 | 6.5 | 0.762 | 3.9 | 3.8 | 0.969 | 3.1 | 6.4 | 0.086 | 23.8 | 28.6 | <0.001 |
| Previous CABG | 1.1 | 1.4 | 0.451 | 1.9 | 2.7 | 0.324 | 1.4 | 1.3 | 0.953 | 0.4 | 1.1 | 0.360 | 1.6 | 1.4 | 0.478 |
| Dementia | 0.2 | 0.0 | 0.155 | 0.2 | 0.0 | 0.465 | 0.2 | 0.0 | 0.731 | 0.1 | 0.0 | 0.782 | 0.2 | 0.1 | 0.339 |
| Chronic renal failure | 10.1 | 9.0 | 0.303 | 11.0 | 12.7 | 0.346 | 12.4 | 10.3 | 0.574 | 4.7 | 6.4 | 0.468 | 9.8 | 9.5 | 0.745 |
| Hypertension | 60.5 | 61.0 | 0.78 | 47.1 | 44.4 | 0.327 | 39.0 | 41.0 | 0.726 | 26.3 | 26.6 | 0.943 | 70.3 | 74.9 | <0.001 |
| Anaemias | 11.9 | 13.1 | 0.261 | 11.8 | 12.1 | 0.862 | 12.0 | 12.8 | 0.834 | 5.5 | 7.4 | 0.438 | 11.3 | 12.8 | 0.104 |
| Chronic lung disease | 16.5 | 19.2 | 0.043 | 16.9 | 15.7 | 0.554 | 14.5 | 14.1 | 0.918 | 11.4 | 9.6 | 0.593 | 15.4 | 16.9 | 0.138 |
| Diabetes | 19.3 | 18.1 | 0.365 | 10.5 | 9.2 | 0.446 | 9.4 | 10.3 | 0.797 | 6.9 | 11.7 | 0.084 | 31.5 | 30.9 | 0.659 |
| Coagulopathies | 5.6 | 4.8 | 0.33 | 6.4 | 4.4 | 0.151 | 8.2 | 5.1 | 0.336 | 3.4 | 5.3 | 0.336 | 2.9 | 2.4 | 0.318 |
| Liver disease | 2.6 | 2.2 | 0.482 | 2.9 | 4.4 | 0.107 | 4.4 | 7.7 | 0.174 | 2.4 | 2.1 | 0.887 | 1.9 | 1.7 | 0.519 |
| Metastatic disease | 0.2 | 0.1 | 0.621 | 0.2 | 0.6 | 0.195 | 1.7 | 3.8 | 0.157 | 0.3 | 0.0 | 0.580 | 0.1 | 0.1 | 0.892 |
| PVD | 10.6 | 11.2 | 0.557 | 5.2 | 4.4 | 0.560 | 4.5 | 2.6 | 0.410 | 2.7 | 2.1 | 0.746 | 9.9 | 10.0 | 0.898 |
| Cardiogenic shock | 0.7 | 1.1 | 0.093 | 1.1 | 3.6 | <0.001 | 1.1 | 2.6 | 0.224 | 1.7 | 3.2 | 0.299 | 0.6 | 1.1 | 0.049 |
| Cancers | 1.8 | 1.8 | 0.985 | 1.4 | 1.5 | 0.957 | 2.2 | 5.1 | 0.097 | 0.4 | 0.0 | 0.536 | 1.5 | 1.1 | 0.219 |
January–May for years 2018 and 2019, and January–February 2020.
March–May 2020.
30-Day mortality
While there was no difference in unadjusted rates of 30-day mortality for the majority of procedures performed in the pre-COVID and COVID time periods (Table 4), 30-day mortality was higher during the COVID period for patients undergoing cardiac catheterization (1.6% vs. 1.1%, P < 0.001), ASD/VSD repair (9.1% vs. 1.4%, P = 0.002), percutaneous ablation (0.5% vs. 0.2%, P = 0.037), and cardiac device implantation (2.0% vs. 1.4%, P < 0.001) (Supplementary material online, Figure S1).
Crude rates of 30-day mortality according to procedure type
| 2018–February 2020 (%)a | March–May 2020 (%) | Total (%) | P-value | |
|---|---|---|---|---|
| Cardiac catheterization | 1.1 | 1.6 | 1.2 | <0.001 |
| PCI | 2.7 | 2.8 | 2.7 | 0.481 |
| CABG | 1.1 | 1.8 | 1.1 | 0.328 |
| ASD/VSD repair | 1.4 | 9.1 | 1.9 | 0.002 |
| TAVR | 2.4 | 2.1 | 2.3 | 0.687 |
| SAVR | 4.4 | 6.9 | 4.9 | 0.326 |
| MVR | 6.2 | 3.3 | 5.8 | 0.532 |
| Other valves | 2.3 | 0b | 2.0 | 0.799 |
| Percutaneous ablation | 0.2 | 0.5 | 0.2 | 0.037 |
| Cardiac devices | 1.4 | 2.0 | 1.5 | <0.001 |
Included months are January through May for 2018 and 2019.
No deaths occurred.
After adjustment for baseline differences, there was no difference in 30-day mortality between pre-COVID and COVID time periods, except in those undergoing cardiac catheterization and cardiac device implantation, who had increased odds of 30-day mortality (OR 1.25 95% CI 1.07–1.47, P = 0.006 and OR 1.35 95% CI 1.15–1.58, P < 0.001, respectively) (Table 5, Figure 2).
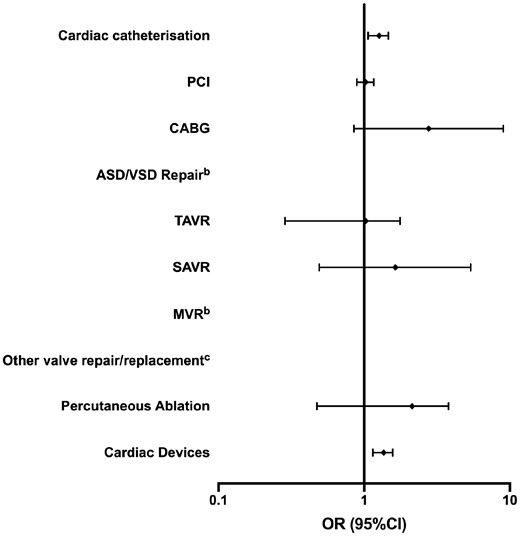
Adjusted odds of 30-day mortality according to procedure type.a ASD/VSD, atrioseptal and ventriculoseptal defect; CABG, coronary artery bypass grafting; MVR, mitral valve replacement; PCI, percutaneous coronary intervention; SAVR, surgical aortic valve replacement; TAVR, transcatheter aortic valve replacement. aReference category is January–May for years 2018 and 2019, and January–February 2020. bPerfect predictor variable. cNo deaths occurred.
Adjusted odds ratios (ORs) of 30-day mortality during March–May 2020 according to procedure typea
| OR (95% confidence interval) | P-value | |
|---|---|---|
| Cardiac catheterization | 1.25 (1.07–1.47) | 0.006 |
| PCI | 1.02 (0.89–1.16) | 0.829 |
| CABG | 2.77 (0.85–9.03) | 0.090 |
| ASD/VSD repair | b | b |
| TAVR | 0.85 (0.39–1.84) | 0.682 |
| SAVR | 1.64 (0.49–5.40) | 0.420 |
| MVR | b | b |
| Other valve repair/replacement | c | c |
| Percutaneous ablation | 1.71 (0.73–3.98) | 0.215 |
| Cardiac devices | 1.35 (1.15–1.58) | <0.001 |
Reference category is January–May for years 2018 and 2019, and January–February 2020.
Perfect predictor variable.
No deaths occurred.
Discussion
We present the first study to examine the impact of COVID-19 on procedural activity and subsequent mortality for all common cardiac procedures from a national perspective. This study presents several important findings. First, we observe a substantial decline in all cardiac procedures performed between March and May 2020 compared to the same time period in earlier years (2018–2019), with certain procedures being more affected than others. We report a total deficit of more than 45 000 cardiac procedures over the COVID period (March-May 2020) compared with previous years. Second, we report minor age and ethnic differences in patient characteristics for the majority of cardiac procedures performed before and after the COVID-19 pandemic. Finally, we show that there was no difference in 30-day mortality between the pre-COVID and COVID periods for the majority of procedures, except in cardiac catheterization and device implantation procedural groups that were associated with increased mortality.
The COVID-19 pandemic has led to substantial operational changes in healthcare delivery, especially among procedural specialties. Many professional societies recommended cancellation of elective procedures particularly in high-risk patients due to their increased risk of contracting COVID-19 and their increased risk of mortality, mainly due to factors such as prolonged hospital admission, the invasive nature of certain procedures, aerosol-generating nature of procedures, and the potential need for ICU resources that have been otherwise prioritized for COVID-19 cases.1,2,4,12–18 As such, procedural activity has reportedly declined in many institutions.3,4,19 Although some studies or surveys have examined procedural activity in the COVID era, these mainly included specific centres (e.g. large tertiary facilities) or healthcare systems [e.g. Veterans Affairs (VA) only], early phases of the pandemic (e.g. up to April 2020), or specific procedures (e.g. PCI) without comparison between different procedure types.4,7,8,19,20 It is therefore, unclear which procedures were most affected nationally, the implications of such changes in activity and whether the outcomes of those who underwent cardiac procedures during the COVID-19 pandemic were worse compared with the pre-COVID era.
Waldo et al.6 reported a reduction in both elective and urgent PCI procedures in the VA healthcare system between 1 March and 27 June 2020 compared with the same time period in 2019 (3859–2192). While these findings are insightful, they were based on a relatively small number of PCI procedures from a single healthcare system that do not reflect national practice, and do not inform us of differences in outcomes between the two time periods. Another study by Lazaros et al.8 demonstrated a decline in cardiac surgery procedure activity in two large volume hospitals in Greece between 12 March and 7 May 2020 compared with the same time period in 2019 (246 vs. 84 procedures), especially for elective cases, with a relative rise in emergent procedures. However, their analysis was based on a small number of very specific procedure types, and did not look at postoperative outcomes for these time periods. Our findings demonstrate a substantial decline all cardiac procedural activity across England during the COVID period, even before the start of national lockdown (23 March 2020). The greatest decline in procedure rates was observed amongst surgical procedures including MVR, other valve replacement/repair, ASD/VSD repair, and CABG, whereas cardiac catheterization and device implantations were the most affected in terms of absolute numbers.
Although there were certain age and ethnic differences between patients undergoing certain procedures in the pre-COVID and COVID time periods, the majority of characteristics were largely similar, suggesting that all individuals were affected. We found no difference in 30-day mortality between COVID and pre-COVID time periods for all cardiac procedures, except cardiac catheterization and device implantations that were associated with increased odds of 30-day mortality, even after adjustment for baseline differences. The increased mortality amongst cardiac catheterization and device implantation procedures could be due to residual confoundment, given that procedural characteristics were not captured in HES and, therefore, not adjusted for. This may be relevant for where higher-risk patients prior to COVID underwent non-invasive assessment for coronary artery disease with procedures such as cardiac computed tomography (CT), and during the COVID period, such patients were managed with an invasive approach to avoid close proximity to patients potentially infected with COVID-19 undergoing CT examinations. Similarly, only the most urgent device implantations are likely to have been performed during the COVID period, reflecting a higher risk cohort. Further work is required to define the cause of the increases in mortality in these patient groups, particularly whether the deaths were related to procedural complications or COVID-19 in the community.
Our findings raise important questions regarding the outcomes of patients whose interventions were deferred, especially those who are more frail or with a greater burden of comorbidities. Although difficult to quantify, the indirect burden of COVID-19 on morbidity and mortality of patients with cardiovascular disease whose interventions were deferred may exceed the direct effect of the infection in terms of mortality. For example, the 1-year mortality of untreated symptomatic severe aortic stenosis is as high as 44%.21,22 Similarly, severe untreated mitral stenosis is associated with high morbidity and mortality.23 Therefore, timely interventions for such patients are crucial, and without a major restructure of health services to deal with the current backlog/deficit in procedural activity, which is quite significant in our national cohort, we are likely to observe an impact on their long-term morbidity and mortality. There has been limited guidance on the safe reintroduction of cardiovascular services during the pandemic, and this was primarily based on expert opinion.16,24 Guidance from the North American Society Leadership recommend measures such as pre-procedural physical distancing wherever possible, COVID-19 screening, and availability of personal protective equipment as well as close collaboration with regional public health officials.24 Prachand et al.16 proposed the medically-necessary time-sensitive (MeNTS) scoring system, based on 21 factors (patient, procedural, and disease-related), as a means of prioritizing time-sensitive procedures while taking into account resource limitations during the COVID-19 pandemic. Despite its inherent limitations as the authors have acknowledged, including the allocation of equal weighting to all 21 factors and lack of consideration of the patient’s COVID status, the MeNTS score highlights the need for more refined scoring systems to objectively assess patient risk and the availability of resources and safely resume elective as well as semi-urgent procedural activity. Furthermore, several contingency measures could be employed to deal with the backlog in waiting lists such as seven-day working patterns in major centres, the collaboration with private healthcare institutions for bed availability, as well as recently retired operators who may be willing to temporarily return to practice. This is even more crucial in the event of further resurgence of COVID-19 outbreaks that would further increase the pressure on healthcare systems and continually growing waiting lists.
Limitations
There are several limitations to the present study. First, the observational nature of our analysis means that the observed associations do not necessarily infer causality. Second, while HES captures a significant amount of patient characteristics, factors such as the overall comorbid burden and frailty status cannot be objectively fully assessed using administrative data. Furthermore, certain procedural characteristics as well as pharmacological data were not available in HES, and therefore were not adjusted for. Finally, while we have demonstrated similar 30-day mortality in the pre-COVID and COVID eras for most procedures, these outcomes may differ significantly on longer follow-up.
Conclusions
The COVID-19 pandemic resulted in a significant decline of all major cardiac procedural activity across England, with the most affected procedures being CABG, mitral, and other valvular repairs/replacements, ASD/VSD repair, as well as cardiac catheterization and device implantations. Adjusted 30-day mortality was similar in the pre-COVID and COVID time periods for all cardiac procedures except cardiac catheterization and device implantations. Major operational changes are warranted to deal with the deficit in procedural activity and anticipated growth in waiting lists that could impact longer-term morbidity and mortality.
Supplementary material
Supplementary material is available at European Heart Journal – Quality of Care and Clinical Outcomes online.
Acknowledgements
The authors acknowledge Tony Burton, Courtney Stephenson, Sion Philpott-Morgan, and Kampreet Sandhu from NHS Digital, and Professor John Deanfield from University College London for providing and creating the secure environment for data hosting and for analytical support.
Conflict of interest: none declared.
Data availability statement
The data underlying this article cannot be shared publicly for the privacy of individuals included in the study as per restrictions in our data access agreement with NHS Digital.
References
Hospital Episode Statistics (HES). https://digital.nhs.uk/data-and-information/data-tools-and-services/data-services/hospital-episode-statistics (13 September 2020).
Office for National Statistics (ONS) OfNS. Coronavirus (COVID-19) roundup.
The European Society of Cardiology. Cardiology (
