


Abstract
After transcatheter aortic valve replacement (TAVR), cardiovascular and non-cardiovascular comorbidities may offset the survival benefit from the procedure. We aimed to describe the relationships between that benefit and patient comorbidities.
The study pooled two European cohorts of patients with severe aortic stenosis (AS-pooled): one with patients who underwent (cohort of AS patients treated by TAVR, N = 233) and another with patients who did not undergo TAVR (cohort of AS patients treated medically; N = 291). The investigators collected the following: calcification prognostic impact (CAPRI) and Charlson scores for cardiovascular and non-cardiovascular comorbidities, activities of daily living (ADL)/instrumental activities of daily living (IADL) scores for frailty as well as routine Society of Thoracic Surgeons (STS) score and Logistic Euroscore. Unlike ADL/IADL scores, CAPRI and Charlson scores were found to be independent predictors of 1-year all-cause death in the AS-pooled cohort, with and without adjustment for STS score or Logistic Euroscore; they were thus retained to define a three-level prognostic scale (good, intermediate, and poor). The survival benefit from TAVR—vs. no TAVR—was stratified according to these three prognosis categories. The beneficial effect of TAVR on 1-year all-cause death was significant in patients with good and intermediate prognosis, hazard ratio (95% confidence interval): 0.36 (0.18; 0.72) and 0.32 (0.15; 0.67). That effect was reduced and not statistically significant in patient with poor prognosis [0.65 (0.22; 1.88)].
The study showed that, beyond a given comorbidity burden (as assessed by CAPRI and Charlson scores), the probability of death within a year was high and poorly reduced by TAVR. This indicates the futility of TAVR in patients in the poor prognosis category.
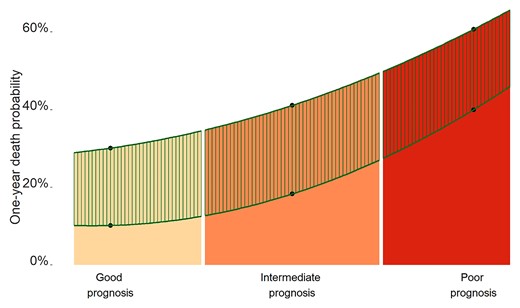
Relationship between prognosis category and the transcatheter aortic valve replacement (TAVR) effect. Prognosis categories were defined using the tertiles of calcification prognostic impact and Charlson scores. The estimates of 1-year all-cause death probabilities in each cohort (cohort of AS patients treated medically and cohort of AS patients treated by TAVR) were obtained using a multivariable Cox regression model. The mortality curves were obtained using an interpolated polynomial of degree 2 based on those estimates. The hatched area indicates the difference in the probability of 1-year death between the two cohorts and illustrates mainly the TAVR effect. While both TAVR and the prognosis category contributed to 1-year all-cause death, the contribution of TAVR was not uniform across the range of prognoses; the poorer was the prognosis category, the lower was the benefit from TAVR.
Introduction
Transcatheter aortic valve replacement (TAVR) is undoubtedly able to change the course of aortic stenosis (AS) disease.1 However, in highly comorbid patients often seen in this setting, solving the valvular problem may not achieve a meaningful improvement in terms of survival. In such patients, TAVR might be deemed ‘futile’.
Futility is a complex issue that encompasses ethical, economical, and technical facets. In the context of TAVR, futility was defined as death within the first year post-TAVR2 and would concern up to 20% of patients.3 To date, it cannot be easily assessed with surgical risk scores4,5 but would rather rely on the more common notion of ‘comorbidity burden’. Thus, one way of evaluating futility would be to define a comorbidity burden threshold above which the benefit from TAVR would be largely offset by the risk of short-term death. This threshold is currently unknown and has been rarely investigated,6 but is worth being searched for.
In elderly AS patients, survival is influenced by the valvular disease and its cure (i.e. dependent on TAVR), the residual cardiovascular status (left ventricle ejection fraction—LVEF, pulmonary hypertension, etc.), non-cardiac comorbidities, and frailty. In the TAVR setting, a prognosis based on cardiac and non-cardiac comorbidities may be approached by dedicated scores such as the calcification prognostic impact (CAPRI),7 Charlson score,8 and activities of daily living (ADL)/instrumental activities of daily living (IADL) scores.9
The present study aimed to describe the relationships between TAVR benefit, score-assessed comorbidity, and 1-year all-cause death in patients with severe AS.
Methods
The study cohorts
The study cohort (AS-pooled) combined two cohorts [cohort of AS patients treated medically (AS-MED) and cohort of AS patients treated by TAVR (AS-TAVR)] of symptomatic patients with severe AS. The latter condition was defined by the usual criteria: aortic surface area <1 cm2 or aortic surface area indexed to body surface area <0.6 cm2/m2 or mean aortic gradient >40 mm Hg with normal LVEF. Low-gradient AS patients were not excluded because CAPRI score applies to these patients too.7
The AS-MED cohort is a multicentre cohort of 291 consecutive severe AS patients who did not undergo TAVR. They were seen at three French university hospitals (Nantes, Clermont-Ferrand, and Lyon Croix-Rousse) between January 2013 and August 2018. The decision not to perform TAVR was made by the local heart team on the basis of their analyses of pre-operative work-up and on the patient's will. This study excluded the patients who underwent TAVR within a first year after the initial decision, those scheduled for a TAVR but who deceased before the procedure, and those without or with no assessable computed tomography (CT)-scan (Figure 1).

Study flow chart.
The AS-TAVR cohort is a single centre cohort of 233 consecutive severe AS patients who underwent TAVR at Lausanne University Hospital between June 2013 and September 2018. Their characteristics were close to those of French patients with TAVR.10,11
The study data
Patient demographic and baseline characteristics were obtained from the medical charts of pre-operative work-up.
The CAPRI score is a TAVR-dedicated score designed to predict mortality 1 year after TAVR or heart failure.7,12 It includes cardiovascular variables and comorbidities related to the pulmonary status and renal impairment. Its peculiarity is to include thoracic aortic calcification burden as an objective and highly prognostic marker of post-TAVR death.13–16 For its calculation, pre-operative CTs were collected, anonymized, and transferred to a single core lab as previously described.7,16 Calcification prognostic impact score was not built with the Swiss data but only with the French Lyon and Clermont-Ferrand data.7
The Charlson score, the IADL, and the ADL scores were calculated by a geriatrician as part of usual patient management. The Society of Thoracic Surgeons (STS) score and the Logistic Euroscore were calculated as part of the routine patient work-up. Note here that, in the AS-TAVR cohort, IADL and ADL scores were regularly collected only after 2015 and that the Mini-Mental state (MMS) score was available for the AS-MED cohort only.
Mortality data were obtained from medical records or by direct phone with the patients' families or referring physicians. The primary outcome was 1-year all-cause death. The follow-up started on the day of the decision not to indicate TAVR in patients treated medically and on the day of the procedure in patients treated by TAVR.
Data analysis
Patient characteristics were described using the median (interquartile range) or the absolute and relative frequencies, as appropriate. Between-cohort comparisons used Student t-test or Wilcoxon test for continuous variables and χ2 test or Fisher exact test for discrete variables (Table 1). Spearman correlations between various scores were calculated to test for multicollinearity and prevent overadjustment in multivariable models (Figure 2).
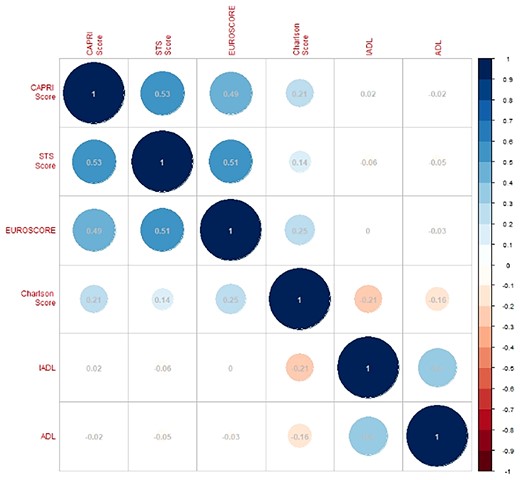
Correlations between calcification prognostic impact score, Society of Thoracic Surgeons score, Logistic Euroscore, Charlson score, instrumental activities of daily living, and activities of daily living scores in the Aortic Stenosis pooled cohort. The size and colour of each circle represent the direction and the strength of the correlation.
Baseline characteristics of the two cohorts
| AS-MED cohort | AS-TAVR cohort | P | |||
|---|---|---|---|---|---|
| Total | Value | Total | Value | ||
| Age | 291 | 85.6 (81.2; 88.8) | 233 | 83.0 (79.0; 87.0) | <0.001 |
| Males | 291 | 124 (42.6) | 233 | 109 (46.8) | 0.387 |
| BMI, kg/m2 | 291 | 25.4 (22.6; 29.2) | 233 | 25.3 (22.5; 29.9) | 0.572 |
| NYHA (III/IV) | 291 | 143 (49.1) | 233 | 176 (75.5) | <0.001 |
| Clinical history | |||||
| Previous CABG | 291 | 13 (4.5) | 233 | 41 (17.6) | <0.001 |
| Previous PTCA | 291 | 61 (21.0) | 233 | 63 (27.0) | 0.128 |
| Peripheral vascular disease | 291 | 73 (25.1) | 233 | 59 (25.3) | 1.000 |
| Stroke or TIA | 291 | 35 (12.0) | 233 | 47 (20.2) | 0.015 |
| COPD | 291 | 35 (12.0) | 233 | 36 (15.5) | 0.313 |
| Diabetes | 291 | 82 (28.2) | 233 | 66 (28.3) | 1.000 |
| Atrial fibrillation | 291 | 120 (41.2) | 233 | 93 (39.9) | 0.828 |
| Permanent pacemaker | 291 | 41 (14.1) | 233 | 29 (12.4) | 0.674 |
| eGFR, mL/min | 291 | 43.0 (33.0; 58.5) | 233 | 43.8 (33.4;58.4) | 0.904 |
| Echocardiographic findings | |||||
| Mean gradient, mm Hg | 291 | 45.0 (35.0; 55.0) | 233 | 38.0 (26.0; 50.0) | <0.001 |
| LVEF, % | 291 | 60.0 (45.0; 65.0) | 232 | 60.0 (48.0; 66.2) | 0.005 |
| Moderate/severe MR | 291 | 28 (9.6) | 232 | 8 (3.4) | 0.009 |
| Pulmonary pressure, mm Hg | 221 | 45.0 (35.0; 55.0) | 168 | 40.0 (32.0; 51.2) | 0.056 |
| Diseased coronary vessels | 266 | 233 | 0.031 | ||
| None | 132 (49.6) | 134 (57.5) | |||
| 1 | 63 (23.7) | 59 (25.3) | |||
| 2 | 41 (15.4) | 29 (12.4) | |||
| 3 | 30 (11.3) | 11 (4.7) | |||
| Risk scores | |||||
| Logistic Euroscore | 291 | 15.0 (9.2; 23.9) | 233 | 8.9 (5.4; 15.7) | <0.001 |
| STS score | 266 | 4.6 (2.9; 7.3) | 231 | 5.0 (3.4; 8.5) | 0.081 |
| CAPRI score | 266 | 0.06(−0.41; 0.55) | 231 | 0.14(−0.31; 0.53) | 0.346 |
| Charlson score | 291 | 4 (3; 6) | 233 | 2 (1; 3) | <0.001 |
| ADL score | 254 | 5.5 (4.5; 6.0) | 101 | 6.0 (5.0; 6.0) | 0.012 |
| IADL score | 241 | 3 (1; 3) | 102 | 3 (2; 4) | 0.021 |
| MMS score | 257 | 25 (20; 28) | — | — | |
| Patients per period | 0.429 | ||||
| 2013–2014 | 65 (22.3) | 52 (22.3) | |||
| 2015–2016 | 127 (43.6) | 90 (38.6) | |||
| 2017–2018 | 99 (34.0) | 91 (39.1) | |||
| Outcome | |||||
| 1-year all-cause death | 291 | 118 (40.5) | 233 | 32 (13.7) | |
Values are median (IQR) or n (%). BMI, body mass index; NYHA, New York Heart Association class of heart failure; CABG, coronary artery bypass graft; PTCA, percutaneaous transluminal coronary angioplasty; TIA, transient ischaemic attack; COPD, chronic obstructive pulmonary disease; eGFR, estimated glomerular filtration rate (Cockroft-Gault formula); LVEF, left ventricular ejection fraction; MR, mitral regurgitation; CAPRI, calcification prognostic impact score; ADL, activities of daily living score; IADL, instrumental activities of daily living scores.
Cox models were built with variables TAVR, CAPRI score, Charlson score, and IADL or ADL, with or without adjustments on STS or the Logistic Euroscore, according to the contents of Table 2. Among CAPRI, Charlson, and frailty scores, those found to be independent predictors of 1-year all-cause death were considered to build a three-level prognosis scale as follows: (i) poor prognosis: all scores above the second tertile of their distributions; (ii) intermediate prognosis: one score above the second tertile and the others equal to or below it; (iii) good prognosis: all scores equal to or below the second tertile. ‘TAVR effect’ was assessed considering the probability of all-cause death in each prognosis category using Kaplan–Meier method and a multivariable Cox model adjusted for the retained prognostic scores.
Hazard ratio (95% confidence interval) for all-cause death in the aortic stenosis pooled cohort (AS-pooled)
| Model | TAVR effect | CAPRI score | Charlson score | IADL score | ADL score |
|---|---|---|---|---|---|
| 1 | 0.33 (0.18; 0.62) | 1.68 (1.24; 2.27) | 1.13 (1.01; 1.26) | 1.00 (0.86; 1.16) | — |
| 2 | 0.31 (0.16; 0.59) | 1.71 (1.27; 2.32) | 1.13 (1.02; 1.25) | — | 1.01 (0.89; 1.16) |
| 3 | 0.29 (0.15; 0.55) | 1.47 (1.06; 2.04) | 1.13 (1.01; 1.26) | 1.01 (0.87; 1.18) | — |
| 4 | 0.27 (0.14; 0.52) | 1.51 (1.09; 2.08) | 1.12 (1.02; 1.24) | — | 1.03 (0.9; 1.17) |
| 5 | 0.36 (0.19; 0.69) | 1.48 (1.06; 2.07) | 1.14 (1.02; 1.26) | 0.99 (0.86; 1.15) | — |
| 6 | 0.34 (0.18; 0.66) | 1.50 (1.07; 2.1) | 1.14 (1.03; 1.25) | — | 1.01 (0.88; 1.15) |
CAPRI, calcification prognostic impact score; ADL, activities of daily living score; IADL, instrumental activities of daily living scores. Model 1, with IADL; Model 2, with ADL; Model 3, with IADL adjusted for STS; Model 4, with ADL adjusted for STS score; Model 5, with IADL adjusted for Logistic Euroscore; Model 6, with ADL adjusted for Logistic Euroscore.
All statistical analyses were carried out with R statistical software, version 3.5 (R: A language and environment for statistical computing. R Foundation for Statistical Computing, Vienna, Austria. URL https://www.R-project.org/).
Ethics
This study was approved by the ethics committee of Nantes University hospital in France (#20190701) and by the ethics committee of Canton de Vaud in Switzerland (#211/13). All patients gave informed consent to participate.
According to the current EU General Data Protection Regulation, subjects’ data were anonymized before analysis and all data that could lead to participants' identification were kept confidential and securely stored.
Results
The AS-MED cohort comprised 291 patients and the AS-TAVR cohort, 233 patients (see the flow chart in Figure 1). The most frequent reasons for not receiving TAVR in the AS-MED cohort were extracardiac comorbidities and/or frailty (66.6%), patient refusal (24.4%), impaired cardiovascular status (19.6%), uncertainty regarding AS severity (18.2%), and unfavourable anatomy (15.8%) (Supplementary material online, Figure 1).
Table 1 shows comparisons between the baseline characteristics of the two cohorts. Versus AS-TAVR patients, AS-MED patients were older, belonged less frequently to NYHA Class III/IV, had less frequently CABG, had higher median mean aortic gradients, and a somewhat higher median pulmonary pressure (Table 1). The median Logistic Euroscore and Charlson score were higher in AS-MED than in AS-TAVR patients. The median ADL and IADL scores were lower in AS-MED than in AS-TAVR patients but the median CAPRI and the median STS scores were similar. Finally, the median (IQR) of the MMS was 25 (20; 28) in the AS-MED cohort (41.6% had scores <24) (nota: no possible comparison with AS-TAVR patients). Regarding mortality, the frequency of 1-year all-cause death was markedly higher in the AS-MED than in the AS-TAVR cohort (40.5% vs. 13.7%) (Table 1).
In the AS-pooled cohort, there were low correlations between various scores except the correlations between CAPRI, Logistic Euroscore, and STS scores (ρ: +0.49 to +0.52) and the correlation between IADL and ADL (ρ = +0.4) (Figure 2).
In the multivariable Cox models that included IADL or ADL, CAPRI and Charlson scores were found to be significant predictors of 1-year all-cause death but neither IADL nor ADL (Table 2). Similar results were obtained after adjustment for the STS score or the Logistic Euroscore (Table 2). Calcification prognostic impact and Charlson scores were retained to build the three-level prognosis scale. Figure 3 shows the distribution of these prognosis categories in the AS-TAVR and in the AS-MED cohorts; patients with poor prognosis formed 4.3% of the AS-TAVR cohort but 21.1% of the AS-MED cohort (Figure 3).
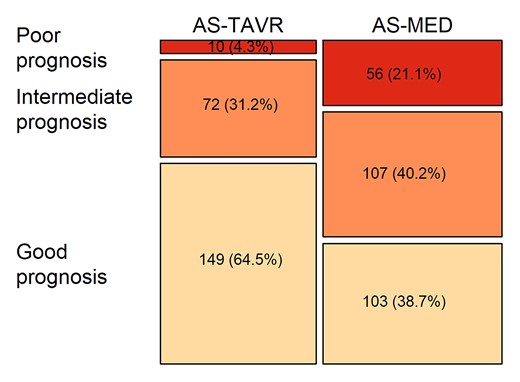
Distribution of the three prognosis categories in the aortic stenosis cohort treated medically and the aortic stenosis cohort treated by transcatheter aortic valve replacement.
Figure 4 shows that the probability of death increased progressively in AS-MED cohort together with the severity of the prognosis categories and that it was significantly decreased by TAVR (p log-rank < 0.01) in good and intermediate prognosis categories (Figure 3, upper and middle panels) and only mildly decreased in the poor prognosis category. The small number of observations in the poor prognosis category precluded statistical comparisons (Figure 3, lower panel).
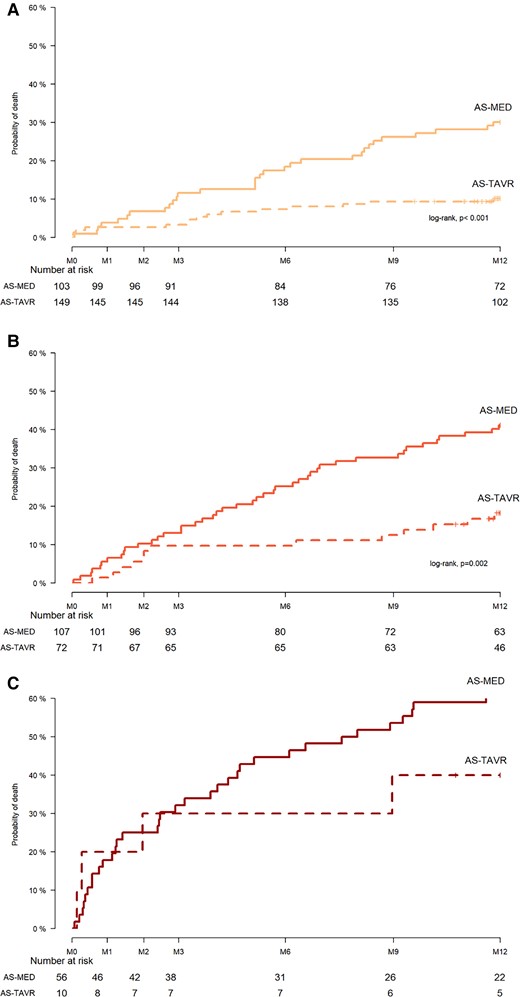
Probability of death in cohort of aortic stenosis patients treated by transcatheter aortic valve replacement vs. cohort of aortic stenosis patients treated medically in the good (upper panel), intermediate (middle panel), and poor (lower panel) prognosis categories.
In a Cox model, the TAVR effect adjusted for CAPRI and Charlson scores corresponded to a 64% and 68% decrease in the rate of all-cause death in the good and intermediate prognosis categories {[HR (95% confidence interval): 0.36 (0.18; 0.72) and 0.32 (0.15; 0.67), respectively] but only 35% (non-significant) decrease in the poor prognosis category [0.65 (0.22; 1.88)]}.
Discussion
This study showed that, beyond a certain comorbidity burden determinable with CAPRI and Charlson scores, mortality was high and poorly reduced by TAVR. In our opinion, this would suggest an objective situation of futility.
In this study, in agreement with the previous literature, TAVR had a positive effect vs. no-TAVR; it decreased by 66% the rate of all-cause death.17 However, undergoing TAVR was linked with specific patient characteristics; essentially, the comorbidity burden. Indeed, as expected, this comorbidity burden was lower in patients who received TAVR than in those who did not, which had a beneficial effect on survival. This was illustrated by the Charlson score that appeared prognostic of all-cause death; it has already been proposed for risk stratification in patients offered TAVR.18 Precisely, a threshold of 5 (i.e. identical to the one that defines ‘poor prognosis’ in the present study) was considered as a meaningful value associated with an increased risk of 1-year mortality.19 This was also true for the CAPRI score which encompasses cardiac and non-cardiac comorbidities. This result is the first validation of the CAPRI score as prognostic factor in an external TAVR cohort.
Surprisingly, ADL/IADL frailty indices were not found predictive of 1-year all-cause death. This contrasts with a previous report9 but confirms that frailty is difficult to standardize.20 Combining Charlson and CAPRI scores seemed appropriate to establish the three prognosis categories (good, intermediate, poor). The TAVR effect was not uniform across that range of prognoses. In the presence of a high comorbidity level (poor prognosis vs. intermediate and good), TAVR effect seemed to decrease but not disappear. Nevertheless, caution should be taken in interpreting the trends suggested by the poor prognosis category because of a lack of power due to the small sample size of this category. With this limitation in mind, it seems that the lower is the prognosis (or, the higher is the comorbidity burden), the lower is the benefit from TAVR and the higher is the residual risk of death.
This observation does not apply to other medical conditions (such as hypertension) where the higher the risk, the higher the benefit from an intervention.21 In the case of TAVR, there is a negative association between risk and benefit, which suggests that the greatest part of the risk does not come from the valvular problem22 but from the comorbidity burden. In the PARTNER trial, one of few studies on TAVR vs. medical treatment, a similar observation was made; there was a significant unfavourable association between STS score and 2-year mortality and the survival benefit from TAVR decreased as the STS score increased.6 However, the STS score was not associated with mortality in the medically treated arm6; this suggests that STS score is not as integrative as the CAPRI–Charlson combination. This is probably the reason for which adjusting the analysis for the STS score or the Logistic Euroscore did not change the prognostic value of CAPRI and Charlson scores. Other studies addressing futility were previously performed in TAVR cohorts but in the absence of medically treated arm2; this did not allow investigating the benefit from TAVR. In the present study, nearly 5% of the patients in the AS-TAVR cohort would not have had a TAVR given their ‘poor’ prognosis. This is close to the 7% futility found in a previous French nationwide survey.23
In the good and intermediate prognosis categories (as defined above), survival can be markedly improved by TAVR with a low residual risk; these categories would be the most suitable for the intervention. One unexpected observation of the present study is that, in the AS-MED cohort, an important proportion had a good or intermediate prognosis and could have theoretically benefited from TAVR. The decision not to undertake TAVR is complex; the most frequent reasons are patients' frailty and the presence of comorbidities as attested by higher Charlson scores and lower ADL/IADL scores in AS-MED than in AS-TAVR cohort. Another reason might be cognitive impairment because 40% of the patients of the AS-MED cohort had a MMS < 24. Not less complex is the subjective part of the decision; that is, the patient's wish and the physician's common sense. However, although common sense acts as a safeguard, the heart team decision is not free from bias or judgement errors and the relatively high survival in the AS-MED cohort might put into question the process of decision-making regarding TAVR.
Study limitations
First, this is not a randomized study; thus, the scores used for adjusting the analysis might not encompass all potential confounders. Yet, these scores have considered more than 30 variables that could not be all included to avoid a detrimental effect of variable number vs. cohort size disequilibrium. Another approach would have been to perform a propensity score matching on CAPRI and Charlson scores, but it has been shown that this grants no significant benefit over the classical adjustment performed herein.24 Second, IADL and ADL scores were available in less than half the AS-TAVR cohort; this decreased the statistical power but did not introduce a bias because the collection of these indices was systematic after 2015 and not spread over the whole inclusion period. Importantly, the reduced statistical power did not prevent CAPRI and Charlson scores from being the major determinants of 1-year all-cause death (which perhaps may not be as pertinent as the quality of life in a very elderly population). More generally, the use of AS-MED and AS-TAVR cohorts from different centres could have introduced confounders related to differences in medical practice; however, the patients of the two cohorts were equally distributed over the inclusion period, and the AS-TAVR cohort had similar characteristics and showed similar 1-year mortality rate than the patients managed by TAVR in France.10
Finally, the benefit from TAVR is not limited to improved survival; other aspects such as functional improvement, symptom relief, or quality of life are also important but could not be analyzed in this cohort. They may undoubtedly shed a different light on the issue of futility.
In conclusion, the benefit from TAVR is possibly predictable from objective parameters and these should be used for decision-making. While the clinical judgment remains essential, it should be the final step after an objective appraisal of TAVR benefits for a given patient condition in a given environment.
Lead author biography

Pierre Lantelme, MD, PhD, is an interventional cardiologist at Lyon University Hospital, Lyon, France. He is also the Head of the Lyon ESH Excellence Center of Hypertension. His research mainly focuses on vascular issues, such as pulse wave velocity or calcification burden, and their clinical applications in terms of risk prediction. Concerning structural heart diseases, he is committed to improve patient outcome after transcatheter aortic valve replacement (TAVR) by refining patient selection and avoiding futile indications. He has developed the CAPRI score for predicting 1-year outcome after TAVR, a dedicated score largely based on aorta calcification burden.
Data availability
The data will be shared on reasonable request to the corresponding author.
Supplementary material
Supplementary material is available at European Heart Journal Open online.
Acknowledgements
We are greatly indebted to Philip Robinson and Jean Iwaz for their critical reading and editing of the manuscript.
Conflict of interest: O.M. received consulting fees and grants from Edwards. The other authors had no conflicts of interest to disclose.
References

Comments