


Abstract
Speckle tracking echocardiography increasingly supports left atrial (LA) strain (LAS) analysis for diagnosis and prognosis of various clinical conditions. Prior limitations, such as the absence of dedicated software, have been overcome by validated ventricular-based software. A newly automated real-time and offline LA-specific software have now become available on echocardiographs and dedicated workstations. This study aimed at comparing LA strain measures obtained from new fully automated software vs. traditional semi-automated ventricular-based methods in different groups of patients.
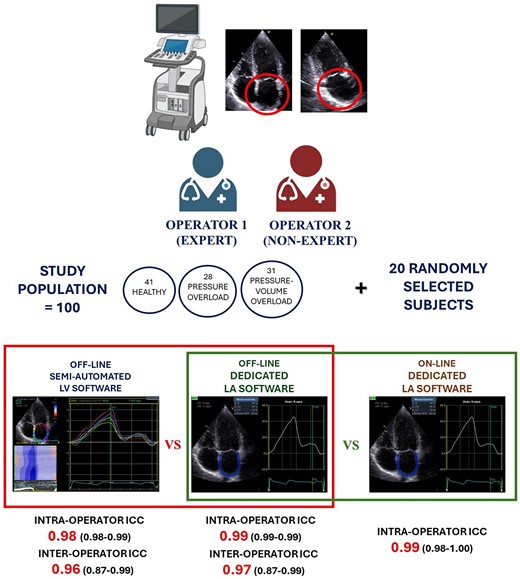
Two operators acquired LA images in a mixed population of healthy individuals and patients with pressure overload (hypertension and aortic stenosis) or pressure–volume overload (mitral regurgitation and heart failure). Subjects with prosthetic valves, heart transplant, or atrial fibrillation were excluded. Strain analysis was performed twice by old semi-automated software and new LA dedicated. LAS was then measured online on the scanning echocardiograph. Overall, 100 patients were analysed (41 healthy subjects, 28 pressure overload, 31 volume overload). LAS proved to be highly reproducible with both software. The dedicated method exhibited slightly superior inter- and intra-operator reproducibility. The online software results showed a nearly perfect reproducibility with offline software [intraclass correlation coefficient = 0.99 [0.99; 1.00]] in addition to being able to save an average of ∼30 s.
The recently developed fully automated software for dedicated LAS analysis demonstrates excellent inter- and intra-operator reproducibility, making it a reliable and efficient strain calculation method in routine clinical practice. Another advantage of online LAS calculation is time efficiency.
Introduction
Assessment of left atrial (LA) function, over and above its volume, has gained prominence as an additional diagnostic and prognostic tool in clinical practice.1 Speckle tracking echocardiography can now be considered the gold standard method for LA myocardial function evaluation since it allows detailed assessment of LA myocardial function in different phases of the cardiac cycle. The peak atrial longitudinal strain (PALS) is the most used function parameter, being representative of the reservoir function of LA cavity. The use of QRS as the reference point for the analysis of PALS is superior, in terms of feasibility, reproducibility, and time, to P-wave approach.1,2 However, the absence of dedicated software for LA strain (LAS) analysis has always been a challenge to guarantee applicability and reproducibility of LA measurements compared with those of left ventricular (LV) strain. Recent developments have introduced fully automated software for LAS analysis, both offline and online. This study evaluates, for the first time, the reproducibility of LA deformation analysis obtained by the adapted LV-based software and the recently developed dedicated automated software in different groups of patients.
Methods
Study population
Consecutive patients referred to our echocardiography laboratory for routine assessment were screened. Inclusion criteria were age ≥ 18 years and obtained informed consent. We included three groups of patients: healthy subjects (no arterial hypertension, no symptoms/signs of heart failure, and no heart valve diseases) referred to our echolab for routine screening, es. competitive sports, occupational medicine; patients with aortic stenosis (AS) and arterial hypertension (AH) (LA pressure overload), significant enough to determine LV remodelling (increased LV mass, concentric hypertrophy), elevated E/e′ ratio, and left atrial dilatation; a third group with mitral regurgitation (MR) or heart failure (HF) causing high LV mass with eccentric remodelling, high E/e′ ratio, and dilated LA with clinical sign/symptoms of volume overload (LA pressure–volume overload). Moreover, patients were included in the AS subgroup if they had at least mild AS (mean aortic gradient > 20 mmHg and/or aortic valve area < 1.5 cm2) and in the AH subgroup if systolic blood pressure was ≥140 mmHg and/or diastolic blood pressure was ≥90 mmHg on three or more measurements or those known to be on antihypertensive treatment according to European Society of Hypertension and European Society of Cardiology (ESC) guidelines.3 We included MR patients if mitral regurgitation vena contracta was >3 mm, regurgitant fraction > 30%, or EROA > 0.2 cm2.4 Finally, HF included patients were those with typical signs and symptoms and elevated natriuretic peptide levels, irrespectively of left ventricular ejection fraction, in accordance with the current ESC guidelines.5 We excluded patients with previous cardiac surgery or percutaneous procedures, permanent or persistent atrial fibrillation (AF), and those with pacemakers. In all subjects, baseline parameters including age, sex, weight, height, body mass index (BMI), body surface area (BSA), heart rate (HR), and systolic (SBP) and diastolic (DBP) blood pressure were obtained at the time of the echocardiographic examination. All procedures were made in accordance with the Declaration of Helsinki.
Standard echocardiography
All echocardiographic examinations were performed by an experienced cardiologist using a high quality commercially available system (Vivid E95, GE Medical Systems, Northen) equipped with an adult 1.5–3.6 MHz transducer. All subjects were positioned in the left lateral decubitus position. Standard LV and LA parameters were assessed following the International ASE/EACVI recommendations.6 LA volume was then normalized to BSA (LAVI). LV diastolic function was evaluated according to current guidelines. The E/e′ ratio was calculated as an estimate of LV filling pressures.7 Analysis of the mitral and tricuspid valves, as well as assessment of the severity of valve regurgitation and stenosis, was made according to the most recent ESC guidelines.8
Speckle tracking echocardiography
2D grey-scale apical four- and two-chamber views with dedicated LA focus were acquired, during three consecutive cardiac cycles, using a frame rate of 40–80 fps, in each patient. All strain analyses were performed by two operators blinded to each other’s findings, one non-expert (<100 previous LAS analyses) and one senior expert. For the assessment of LAS, an offline approach by LV-based Q-analysis was performed twice by each operator using the semi-automated software (EchoPAC V204, GE Medical, Milwaukee, WI, USA) starting from the endocardial border tracing of the LA at the end of LV systole in both apical views. The software generated a region of interest (ROI) with six segments with different colours for each projection. If necessary, the ROI was manually adjusted to accurately include the LA myocardial thickness and enhance tracking quality analysis. A curve was then generated for each of the 12 atrial segments (six for each view) of the QRS–QRS cardiac cycle.9 The image was considered as inadequate in case of impossibility to correctly trace speckles in two or more segments for each view. PALS was measured at the first positive peak, corresponding to reservoir function, and peak atrial contraction strain (PACS) at the second smaller positive peak, which reflects LA booster pump function.2 Each operator subsequently repeated the analyses on the same LA images using the same software but applying the dedicated function, LA Automated Functional Imaging (AFI, EchoPAC V204, GE Medical, Milwaukee, WI, USA). The ROI was generated by the software after identification of basal septum, basal lateral wall, and LA roof in both apical views with possible adjustments of endocardial tracing and width. LA myocardial strain curve was then obtained with automatic calculation of PALS and PACS. Finally, the LAS values were again calculated online on the whole population by the expert operator, using LA AFI, with the same software version. The feasibility and the time needed for LAS analysis using the offline and online methods were also measured for comparison, using a stopwatch.
Statistical analysis
Data are presented as means ± SD, median [interquartile range] (for continuous variables), or percentages (for binary variables), as appropriate. Normality was assessed by Kolmogorov–Smirnov test. Comparisons across patient groups were performed using analysis of variance, χ2 test, with or without continuity correction. Absolute agreement between expert and non-expert operators was tested using a two-way mixed model considering average measurements. Interrater reliability was then tested by Cohen’s Kappa coefficient. Intraclass correlation coefficient was computed by a single-rating, absolute-agreement, and two-way random-effects model. Inter-observer and intra-observer agreement for LAS parameters was also assessed using Bland–Altman analysis. All analyses were performed using SPSS (Statistical Package for the Social Sciences, Version 27.0, SPSS Inc., Chicago, IL, USA). The significance level was set at 0.05 for all analyses.
Results
Study population
A total population of 100 subjects were included: 41 healthy individuals (Group 1—controls), 28 patients with LA pressure overload (Group 2), and 31 patients with LA pressure–volume overload (Group 3). Baseline characteristics and standard echocardiographic indices of the study population are described in Table 1. Controls were younger than the other two patient groups, but gender prevalence was not different. Group 3 had higher LAVI but comparable E/e′ ratio to Group 2.
Anamnestic and standard echocardiographic parameters of the study population
| Variable | Total n = 100 | Controls n = 41 | Pressure overload n = 28 | Pressure–volume overload n = 31 | |
|---|---|---|---|---|---|
| Age | 56.4 ± 29.0 | 26.5 (16.5) | 79.1 (10.7) | 75.4 (15.3) | 0.001 |
| Male gender (%) | 65 (65.0%) | 26 (63.4%) | 17 (60.7%) | 22 (71.0%) | ns |
| Weight (kg) | 67.3 (15.2) | 62.3 (16.1) | 67.0 (13.1) | 74.0 (13.6) | 0.01 |
| Height (m) | 1.7 (0.1) | 1.7 (0.1) | 1.6 (0.1) | 1.7 (0.1) | 0.05 |
| BMI (kg/m2) | 23.9 (3.8) | 21.8 (3.1) | 25.0 (3.6) | 25.7 (3.6) | 0.001 |
| BSA (m2) | 1.7 (0.2) | 1.7 (0.3) | 1.7 (0.2) | 1.8 (0.2) | ns |
| HR (bpm) | 66 (14) | 65 (16) | 65 (10) | 68 (14) | ns |
| SBP (mmHg) | 124 (16) | 115 (8) | 132 (18) | 127 (18) | 0.001 |
| DBP (mmHg) | 71 (8) | 69 (7) | 72 (8) | 72 (10) | ns |
| IVSd (mm) | 10 (2) | 8 (1) | 13 (1) | 11 (2) | 0.001 |
| PWd (mm) | 10 (2) | 8 (1) | 11 (1) | 10 (1) | 0.001 |
| LVIDd (mm) | 48 (9) | 46 (4) | 44 (6) | 56 (12) | 0.001 |
| LVIDs (mm) | 32 (11) | 28 (5) | 26 (5) | 42 (15) | 0.001 |
| LV mass (g) | 192 (85) | 131 (48) | 208 (60) | 256 (89) | 0.001 |
| LV mass index (g/m2) | 114 (49) | 78 (27) | 128 (40) | 150 (47) | 0.001 |
| LV EF (%) | 54 (10) | 60 (1) | 56 (5) | 46 (13) | 0.001 |
| LA max volume (mL) | 71 (33) | 45 (16) | 80 (27) | 98 (32) | 0.001 |
| LA max volume index (mL/m2) | 42 (19) | 27 (9) | 49 (16) | 57 (18) | 0.001 |
| E (m/s) | 0.7 (0.2) | 0.8 (0.2) | 0.7 (0.2) | 0.8 (0.3) | ns |
| A (m/s) | 0.7 (0.3) | 0.5 (0.2) | 1.0 (0.3) | 0.7 (0.3) | 0.001 |
| E/A ratio | 1.4 (0.8) | 1.8 (0.5) | 0.7 (0.3) | 1.4 (0.9) | 0.001 |
| E/e′ ratio | 9.1 (4.8) | 5.3 (1.7) | 11.9 (2.3) | 11.9 (5.3) | 0.001 |
BMI, body mass index; BSA, body surface area; DBP, diastolic blood pressure; HR, heart rate; IVSd, end diastole inter ventricular septum; LVIDd, left ventricular internal dimension at end diastole; LVIDs, left ventricular internal dimension at end systole; LV, left ventricular; LV EF, left ventricular ejection fraction; LA, left atrium; SBP, systolic blood pressure; PWD, posterior wall at end diastole.
Left atrial strain values feasibility
PALS and PACS analyses were feasible in the whole population with both methods, even with sub-optimal acoustic windows. The fully automated software allowed shorter execution time compared with previously used semi-automated method: 84 [69–123] s vs. 112 [78–176] s. In patients with high LA volumes, endocardial tracing and identification were easier with both methods, with less need for ROI adjustment.
PALS and PACS were lower in Group 2 compared with Group 1 and in Group 3 compared with Group 2, this comparison was in both four- and two-chamber views (see Table 2). The measurements obtained by the dedicated software were slightly lower compared with the semi-automatic approach, but there were no significant statistical differences.
Mean values of left atrial strain parameters acquired by the expert operator in the three study groups
| Semi-automated software | Dedicated automated software | |||||
|---|---|---|---|---|---|---|
| Group 1 (n = 41) | Group 2 (n = 28) | Group 3 (n = 31) | Group 1 (n = 41) | Group 2 (n = 28) | Group 3 (n = 31) | |
| PALS-4Ch (%) | 40.6 ± 10.1 | 22.3 ± 10.4 | 17.0 ± 11.7 | 39.6 ± 8.7 | 22.8 ± 11.0 | 16.8 ± 11.0 |
| PALS-2Ch (%) | 41.2 ± 12.5 | 21.0 ± 8.8 | 16.1 ± 11.1 | 40.4 ± 9.5 | 20.9 ± 8.6 | 15.9 ± 9.8 |
| Global PALS (%) | 40.9 ± 9.5 | 21.4 ± 9.1 | 17.8 ± 11.3 | 40.0 ± 7.7 | 21.8 ± 9.3 | 16.3 ± 10.2 |
| PACS-4Ch (%) | 11.3 ± 6.3 | 12.4 ± 8.6 | 8.0 ± 6.0 | 10.8 ± 6.0 | 11.6 ± 7.9 | 8.1 ± 7.2 |
| PACS-2Ch (%) | 12.8 ± 5.3 | 12.4 ± 7.1 | 9.5 ± 7.5 | 12.0 ± 5.3 | 12.9 ± 8.1 | 9.0 ± 7.9 |
| Global PACS (%) | 11.7 ± 4.1 | 12.2 ± 6.8 | 8.8 ± 6.6 | 11.4 ± 4.7 | 12.2 ± 6.8 | 8.5 ± 7.4 |
PALS, peak atrial longitudinal strain; PACS, peak atrial contraction strain; 4CH, four-chamber; 2CH, two-chamber.
Semi-automatic vs. automated dedicated LA software reproducibility
LAS analysis had an overall high inter-operator reproducibility and intra-operator reproducibility.
Table 3 displays the results for intra-operator reproducibility obtained from the two methods. Notably, the dedicated automated software exhibited a slight superiority over the semi-automated method in terms of inter-operator reproducibility. There were no significant differences between the values obtained by the expert and the novice operator, thus showing the fast-learning curve for the method. Table 4 includes data on inter-operator reproducibility from the two software. The dedicated automated software again outperformed the semi-automatic one, demonstrating slightly higher reproducibility within the same operator. Table 3 also shows results of correlation analysis between the two methods. Figures 1 and 2 show Bland–Altman analysis of PALS intra- and inter-operator reproducibility, respectively.
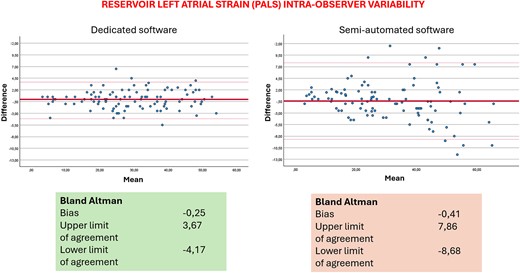
Bland–Altman analysis for intra-operator reproducibility.
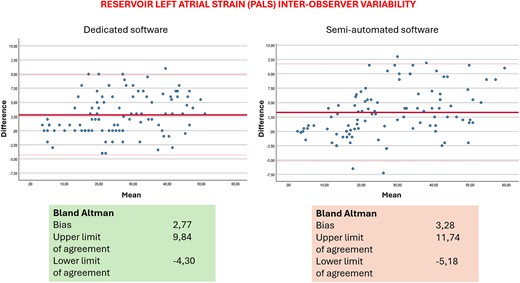
Bland–Altman analysis for inter-operator reproducibility.
Intra-observer intraclass correlation coefficient (ICC) for measures of PALS and PACS with semi-automated and dedicated software for operator 1 (expert) and operator 2 (non-expert)
| Op 1 | Op 2 | |||||||||
|---|---|---|---|---|---|---|---|---|---|---|
| Semi-automated software ICC | ICC [95% CI] | Dedicated software ICC | ICC [95% CI] | Correlation | Semi-automated software ICC | ICC [95% CI] | Dedicated software ICC | ICC [95% CI] | Correlation | |
| PALS-4Ch | 0.97 | 0.95–0.98 | 0.99 | 0.98–0.99 | 0.84, P < 0.001 | 0.97 | 0.96–0.98 | 0.96 | 0.94–0.97 | 0.84, P < 0.001 |
| PALS-2Ch | 0.95 | 0.93–0.97 | 0.99 | 0.99–0.99 | 0.79, P < 0.001 | 0.95 | 0.92–0.97 | 0.96 | 0.94–0.98 | 0.80, P < 0.001 |
| Global PALS | 0.98 | 0.98–0.99 | 0.99 | 0.99–0.99 | 0.85, P < 0.001 | 0.95 | 0.92–0.96 | 0.97 | 0.95–0.98 | 0.83, P < 0.001 |
| PACS-4Ch | 0.95 | 0.93–0.97 | 0.96 | 0.93–0.97 | 0.75, P < 0.001 | 0.96 | 0.94–0.97 | 0.94 | 0.92–0.94 | 0.74, P < 0.001 |
| PACS-2Ch | 0.95 | 0.92–0.96 | 0.95 | 0.93–0.97 | 0.72, P < 0.001 | 0.96 | 0.93–0.97 | 0.95 | 0.92–0.97 | 0.80, P < 0.001 |
| Global PACS | 0.96 | 0.95–0.98 | 0.97 | 0.96–0.98 | 0.79, P < 0.001 | 0.97 | 0.96–0.98 | 0.95 | 0.93–0.97 | 0.82, P < 0.001 |
CI, confidential interval; ICC, intraclass correlation coefficient; PALS, peak atrial longitudinal strain; PACS, peak atrial contraction strain; 4CH, four-chamber; 2CH, two-chamber.
Inter-observer intraclass correlation coefficient (ICC) for measures of PALS and PACS with the two software
| Semi-automated sofware | Dedicated software | |||||
|---|---|---|---|---|---|---|
| Expert vs. non-expert | ICC | 95% CI lower bound | 95% CI upper bound | ICC | 95% CI lower bound | 95% CI upper bound |
| PALS-4Ch | 0.94 | 0.80 | 0.97 | 0.96 | 0.90 | 0.98 |
| PALS-2Ch | 0.98 | 0.94 | 0.99 | 0.97 | 0.83 | 0.99 |
| Global PALS | 0.96 | 0.87 | 0.99 | 0.97 | 0.87 | 0.99 |
| PACS-4Ch | 0.89 | 0.82 | 0.94 | 0.95 | 0.93 | 0.97 |
| PACS-2Ch | 0.96 | 0.92 | 0.98 | 0.95 | 0.87 | 0.97 |
| Global PACS | 0.93 | 0.85 | 0.96 | 0.96 | 0.92 | 0.97 |
CI, confidential interval; ICC, intraclass correlation coefficient; PALS, peak atrial longitudinal strain; PACS, peak atrial contraction strain; 4CH, four-chamber; 2CH, two-chamber.
Offline vs. online dedicated LA software feasibility, reproducibility, and time consumption
Table 5 describes the agreement between the automated offline and online LAS analyses performed by the expert operator. The online analysis was feasible in all patients (100%). The results confirmed a strong reliability, even when using the software of the echocardiographic machine itself. The time needed for the online automated analysis was the shortest, being 69 [48–97] s.
Intra-observer ICC for measures of PALS and PACS with dedicated software—online or offline measures
| Online ICC | 95% CI lower bound | 95% CI upper bound | Offline ICC | 95% CI lower bound | 95% CI upper bound | |
|---|---|---|---|---|---|---|
| PALS-4Ch | 0.97 | 0.95 | 0.99 | 0.99 | 0.98–0.99 | 0.99 |
| PALS-2Ch | 0.98 | 0.97 | 0.99 | 0.99 | 0.99–0.99 | 0.99 |
| Global PALS | 0.99 | 0.98 | 1.00 | 0.99 | 0.99–0.99 | 0.99 |
| PACS-4Ch | 0.98 | 0.96 | 0.98 | 0.96 | 0.93–0.97 | 0.96 |
| PACS-2Ch | 0.95 | 0.89 | 0.98 | 0.95 | 0.93–0.97 | 0.95 |
| Global PACS | 0.97 | 0.93 | 0.99 | 0.97 | 0.96–0.98 | 0.97 |
CI, confidential interval; ICC, intraclass correlation coefficient; PALS, peak atrial longitudinal strain; PACS, peak atrial contraction strain; 4CH, four-chamber; 2CH, two-chamber.
Discussion
The main findings of our study were: (i) confirmation of high feasibility of both LA strain measurements; (ii) PALS exhibited high reproducibility when obtained by both the semi-automated and the new dedicated automated software; (iii) the automated software showed slightly superior inter-operator reproducibility and higher intra-operator reproducibility; (iv) the use of online software for dedicated LAS analysis guaranteed very high agreement with the offline software; and (v) the automated analysis is faster than the semi-automated one, even more when using online software.
The importance of assessing LA function is becoming increasingly essential for everyday clinical practice, particularly in patients with heart failure with preserved ejection fraction where LAS has been included in the list of parameters for an accurate estimation of filling pressures.10
However, evidences of possible LAS applications are also available in other conditions such as valve diseases,11–13 AF,14–16 and acute heart failure or reduced ejection fraction,16–19 especially in the quantification on wall fibrosis,20 even if not yet validated in reference expert consensus or guidelines. The reduction of LAS can provide valuable insights into the diagnosis and prognosis of all these and other conditions. Evaluation of LAS measurements can now be achieved by employing two distinctive software platforms. The first entailed the use of a recently developed innovative automated software dedicated selectively to the LA, and the second involves adapting the conventional semi-automatic software originally produced for ventricular myocardial function but for the analysis of LA myocardial function. The latter method is the currently most used technique, according to the available literature, for assessment of LA function.
LV strain has been widely tested for its feasibility, reproducibility, validation, and comparison between different software21–23 but reproducibility of LAS proved to be somewhat limited. The MASCOT HIT study, promoted by the European Association of Cardiovascular Imaging (EACVI), previously demonstrated good measurement agreement between young and senior operators and a superiority of feasibility, reproducibility, and timesaving when using a QRS-based compared with P-wave-based approach.1 To the best of our knowledge, there are no available data that compared the semi-automated and automated dedicated LA software for the assessment of LA myocardial function.
The results of this study confirm the robust reproducibility of LAS analysis when using both methods. Nonetheless, a subtle superiority in inter-operator and intra-operator reproducibility was found, favouring the dedicated fully automated approach over and above the conventional semi-automated method. The implementation of real-time online computation for LAS exhibited an exceptional level of reproducibility, nearly achieving 100% agreement, when compared with the same offline software. This positive attribute of the automated software is further accentuated by the inclusion of temporal efficiency, having demonstrated a further shorter computation time (65 s vs. 84 s, respectively) that can be extremely useful in a busy everyday practice. The observed differences in reproducibility between the semi-automatic and automated dedicated LA software methods emphasize the importance of a correct software choice in cardiac parameter analysis.
The analysis by the previous LV dedicated software applied to the LA required a manual tracing of the atrial ROI and further operator adjustments that could lead to possible errors or, however, to a higher variability in the measurements, as already reported in literature. The variability that we found in the Bland–Altman analysis is in line with those previously reported. Regarding inter-operator reproducibility, the bias and limits of agreement are probably higher because the two operators had different experience background and the analysis by two experts would give even better results. We underline the importance to measure and report LA strain when the operator is finally confident and expert in the field. However, with the new software, the biases are lower and, being mainly automatic, the possibility of error is lower.
Thus, while both methods can yield reliable results, the dedicated automated software appears to provide an extra advantage, particularly when multiple operators are involved or when repeated measurements are necessary within a single operator’s workflow. The lack of any significant difference in measurement reproducibility based on sex or body surface area further establishes the robustness of the software measurements and their applicability. The validation of the online measurements vs. offline methods can improve the use of LA strain measurements in clinical practice, allowing the inclusion of PALS value in the report without significant additional time.
Study limitations
LA conduit strain was not tested in our analysis, considering the less validated impact in clinical practice. This is a single centre study with a relatively small sample size. The results would need further validation on wider populations. The population was made of only Caucasian subjects, but we do not see any reasons of possible different results in other ethnic groups. Moreover, the analysis was performed by a single vendor.
Clinical perspectives
The evaluation of LAS across various clinical scenarios has not only yielded valuable pathophysiological insights but has also underscored its diagnostic and prognostic significance, as elucidated in many other studies. Nonetheless, certain constraints continue to hinder its broader adoption, primarily stemming from technical considerations involving measurement standardization, parameter selection, and determination of appropriate cut-off values across different settings. This study highlights the potential advancement provided by the fully automated software for LA strain analysis, potentially paving the way for enhanced future integration into routine clinical practice.
Conclusion
The recently developed fully automated software designed for the analysis of LAS provides significant level of reproducibility, irrespective of operator’s expertise. Both the automated calculation and the traditionally utilized semi-automated method have yielded highly favourable agreement and time efficiency across a range of normal individuals and patients with different pathologies, particularly when using the fully automated software. Consequently, these options are both well-suited for strain calculation in routine clinical practice.
Consent
All patients gave written consent to be included in the study.
Funding
None.
Data availability
Data available on request.
Lead author biography

Dr. Giulia Elena Mandoli, MD, FESC, FISC, is a Clinical Researcher in Cardiology at Department of Medical Biotechnologies, University of Siena, Italy. She also holds a position as a PhD fellow at the Umeå University, Sweden. She is the current Deputy Chair of the Heart Imagers of Tomorrow (HIT), the young group of the European Association of Cardiovascular Imaging (EACVI). Her main fields of expertise include echocardiography, Speckle Tracking and heart failure.
References
Author notes
Conflict of interest: None declared.
