


Coronary artery disease (CAD) remains the leading cause of morbidity and mortality in women, with reports of sex differences in risk profile and symptoms at presentation, which may impact provider assessments, referrals, and management. Despite targeted efforts on women’s cardiovascular (CV) health in the last several decades, significant gender-based differences persist in management trends and CV outcomes in stable heart disease, with evidence suggestive of delayed and mis-diagnosis of CAD, particularly in female patients with angina.1 Myocardial perfusion scintigraphy (MPS) is a non-invasive imaging test with an established role in the diagnosis of angina in patients with moderate–high CV risk. We sought to compare the gender differences in baseline CV risk profile and the use of MPS among male and female patients with suspected or known CAD, in a tertiary, high-volume centre in Italy, over a period of 20 years from 2000 to 2020. The study was approved by the institutional review committee, and the subject gave informed consent. In this cross-sectional, observational, single-centre study of patients evaluated across 5 yearly intervals from 2000 to 2020, we evaluated 20 953 patients (31% women) with a mean age of 66.8 ± 9.2 years, who were referred for stress/rest myocardial scintigraphy for evaluation of stable angina.
Across the 5-yearl intervals from 2000 to 2020, men were more likely to be referred for MPS testing; however, there has been a consistent increase in the proportion of women referred for evaluation (Figure 1). This trend was persistent even during the COVID-19 pandemic in 2019–20 among patients who presented with symptoms of stable angina. Over the last 20 years, women referred for evaluation were likely to have a significant decrease in the presence of ischaemic myocardium at risk, as identified by semi-quantitative scores including the summed rest score (SRS), the summed stress score (SSS), and a significant increase in ejection fraction (EF), while a consistent trend was not seen in men (Tables 1 and 2). In a sub-analysis (available on request) among women referred for evaluation, there is a significant increase in the prevalence of hypertension with time but no increase in the prevalence of smoking or diabetes. There were no significant differences in clinical presentation by gender.
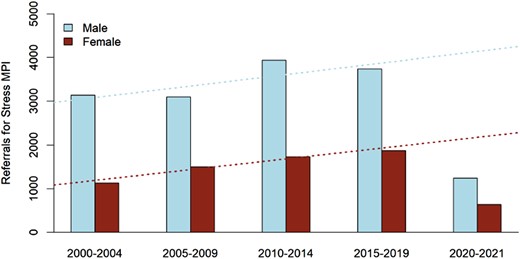
Trends in referral patterns for myocardial perfusion scintigraphy by sex, over the last 20 years from 2000 to 2020.
Trends in clinical risk and patterns of myocardial perfusion scintigraphy in women, over the last 20 years from 2000 to 2020
| 2000–04 | 2004–09 | 2009–14 | 2014–19 | 2019–20 | P-value | P-value trend | |
|---|---|---|---|---|---|---|---|
| Typical angina | 305 (27) | 809 (54) | 870 (50) | 885 (47) | 131 (49) | <0.001 | <0.001 |
| Dyspnoea | 749 (66) | 1161 (77) | 1432 (83) | 1583 (84) | 185 (70) | <0.001 | <0.001 |
| Family history | 635 (56) | 908 (61) | 850 (49) | 908 (48) | 128 (48) | <0.001 | <0.001 |
| Smoking history | 448 (40) | 666 (44) | 613 (35) | 810 (43) | 91 (34) | <0.001 | |
| Diabetes | 531 (47) | 831 (55) | 848 (49) | 917 (49) | 117 (44) | <0.001 | 0.857 |
| Hypertension | 613 (54) | 989 (66) | 1125 (65) | 1265 (67) | 142 (54) | <0.001 | <0.001 |
| Hypercholesterolaemia | 606 (53) | 873 (58) | 1002 (58) | 1055 (56) | 149 (56) | 0.13 | 0.605 |
| Previous revascularization | 201 (18) | 261 (17) | 302 (17) | 320 (17) | 49 (18) | 0.976 | 0.617 |
| EF rest | 59 (48.2–65) | 61 (51–67) | 68 (60–74) | 70 (62–76) | 72 (65–75) | <0.001 | <0.001 |
| EF stress | 58 (46–65) | 60 (50–68) | 68 (60–74) | 69 (62–76) | 71 (64–78) | <0.001 | <0.001 |
| EDV rest | 101 (82.8–138) | 100 (77–132) | 75 (61–94) | 71 (59–87) | 65 (55–81) | <0.001 | <0.001 |
| EDV stress | 102 (82–140) | 94 (77–125) | 73 (60–91) | 69 (56–84) | 62 (52–78) | <0.001 | <0.001 |
| ESV rest | 42 (30–68) | 39 (26–65) | 24 (17–37) | 22 (15–32) | 18 (13–28) | <0.001 | <0.001 |
| ESV stress | 43 (29–73) | 37 (25–63) | 23 (17–35) | 21 (14–31) | 17 (13–30) | <0.001 | <0.001 |
| SSS | 8 (4–12) | 6 (3–12) | 4 (1–8) | 4 (2–7) | 3 (2–5) | <0.001 | <0.001 |
| SRS | 2 (0–5) | 1 (0–4) | 0 (0–3) | 0 (0–2) | 0 (0–1) | <0.001 | <0.001 |
| SDS | 4 (2–7) | 4 (2–7) | 3 (1–5) | 3 (1–5) | 3 (1.5–5) | <0.001 | <0.001 |
EF, ejection fraction; EDV, end diastolic volume; ESV, end systolic volume; SSS, summed stress score; SRS, summed rest score; SDS, summed difference score.
Trends in clinical risk and patterns of myocardial perfusion scintigraphy in men, over the last 20 years from 2000 to 2020
| 2000–04 | 2004–09 | 2009–14 | 2014–19 | 2019–20 | P-value | P-value trend | |
|---|---|---|---|---|---|---|---|
| Typical angina | 1144 (36) | 1559 (50) | 1957 (50) | 1680 (45) | 294 (55) | <0.001 | <0.001 |
| Dyspnoea | 1726 (55) | 2404 (78) | 3410 (87) | 3185 (85) | 491 (92) | <0.001 | <0.001 |
| Family history | 1352 (43) | 1799 (58) | 1944 (49) | 1784 (48) | 326 (61) | <0.001 | <0.001 |
| Smoking history | 1147 (37) | 1546 (50) | 1558 (40) | 1355 (36) | 253 (47) | <0.001 | 0.966 |
| Diabetes | 1356 (43) | 2004 (65) | 2131 (54) | 1728 (46) | 356 (67) | <0.001 | 0.067 |
| Hypertension | 1366 (44) | 1949 (63) | 2609 (66) | 2429 (65) | 290 (54) | <0.001 | <0.001 |
| Hypercholesterolaemia | 1835 (59) | 2236 (72) | 2471 (63) | 2004 (54) | 391 (73) | <0.001 | <0.001 |
| Previous revascularization | 533 (17) | 538 (17) | 660 (17) | 642 (17) | 82 (15) | 0.808 | 0.546 |
| EF rest | 60 (50–66) | 59 (49–66) | 58 (48–65) | 59 (51–66) | 60 (51–66) | <0.001 | 0.027 |
| EF stress | 58 (47–66) | 58 (47–65) | 58 (48–64) | 58 (50–65) | 59 (50–65) | 0.004 | 0.008 |
| EDV rest | 103 (82–135) | 103 (83–136) | 110 (91–139) | 107 (89–134) | 106 (87.2–133) | <0.001 | <0.001 |
| EDV stress | 102 (81–135) | 101 (82–138) | 107 (89–135) | 103 (85.5–128) | 101 (83–126) | <0.001 | 0.017 |
| ESV rest | 41 (28–67) | 42 (29–68) | 46 (32–70) | 43 (31–64) | 42 (30–61) | <0.001 | 0.299 |
| ESV stress | 42 (28–70) | 43 (29–69.5) | 45 (33–67) | 42 (31–61) | 41 (29–60) | <0.001 | <0.001 |
| SSS | 8 (4–12) | 7 (4–12) | 6 (3–11) | 6 (3–10) | 6 (3–10) | <0.001 | <0.001 |
| SRS | 2 (0–5) | 2 (0–5) | 2 (0–6) | 1 (0–4) | 1 (0–3) | 0.006 | 0.996 |
| SDS | 5 (2–8) | 4 (2–7) | 3 (1–5.8) | 4 (2–6) | 4 (3–6) | <0.001 | <0.001 |
EF, ejection fraction; EDV, end diastolic volume; ESV, end systolic volume; SSS, summed stress score; SRS, summed rest score; SDS, summed difference score.
This analysis, to the best of our knowledge, is the first to evaluate and report gender-based disparities in referral patterns for the evaluation of stable angina in a contemporary population in Italy, from 2000 to 2020. Over the last 20 years, the proportion of men referred for MPS in a tertiary centre for evaluation of stable angina was significantly higher compared with women. However, trends suggest an increase in proportion of women being referred for evaluation by nuclear testing for stable CAD, with similar trends of referral during the COVID-19 pandemic. Differences in clinical presentation, diagnostic accuracy of testing strategies, and a lack of sex-based risk stratification in the evaluation of CAD could potentially explain the differential patterns of evaluation of stable CAD. Few studies have examined disparities in provider referral patterns for evaluation of stable CAD in men and women, and these findings are relevant to understanding gender-based differences in risk stratification and diagnostic accuracy in suspected CAD and their subsequent effect on CV outcomes.2 A sub-analysis of the PROMISE (Prospective Multicenter Imaging Study for Evaluation of Chest Pain) trial elucidated that a patient’s sex could influence the entire diagnostic pathway for stable CAD, from presentation, provider referrals for non-invasive testing, and their effect on prognosis.3 While our results may be affected by realistic rates of prevalence of CAD by sex and age, data suggest that the lifetime risk of CAD is equivalent for men and women. Gender-specific approaches to the evaluation of CAD, specifically understanding factors that influence diagnostic testing, may improve the current landscape of differential CV outcomes in women compared with men.
Data availability
Data and statistical analysis are available for review, upon reasonable request.
Lead author biography
 Dr Suvasini Lakshmanan is a cardiology fellow-in-training at the University of Iowa Hospitals and Clinics, USA. Dr Suvasini Lakshmanan completed her medical school training at the Jawaharlal Institute of Postgraduate Medical Education and Research, India, and her internal medicine residency at the University of Massachusetts. She earned a Master of Science in Clinical and Translational Research at Brown University School of Public Health. Thereafter, she completed her advanced imaging/cardiac CT fellowship at the Lundquist Institute at Harbor UCLA. Her research interests lie at the intersection of cardiac imaging/cardiac CT, cardiovascular prevention, and their application in clinical trials. To this effect, she is pursuing a part-time master's degree in clinical trials at Oxford University, UK. Dr Lakshmanan has served on the board of the American Society of Preventive Cardiology and will serve as Chair of the AHA FIT programming committee.
References
Author notes
Conflict of interest: None declared.
