


Abstract
Life-threatening ventricular arrhythmias (LTVAs) are common manifestations of sepsis. The majority of sepsis patients with LTVA are unresponsive to initial standard treatment and thus have a poor prognosis. There are very limited studies focusing on the early identification of patients at high risk of LTVA in sepsis to perform optimal preventive treatment interventions. We aimed to develop a prediction model to predict LTVA in sepsis using machine learning (ML) approaches.
Six ML algorithms including CatBoost, LightGBM, and XGBoost were employed to perform the model fitting. The least absolute shrinkage and selection operator (LASSO) regression was used to identify key features. Methods of model evaluation involved in this study included area under the receiver operating characteristic curve (AUROC), for model discrimination, calibration curve, and Brier score, for model calibration. Finally, we validated the prediction model both internally and externally. A total of 27 139 patients with sepsis were identified in this study, 1136 (4.2%) suffered from LTVA during hospitalization. We screened out 10 key features from the initial 54 variables via LASSO regression to improve the practicability of the model. CatBoost showed the best prediction performance among the six ML algorithms, with excellent discrimination (AUROC = 0.874) and calibration (Brier score = 0.157). The remarkable performance of the model was presented in the external validation cohort (n = 9492), with an AUROC of 0.836, suggesting certain generalizability of the model. Finally, a nomogram with risk classification of LTVA was shown in this study.
We established and validated a machine leaning-based prediction model, which was conducive to early identification of high-risk LTVA patients in sepsis, thus appropriate methods could be conducted to improve outcomes.
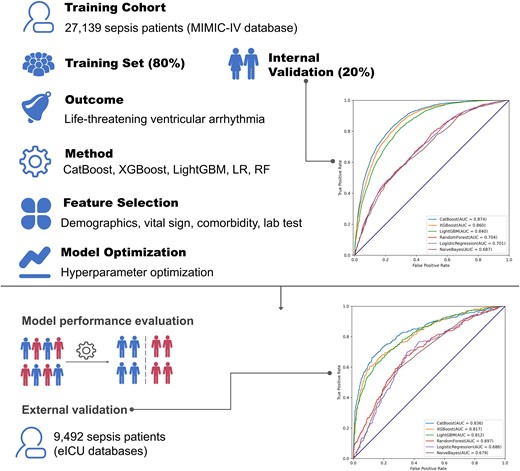
Overview of the study design. A total of 27 139 patients with sepsis were randomly divided into the training set and internal validation set at a ratio of 8:2. Several machine learning algorithms including CatBoost, XGBoost, and logistic regression were used to perform the model fitting. After key feature selection, hyper-parameter optimization was implemented to modify the model. Finally, 9492 sepsis patients from another database were involved to conduct external validation.
Introduction
Sepsis, defined as an infection associated with organ injury distant from the site of infection, is characterized as fever (or hypothermia), tachycardia, tachypnoea, and blood leucocyte changes.1 Moreover, sepsis is a common condition in the intensive care unit (ICU) and is associated with unacceptably high mortality, approximately 2.8 million deaths per year are attributable to sepsis.2 Robust data indicate that patients with sepsis are vulnerable to suffering from ventricular arrhythmias (VAs), including ventricular tachycardia (VT) and ventricular fibrillation (VF), which could explain the majority of sudden cardiac death (SCD) cases.3,4 Furthermore, existing evidence has confirmed that patients hospitalized for sepsis developed new VA events and were at high risk of SCD and in-hospital mortality.5,6
Life-threatening ventricular arrhythmias (LTVAs), which occur with severely depressed ventricular function and unstable haemodynamics state, are the main causes of cardiac arrest.7,8 However, half of the patients with LTVA are unresponsive to initial standard treatment, and thus have a poor prognosis.9 Moreover, the patients requiring more than 40 min of cardiopulmonary resuscitation almost all died.10 Therefore, early recognition of sepsis patients at high risk of LTVA is critical for timely interventions as well as intensive care and monitoring.
Machine learning (ML), a sub-field of artificial intelligence, can easily incorporate numerous variables and then identify non-linear associations and complex interactions among variables.11 ML algorithms have been explored in extensive fields of arrhythmia, including, but not limited to, classification of arrhythmia, detection of arrhythmia origins, severity risk prediction, and prognosis prediction in certain populations.12–14 Nevertheless, the utility of ML algorithms in identifying sepsis patients with a high risk of LTVA has not been determined.
Given the susceptibility and the severity of LTVA in sepsis patients, we aimed to establish a novel model to predict the incidence of LTVA in patients with sepsis utilizing ML algorithms. The validated capacity of enabling straightforward and accurate risk stratification of LTVA in sepsis patients of the prediction model may facilitate to perform optimal preventive treatment interventions.
Methods
This was a retrospective study based on two large-scale databases, aiming to build a clinical prediction model to predict LTVA in sepsis patients (see Graphical Abstract).
Sources of data
A large critical care database, named Medical Information Mart for Intensive Care IV (MIMIC-IV, version 2.0), was employed in the present study to perform model training. The MIMIC-IV database contains data from more than 200 000 individuals who were admitted to various ICUs of the Beth Israel Deaconess Medical Center (BIDMC) between 2008 and 2019.15 Additionally, data of sepsis patients extracted from the eICU Collaborative Research Database (eICU, version 2.0), which was a multi-centre critical care database with high granularity data for over 200 000 admissions to ICUs, were used to conduct external validation. Data of the two databases include vital signs, medications, laboratory measurements, observations and notes charted by care providers, fluid balance, procedure codes, diagnostic codes, imaging reports, hospital length of stay, survival data, and more. Data from MIMIC-IV and eICU were independent of each other. The description of eICU was available elsewhere.16 The author (L.L.) is qualified to inquiring the information from the databases (record ID: 35965741). Since the study was an analysis of the third-party anonymized publicly available database with pre-existing Institutional Review Board (IRB) approval, IRB approval from our institution was exempted. The study was reported according to the recommendations of the Transparent Reporting of a multivariable prediction model for Individual Prognosis Or Diagnosis statement.17
Participants
We included 27 139 and 9492 sepsis patients with known outcomes (LTVA or non-LTVA) in training and validation cohorts, respectively. Patients aged < 18 years old or with inadequate data were excluded. In the present study, sepsis was defined as infection-related organ dysfunction which was represented by an increase in the Sequential Organ Failure Assessment (SOFA) score of 2 points or more.18 Furthermore, in this study, LTVA came in two main forms: sustained VT (duration greater than 30 s) and VF.19
Data imputation
The extreme and error data that failed the logic check were filled with mean values. We excluded features with a ratio of missing value > 30%. Mean imputation was performed to fill in missing data of <5%. Multiple imputation was used to handle variables with missing data of between 5 and 30%.20
Data collection
A total of 67 features including demographic, clinical, and laboratory data from the two databases were extracted via the PostgreSQL tool (version 13.0) (see Supplementary material online, Table S1). To ensure the practicability of the prediction model, we employed the data of the first medical records instead of the maximum or the minimum data during ICU stay.
Model development
Feature selection
After excluding the features with a heavy proportion of missing value and imputing missing data, 54 features were remaining for feature selection. To eliminate irrelevant and redundant collinear features and improve the practical applicability of the model, we conducted key feature selection employing least absolute shrinkage and selection operator (LASSO) regression which could automatically remove unnecessary or uninfluential covariates based on a penalization coefficient.21 Additionally, the SHapley Additive exPlanations (SHAP) values22 and random forest (RF) algorithm23 were applied to rank all features by feature importance. Finally, the most predictive variables were selected by integrating the three methods.
Model evaluation
To evaluate the performance of ML models, we used two metrics: area under the receiver operating characteristic curve (AUROC) and area under the precision–recall curve (AUPR). The calibration curve and Brier score were applied to qualitatively and quantitatively evaluate the calibration of models, respectively. Decision curve analysis (DCA) was performed to present the decision benefit of models. Additionally, accuracy, sensitivity, specificity, positive prediction value (PPV), negative prediction value (NPV), Matthews correlation coefficient (MCC), and F1-score were performed in each model to quantitatively evaluate prediction performance.
ML algorithm selection
A total of six commonly used baseline ML algorithms, including CatBoost, XGBoost, LightGBM, logistic regression (LR), RF, and naïve Bayes, were employed to initially predict LTVA in sepsis patients based on the selected features. The algorithm with the best prediction performance was selected for the remaining analyses.
Model optimization
In ML algorithms, hyper-parameter optimization (HPO) is a critical procedure for achieving satisfactory performance. Hyper-parameters are numerical pre-sets whose values are assigned before the commencement of a learning process. An ideal combination of hyper-parameters will significantly improve model performance. To visualize the process of HPO, the Optuna package (version 2.10.0),24 an open-source optimization framework, which allowed us to write complex ML experiments quickly, efficiently, and dynamically, was employed to perform HPO with the Hyperband method and test different combinations of hyper-parameters.25
Model fitting
Before model fitting, the combination of Synthetic Minority Over-sampling Technique and under-sampling was used to overcome the class-imbalance issue in the present study.26 The final model was fitted with the best combination of the hyper-parameters. Data from the training cohort were randomly divided into the training set and the internal validation set based on the ratio of 8:2. Herein, we modelled the LTVA prediction task as a binary classification problem. All included ML models output a normalized probability of LTVA risk ranging from 0 to 1.
Model validation
External validation based on the eICU cohort was performed to assess the robustness and generalizability of the model. AUROC was used to evaluate the performance of the six ML algorithms. Because LTVA was highly associated with an increased risk of mortality, the CatBoost model was employed to predict 1-year mortality. Moreover, the prediction results were validated and presented with a nomogram based on the external validation set. Recursive partitioning analysis was performed to construct a survival decision tree for risk stratification with R package ‘rpart’ based on the total points of the nomogram of each participant. Additionally, the prediction for every patient was plotted in order of their risk to assess the prediction distribution from the model.
Statistical analysis
Statistical analysis was performed in Python (version 3.9.0) and R (version 4.1.0). Patients were divided into LTVA and non-LTVA groups, and variables were compared between groups. Descriptive statistics were reported as frequency count and percentage, for qualitative data, and mean ± standard deviation, for quantitative data. t-Test and chi-square test were used to evaluate differences between two groups for continuous and categorical variables, respectively. Spearman correlation coefficient was employed to verify the possible statistical association between variables. P values ≤ 0.05 were considered significant.
Results
Characteristics of the study population
A total of 27 139 patients [mean (SD) age, 68.2 (16.2) years; 15 626 (57.6%) male] with sepsis were identified in the training cohort, among them 1136 patients (4.2%) suffered from LTVA during hospitalization (see Supplementary material online, Figure S1). For patients with LTVA, mean temperature (36.7 ± 0.7 vs. 36.9 ± 0.6, P < 0.001) and systolic blood pressure (SBP) (85.0 ± 17.3 vs. 89.5 ± 16.8, P < 0.001) were significantly higher than patients without LTVA. Additionally, in the LTVA group, 734 patients (63.7%) presented with congestive heart failure (CHF), 579 (51.0%) with atrial fibrillation (AF), 390 (34.3%) with acute myocardial infarction (AMI), and 533 (46.9%) with pneumonia, incidences of the comorbidities were statistically higher than the non-LTVA group. The baseline characteristics of the validation cohort are summarized in Table 1. The comparisons of baseline characteristics between the MIMIC-IV cohort and the eICU cohort are shown in Supplementary material online, Table S2.
Baseline characteristic
| Variables | Training cohort (n = 27 139) | Validation cohort (n = 9492) | ||||
|---|---|---|---|---|---|---|
| LTVA (n = 1136) | Non-LTVA (n = 26 003) | P value | LTVA (n = 177) | Non-LTVA (n = 9315) | P value | |
| Temperature, °C | 36.7 ± 0.7 | 36.9 ± 0.6 | <0.001 | 36.6 ± 1.3 | 36.9 ± 1.0 | <0.001 |
| SBP, mmHg | 85.0 ± 17.3 | 89.5 ± 16.8 | <0.001 | 95.9 ± 22.5 | 99.4 ± 20.9 | <0.001 |
| CCI | 6.23 ± 2.83 | 5.65 ± 2.88 | <0.001 | 5.98 ± 2.96 | 4.21 ± 2.23 | <0.001 |
| MV, % | 710 (62.5%) | 10 864 (41.8%) | <0.001 | 104 (58.8%) | 2567 (27.6%) | <0.001 |
| qSOFA score | 0.78 ± 0.78 | 0.69 ± 0.74 | <0.001 | 1.91 ± 0.72 | 1.78 ± 0.75 | 0.023 |
| CHF, % | 724 (63.7%) | 8467 (32.6%) | <0.001 | 38 (21.5%) | 854 (9.2%) | <0.001 |
| AF, % | 579 (51.0%) | 9181 (35.3%) | <0.001 | 37 (20.9%) | 1088 (11.7%) | <0.001 |
| AMI, % | 390 (34.3%) | 2219 (8.5%) | <0.001 | 35 (17.8%) | 302 (3.2%) | <0.001 |
| Pneumonia, % | 533 (46.9%) | 9673 (37.2%) | <0.001 | 72 (40.7%) | 3117 (33.5%) | 0.044 |
| AKI, % | 765 (67.3%) | 12 760 (49.1%) | <0.001 | 72 (40.7%) | 2552 (27.4%) | <0.001 |
LTVA, life-threatening ventricular arrhythmia; SBP, systolic blood pressure; CCI, Charlson comorbidity index; MV, mechanical ventilation; qSOFA, quick Sequential Organ Failure Assessment; CHF, congestive heart failure; AF, atrial fibrillation; AMI, acute myocardial infarction; AKI, acute kidney injury.
Development of the prediction model
The LASSO regression was employed to eliminate redundant or irrelevant features, and to improve the practicability of the model. Only 10 of the 54 features were eventually chosen for modelling, among which 9 features had a positive association with LTVA [SBP, Charlson comorbidity index (CCI), requirement of mechanical ventilation (MV), quick SOFA (qSOFA) score, pneumonia, CHF, AF, AMI, acute kidney injury (AKI)] (Figure 1). Furthermore, feature importance was evaluated by SHAP value and RF algorithm and showed the analogous results of LASSO regression (see Supplementary material online, Figure S2). In addition, SHAP force plot enabled personalized interpretation of the model (see Supplementary material online, Figure S3). Accordingly, the 10 key features were selected to build the prediction model. The correlation between the 10 features was assessed by Spearman’s correlation coefficient (see Supplementary material online, Figure S4).
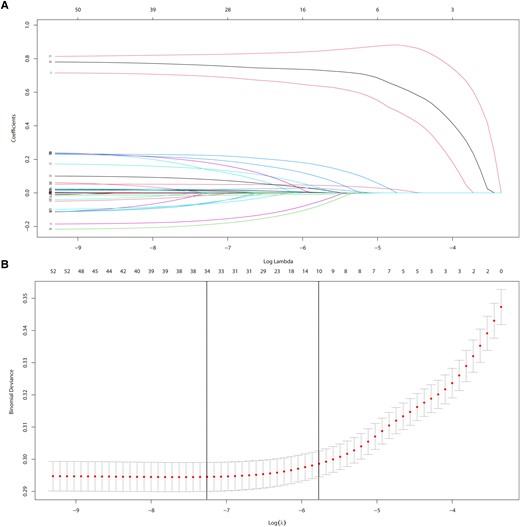
Feature selection by LASSO regression. (A) Plots for LASSO regression coefficients. (B) Cross-validation plot for the penalty term.
We compared the initial prediction performance (without model optimization) of the 6 ML algorithms based on the 10 features and found that the CatBoost algorithm presented with the best performance with an AUROC of 0.874 (Figure 2). Table 2 summarizes commonly used evaluation indicators of different ML algorithms. The CatBoost presented with the best AUROC (0.874), accuracy (0.794), sensitivity (0.710), specificity (0.849), PPV (0.755), NPV (0.818), MCC (0.566), and F1-score (0.732). The precision–recall curve showed the trade-off between precision and recall, which, in this case, means the fraction of patients who developed LTVA in the patients who were predicted to have LTVA (precision) and their fraction in all the patients who developed LTVA (recall). The comparisons of AUPR between CatBoost and other ML algorithms were conducted in the present study. The result showed that the CatBoost algorithm had the best AUPR (0.842) (see Supplementary material online, Figure S5).
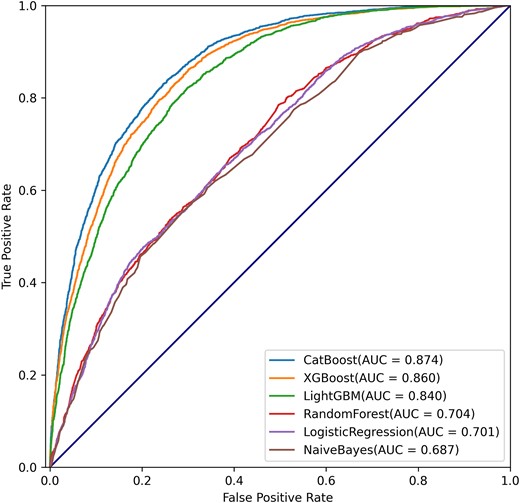
Prediction performance of different models.
Internal and external validation
| AUROC | ACC | SENS | SPEC | PPV | NPV | MCC | F1-score | |
|---|---|---|---|---|---|---|---|---|
| Internal validation | ||||||||
| ȃCatBoost | 0.874 | 0.794 | 0.710 | 0.849 | 0.755 | 0.818 | 0.566 | 0.732 |
| ȃXGBoost | 0.860 | 0.791 | 0.680 | 0.846 | 0.743 | 0.802 | 0.536 | 0.710 |
| ȃLightGBM | 0.840 | 0.757 | 0.637 | 0.835 | 0.716 | 0.778 | 0.483 | 0.674 |
| ȃRandom forest | 0.704 | 0.647 | 0.446 | 0.778 | 0.568 | 0.682 | 0.237 | 0.500 |
| ȃLogistic regression | 0.701 | 0.660 | 0.421 | 0.816 | 0.600 | 0.683 | 0.259 | 0.495 |
| ȃNaïve Bayes | 0.687 | 0.625 | 0.391 | 0.777 | 0.535 | 0.661 | 0.182 | 0.453 |
| External validation | ||||||||
| ȃCatBoost | 0.836 | 0.792 | 0.699 | 0.863 | 0.796 | 0.790 | 0.574 | 0.745 |
| ȃXGBoost | 0.817 | 0.753 | 0.662 | 0.823 | 0.741 | 0.761 | 0.493 | 0.699 |
| ȃLightGBM | 0.812 | 0.731 | 0.636 | 0.804 | 0.713 | 0.743 | 0.448 | 0.672 |
| ȃRandom forest | 0.697 | 0.617 | 0.449 | 0.746 | 0.575 | 0.639 | 0.205 | 0.504 |
| ȃLogistic regression | 0.686 | 0.624 | 0.357 | 0.817 | 0.583 | 0.639 | 0.196 | 0.443 |
| ȃNaïve Bayes | 0.679 | 0.594 | 0.325 | 0.789 | 0.527 | 0.617 | 0.129 | 0.402 |
AUROC, area under the receiver operating characteristic curve; ACC, accuracy; SENS, sensitivity; SPEC, specificity; PPV, positive prediction value; NPV, negative prediction model; MCC, Matthews correlation coefficient.
Calibration refers to the degree of agreement between the predicted probabilities and the actual probabilities, which can be evaluated both qualitatively and quantitatively. Qualitative evaluation is typically performed using calibration curves, while quantitative evaluation is often done using the Brier score. Brier score is calculated based on the Euclidean distance between the actual outcome and the predicted probability assigned to the outcome for each observation, with low values being desirable. In the present study, the prediction probability of the CatBoost model was the closest to the true probability compared with other algorithms, with a Brier score of 0.157 (see Supplementary material online, Figure S6). DCA can assess whether it is beneficial to use a model to make clinical decisions by calculating a clinical ‘net benefit’. Compared with other algorithms, the CatBoost model presented the best decision benefit (see Supplementary material online, Figure S7).
Accordingly, given the above results, the CatBoost algorithm was selected as the primary ML algorithm to perform the remaining analyses.
The HPO was applied to improve the prediction performance of the CatBoost model. After 100 trials, the optimal combination of hyper-parameters with the best prediction performance was obtained (see Supplementary material online, Figure S8). The final settings of the hyper-parameter search are listed in Supplementary material online, Table S3. The compact model, with the optimal combination of parameters, demonstrated a significantly improved discrimination ability, as indicated by the high AUROC value of 0.929 (see Supplementary material online, Figure S9).
Model evaluation and validation
To further demonstrate the performance of the final model, the ROC curve was used to predict 1-year mortality based on the CatBoost model. The result showed that the CatBoost model was also able to accurately predict in-hospital mortality in sepsis patients with an AUROC of 0.837, which further demonstrated the satisfactory prediction performance of the CatBoost model (see Supplementary material online, Figure S10). External validation was conducted in the present study to demonstrate the generalization of the CatBoost model. Data of the external validation cohort were collected from the eICU database, and only the 10 key features were included in this cohort. We found that the CatBoost model presented with the greatest prediction performance compared with other ML algorithms in the validation cohort (see Supplementary material online, Figure S11), with AUROC, accuracy, sensitivity, and specificity of 0.836, 0.792, 0.699, and 0.863, respectively (see Supplementary material online, Table S3). Therefore, we suggested that the CatBoost model had excellent robustness, reliability, and generalization ability, and could be promoted in clinical practice.
Additionally, we developed a personalized nomogram to visually present the prediction result, together with the probability of LTVA within hospitalization. We obtained the LTVA probabilities of each participant in the external cohort using the ‘predict_proba’ function of the CatBoost algorithm. Consequently, all patients in the external validation set were ranked by the prediction probability. The prediction distribution plots of the CatBoost model with patients sorted in the order of risk showed positive clustering of patients who suffered from LTVA, suggesting the favourable discriminatory ability of the model (Figure 3A). To further optimize the risk stratification, the decision tree was performed in this study. Two cut-off values of the total points of the nomogram were calculated using the decision tree algorithm (Figure 3B). Accordingly, participants were divided into three groups: low-risk (total points < 312), middle-risk (total points ≥ 312 and < 362), and high-risk groups (total points ≥ 362) (Figure 3C). The patients in the middle-risk group had about a four-fold risk of LTVA compared with the low-risk group, and the risk was eight-fold in the high-risk group, which further demonstrated the ability of risk stratification of the nomogram (Figure 3D).
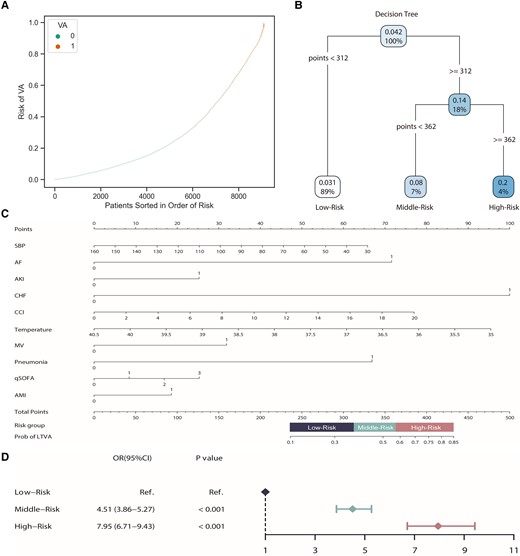
Model validation and risk stratification. (A) Prediction distributions of the risk of LTVA. (B) The risk stratification of LTVA according to a decision tree. (C) A nomogram of the CatBoost model for predicting LTVA during hospitalization in sepsis patients. (D) Logistic analysis of the risk of LTVA based on the risk stratification.
Discussion
In the present study, we built an ML-based ensemble model that enabled the accurate prediction of LTVA in patients with sepsis during hospitalization. We investigated several ML algorithms to predict LTVA and found that CatBoost presented the best performance. Temperature, SBP, CCI, qSOFA score, MV, AF, AMI, CHF, pneumonia, and AKI were selected as the key variables based on feature importance to develop the prediction model. The excellent prediction performance of the model was validated both internally and externally. The prediction model may facilitate more responsive clinical care that is beneficial for sepsis patients with high-risk LTVA through early identification.
ML algorithms
ML algorithms can facilitate information processing of complex and mass data, and make reasonable interpretations through continuous learning and training, to assist clinicians to make better medical decisions. Accordingly, in recent years, numerous ML algorithms are widely employed to develop clinical prediction models including regression and classification. In this study, we built a classification prediction model aiming to early identify sepsis patients with a high risk of LTVA during hospitalization, using six commonly used ML classification algorithms including XGBoost, LightGBM, and LR. The result showed that the CatBoost presented with the best prediction performance compared with other algorithms. CatBoost belongs to gradient boosting algorithms, can successfully handle categorical features and missing values automatically, and takes advantage of dealing with them during training instead of pre-processing time.27
Life-threatening ventricular arrhythmia predictors in sepsis
A total of 10 commonly available features were employed to build the prediction model. Predictors can be considered in three categories: (i) hospitalization information of individuals, such as CCI and qSOFA score; (ii) vital signs, such as SBP and temperature; (iii) comorbidities, such as AF, CHF, AMI, pneumonia, and AKI. The 10 predictors did not involve many laboratory tests or imagological examinations, making it easy to early identify sepsis patients with a high risk of LTVA. According to its SHAP values, with the advancing of CCI and qSOFA score, the probability of LTVA is increasing as expected, because they reflect worse general health status. A recent study has found that arrhythmias causing haemodynamic compromise were more common in the hypothermia group than in the normothermia group in patients with cardiac arrest.28 Electrolyte disturbances, fluid status, and a temperature effect on cardiac myocytes may help to explain the finding.29 Additionally, hypothermia was found highly correlated with poor outcomes in sepsis patients.30 We suggested that hypothermia was conducive to predicting LTVA in patients with sepsis which may explain the high mortality in sepsis patients with hypothermia. Pneumonia was an independent risk factor for arrhythmias and even cardiac arrest, the mechanisms may involve myocardial ischaemia, a maladaptive response to hypoxia, and sepsis-related cardiomyopathy.31 There is an intimate interaction between the heart and kidney, AKI can exacerbate heart dysfunction via volume and pressure overload and can aggravate cardiomyopathy due to uraemic toxins and acidaemia, and result in heart failure and LTVA.32 AF, CHF, and AMI, can significantly influence mechanical and electrical activity of the heart, and consequently, cause LTVA as expected.
Clinical application value
First, the CatBoost model had satisfactory prediction value with excellent discrimination and calibration. It is the determining factor for a clinical application whether a model could accurately predict target outcomes. Second, practicality is one of the main advantages of the model. The 10 features for prognosis prediction were readily accessible and frequently monitored in routine clinical practice; therefore, the model could be generalized on a large scale, especially for undeveloped regions. Third, the CatBoost model had certain interpretability. As we mentioned above, features contributing to LTVA risk prediction in this study were tangible and many of them had been proven intimately correlated with LTVA in sepsis patients. We introduced the SHAP method which can provide a visual interpretation of the optimal model at the global and the local levels.22 SHAP values of each feature for all patients were separately aggregated and averaged to investigate what features were considered important. Finally, other strengths of the CatBoost model include its generalizability and robustness. To verify whether the prediction performance of the model was consistent across the different periods, different regions, or different populations, and then to improve the credibility of the model, we performed external validation in the present study and found that the prediction performance of the CatBoost model was also excellent in the eICU database. Given the above characteristics, the CatBoost model, therefore, has great clinical application value in the early identification of sepsis patients who are at high risk of LTVA.
Future research direction
We have demonstrated that the CatBoost model could accurately predict LTVA during hospitalization in sepsis patients. Because patients who suffered from LTVA are at high risk of mortality, early identification of LTVA may be conducive to risk stratification, clinical decision-making, and improvement of prognosis in patients with sepsis. For instance, more intensive monitoring of vital signs, strict management of electrolytes including potassium and magnesium, and prophylactic anti-arrhythmic therapy before the sepsis is effectively contained should be applied to prevent LVTA in high-risk patients. Therefore, we plan to conduct a similar prospective study of prediction-based LTVA monitoring in sepsis patients to reduce LTVA and improve outcomes.
Limitations
Although we develop and validate a novel ML-based prediction model to accurately predict LTVA in sepsis patients, some limitations should be acknowledged. First, our work is based on a retrospective analysis of data, and further prospective studies are needed to confirm the findings. Second, data of this study were extracted from two public databases, and many important variables concerning LTVA were excluded for the high rate of missing values, such as cardiac troponin, brain natriuretic peptide, and left ventricular ejection fraction, which may put some effects on this model. Moreover, patients with CHF were not divided into reduced or preserved ejection fractions, and the prognosis between these patients was different. Third, treatments including antibiotics, vasoactive agents, or MV were not included in this study for inadequate data, which may provide bias. Fourth, variables for the models were collected at baseline. Implementation of dynamic changes of clinical markers is likely to improve prediction. In addition, the present analysis does not allow to conclude that the algorithm is specific for prediction of LVTA rather than a marker for overall poor outcome.
Conclusion
The CatBoost model described in the present study could accurately predict LTVA during hospitalization based on 10 commonly used features in patients with sepsis. The model was validated in another large database, and the results showed excellent prediction performance as well. The model could early identify patients at high risk of LTVA in sepsis and may improve outcomes by providing reasonable alerting and feedback.
Supplementary material
Supplementary material is available at European Heart Journal – Digital Health.
Funding
This study was supported by the Medical and Health Technology Innovation Project of Chinese Academy of Medical Sciences (2021-CXGC09-1).
Data availability
The data will be shared upon reasonable request to the corresponding author.
References
Author notes
Conflict of interest: The authors declare that they have no competing interests.
