


Abstract
This study aims to evaluate the ability of a deep-learning-based cardiovascular disease (CVD) retinal biomarker, Reti-CVD, to identify individuals with intermediate- and high-risk for CVD.
We defined the intermediate- and high-risk groups according to Pooled Cohort Equation (PCE), QRISK3, and modified Framingham Risk Score (FRS). Reti-CVD’s prediction was compared to the number of individuals identified as intermediate- and high-risk according to standard CVD risk assessment tools, and sensitivity, specificity, positive predictive value (PPV), and negative predictive value (NPV) were calculated to assess the results. In the UK Biobank, among 48 260 participants, 20 643 (42.8%) and 7192 (14.9%) were classified into the intermediate- and high-risk groups according to PCE, and QRISK3, respectively. In the Singapore Epidemiology of Eye Diseases study, among 6810 participants, 3799 (55.8%) were classified as intermediate- and high-risk group according to modified FRS. Reti-CVD identified PCE-based intermediate- and high-risk groups with a sensitivity, specificity, PPV, and NPV of 82.7%, 87.6%, 86.5%, and 84.0%, respectively. Reti-CVD identified QRISK3-based intermediate- and high-risk groups with a sensitivity, specificity, PPV, and NPV of 82.6%, 85.5%, 49.9%, and 96.6%, respectively. Reti-CVD identified intermediate- and high-risk groups according to the modified FRS with a sensitivity, specificity, PPV, and NPV of 82.1%, 80.6%, 76.4%, and 85.5%, respectively.
The retinal photograph biomarker (Reti-CVD) was able to identify individuals with intermediate and high-risk for CVD, in accordance with existing risk assessment tools.
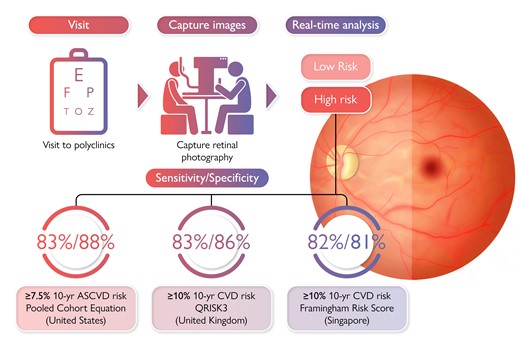
The Pooled Cohort Equation (PCE), QRISK3, and modified Framingham Risk Score (FRS) are formal risk assessment tools to guide primary prevention of cardiovascular disease in the USA, UK, and Singapore, respectively. However, these risk assessment tools require a lipid profiling via blood tests. Currently, a non-invasive cardiovascular disease (CVD) risk assessment tool is not available, particularly in stratifying those at intermediate- and high-risk. Reti-CVD is a retinal imaging biomarker developed from a deep-learning algorithm that can predict future CVD risk. In this study, we aim to evaluate the performance of Reti-CVD as a non-invasive triage tool to identify individuals with intermediate- and high-risk for CVD who can potentially benefit from early intervention. In this cross-sectional validation study, we confirmed Reti-CVD’s ability to identify individuals with intermediate- and high-risk for CVD based on their 10-year CVD risk using three different standard risk assessment tools (PCE, QRISK3, and modified FRS) with more than 80% sensitivity and specificity. Our findings demonstrate Reti-CVD’s ability to function as a non-invasive screening tool that can help triage patients according to CVD risk.
Introduction
In the USA, the population of older Americans is not only increasing, but also nearly half of US adults are expected to have cardiovascular disease (CVD) by 2035.1 An individual’s 10-year CVD risk is estimated using the Pooled Cohort Equation (PCE), which separates people into four risk categories: low (5%), borderline (5–7.4%), intermediate (7.5–19.9%), or high (≥20%).2 For individuals with intermediate-risk for CVD, it is important to consider risk-enhancing factors that may increase their actual risk for CVD.3 Such individuals often benefit the most from statin therapy.
In the UK, around one in nine people live with CVD.4 A formal risk assessment tool, QRISK3, was developed using data from a cohort of 1.28 million individuals, and it is currently recommended by the National Institute for Health and Care Excellence for CVD risk assessment.5 The current recommendation for initiating statins for primary CVD prevention and antihypertensives drugs for stage 1 hypertension is a calculated QRISK3 score of 10%.6,7 Therefore, the benchmark of 10% for 10-year CVD risk is crucial in determining clinical intervention.
The modified Framingham risk score (FRS) is a formal risk assessment tool utilized in Singapore where individuals are classified as low (<10%), intermediate (10% to 20%), or high-risk (≥20%) for CVD.8 These risk categories inform various treatment guidelines in Singapore, especially with regards to recommended LDL cholesterol levels.
These standard CVD risk assessment tools have provided physicians with a way to treat patients pre-emptively. Though each CVD risk assessment tool has its benefits and drawbacks based on the sample size, follow-up period, and number of risk factors utilized, the most concerning issue of these three CVD risk assessment tools is the fact that they all utilized a cohort of patients of Western descent. With new knowledge of the different risk factor profiles of different ethnicities, these risk assessment tools are not the most accurate for all populations.9
Deep learning comprised neural networks, which are adept at computerized visual perception and image recognition and has thrived in image-centric medical field.10 Previous studies have shown the potential of artificial intelligence in personalized CVD risk stratification. A previous study showed how machine-learning outperformed CVD risk calculator in a 13-year follow-up dataset from the Multi-Ethnic Study of Atherosclerosis.11 Other studies utilized various variables to predict and stratify CVD risk using deep-learning algorithms and showed deep-learning method was superior than conventional CVD risk calculators or machine-learning method in prediction of CVD risk, indicating that deep learning has potential to assess personalized risk more accurately.12
Many of these studies predict and stratify CVD risk using algorithms that utilize known risk factors for CVD such as age, gender, hypertension, and carotid ultrasound images. However, the retina can manifest early stages of CVD through microvascular abnormalities. Retinal photography is a simple, effective, and non-invasive imaging tool that provides fast and accurate information on the human vasculature that may not be clearly visible to the human eye especially in recent years with the advent of deep learning.13–15 In our previous study, we developed a deep-learning-based CVD risk stratification system using Reti-CVD, which allowed us to stratify future CVD risk in the UK Biobank and a diversified Asian population.16 Although Reti-CVD showed great promise in predicting future CVD risk in various ethnic groups including Koreans, Malays, Indians, Chinese, and the British,16 Reti-CVD has not been validated in identifying at-risk groups according to existing CVD risk stratification clinical guidelines.
We hypothesize that Reti-CVD can identify people with intermediate- and high-risk for CVD in accordance with three existing standard CVD risk assessment tools: PCE, QRISK3, and modified FRS. We aim to validate this hypothesis using two population-based studies from the UK and Singapore and validate Reti-CVD’s potential to be used as a non-invasive triage tool to screen individuals who can benefit from earlier preventative CVD intervention.
Methods
Ethics statement
This cross-sectional study was deemed exempt from institutional review board review by the SingHealth Centralised Institutional Review Board. This study adhered to the tenets of the Declaration of Helsinki. Written informed consent was obtained from the participants of the original studies.17,18
Study population
We used two large studies: the UK Biobank, a prospective community-based cohort in the UK,19 and Singapore Epidemiology of Eye Diseases (SEED) study, a population-based study in Singapore.20
In the UK Biobank, we excluded participants as follows: (i) with duplicated retinal photographs (n = 18 423); (ii) who had type 1 diabetes (n = 288); (iii) with pre-existing CVD at baseline (n = 7624); (iv) with poor-quality photographs (n = 11 115); and (v) who were <40 years old (n = 1) (Figure 1A). Pre-existing CVD was defined as previous history of coronary heart disease, other heart diseases, stroke, transient ischaemic attack, peripheral arterial disease, or cardiovascular surgery, and patients who have undergone cardiovascular procedures based on the Classification of Interventions and Procedures version 4.16 A total of 48 260 participants, representing the general population without a history of CVD, were included for analysis. Retinal photographs included in the study were taken using the Topcon 3D OCT-1000 Mark II (Topcon Corporation) between 2009 and 2010.
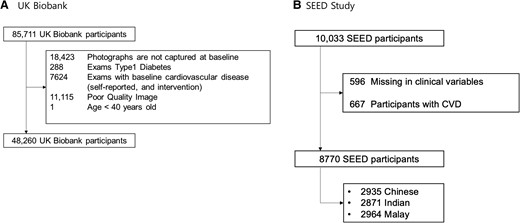
Study flowchart of (A) UK Biobank and (B) SEED Study.
In the SEED study, we excluded participants as follows: (i) with missing variables at baseline (n = 596) and (ii) with pre-existing CVD at baseline (n = 667) (Figure 1B). Pre-existing CVD was defined as previous history of cardiovascular disease. A total of 6810 participants (2548 Chinese, 1976 Indian, and 2286 Malay), representing the general population without a history of CVD, were included for analysis. Retinal photographs included in the study were taken using the Canon CR-1 Mark-II Nonmydriatic Digital Retinal Camera (Canon Corporation) between 2004 and 2011.
Definition of intermediate- and high-risk
We defined ‘intermediate- and high-risk’ as those patients whom CVD risk management may be a priority based on PCE, QRISK3, and modified FRS. For each individual in the UK Biobank, we estimated CVD risk according to the PCE, in accordance with the American College of Cardiology/American Heart Association guidelines,2 and QRISK3 score using R package.21 For each individual in SEED, the modified FRS was calculated.8 We then compared the following groups: (i) PCE-based 10-year CVD risk ≥7.5% vs. < 7.5% (i.e. intermediate- and high-risk vs. low- and borderline-risk group) and (ii) QRISK3/modified FRS-based 10-year CVD risk ≥10% vs. < 10% (i.e. intermediate- and high-risk vs. low-risk group).
New retinal-based cardiovascular disease risk stratification system
Our previous studies detail the development and validation of Reti-CVD16 Briefly, the Reti-CVD score was developed based on data from retinal photographs and CT-measured coronary artery calcium (CAC) via a deep-learning algorithm. The probability scores ranged from zero to one, with a high value indicating a higher probability of CAC presence. To generate the saliency maps, we used guided backpropagation, and aggregated analysis was done. Detailed methods and updates of Reti-CVD score were described in Supplementary material online, eDocument S1.
In the present study, we proposed binary CVD risk groups based on preliminary analysis to maximize performance in detecting the intermediate- and high-risk CVD groups in each study using the receiver operating characteristic (ROC) curve and the Youden index. We divided participants into low-risk and high-risk according to Reti-CVD scores. We used this proposed binary risk group based on Reti-CVD scores to further validate Reti-CVD’s ability to detect intermediate- and high-risk groups in each study. Detailed ROC analysis and methods were provided in Supplementary material online, eDocument S2. In addition, we used covariate-adjusted ROC analysis22 to adjust for potential covariates affecting the CVD risk in ROC analysis (see Supplementary material online, eDocument S3).
At-risk group and cardiovascular risk factors
The other variables used in this study were defined as follows. In the UK Biobank, type 2 diabetes was defined based on (i) medical history; and/or (ii) glucose ≥5.5 mmol/L. In the SEED, diabetes was defined based on (i) a random blood glucose ≥200 mg/dL (11.1 mmol/L); (ii) self-reported physician-diagnosed diabetes; (iii) glycated hemoglobin A1c (HbA1c) ≥ 6.5%; and/or (iv) use of glucose-lowering medication in the SEED.23 In both studies, individuals with high cholesterol, diabetes, and hypertension were identified through self-reporting via a baseline assessment questionnaire. Similarly, smoking status was self-reported by individuals and categorized into either ‘lifetime smoker’ or ‘never.’ Overweight was defined as body mass index of ≥30 kg/m2 in the UK Biobank and ≥25 kg/m2 in the SEED.
Statistical analysis
Descriptive statistics were provided for the study population in the UK Biobank and the SEED. Binary 2 × 2 Confusion matrix was provided in each study for the study population along with a breakdown by gender and specific at-risk groups including lifetime smokers and overweight individuals. Sensitivity, specificity, positive predictive value (PPV), and negative predictive value (NPV) were determined to evaluate Reti-CVD’s ability to detect intermediate- and high-risk groups in all participants and specific at-risk groups. In addition, ethnic-specific metrics were calculated in the SEED study. Analyses were done using P < 0.05 as the significance level, Stata/MP version 14.0. For sensitivity analysis, we repeat the analysis using SEED study on PCE-based risk groups.
Results
Table 1 details the clinical characteristics of the participants in the UK Biobank and the SEED categorized by their CVD risk according to PCE (low and borderline-risk vs. intermediate- and high-risk) QRISK3 (low vs. intermediate- and high-risk) in the UK Biobank and modified FRS in the SEED.
Characteristics of study population in UK Biobank and SEED study according to cardiovascular risk assessment tools
| Variables | UK Biobank | SEED Study | ||||
|---|---|---|---|---|---|---|
| Pooled Cohort Equation | QRISK3 | Modified Framingham Score | ||||
| Low and borderline-risk | Intermediate- and high-Risk | Low risk | Intermediate- and high-risk | Low risk | Intermediate- and high-risk | |
| Participants | 21 401 | 20 643 | 41 068 | 7192 | 4971 | 3799 |
| Reti-CVD risk groups | ||||||
| ȃLow risk | 18 738 (87.6%) | 3574 (17.3%) | 35 104 (85.5%) | 1253 (17.4%) | 4006 (80.6%) | 680 (17.9%) |
| ȃHigh risk | 2663 (12.4%) | 17 069 (82.7%) | 5964 (14.5%) | 5939 (82.6%) | 965 (19.4%) | 3119 (82.1%) |
| Age, mean (years) (SD) | 51.8 (7.1) | 61.1 (6.5) | 54.8 (7.7) | 65.8 (3.4) | 53.6 (7.8) | 63.9 (9.5) |
| Gender | ||||||
| ȃFemale, n (%) | 17 179 (80.3%) | 6199 (30.0%) | 25 129 (61.2%) | 1936 (26.9%) | 3379 (68.0%) | 1162 (30.6%) |
| ȃMale, n (%) | 4222 (19.7%) | 14 444 (70.0%) | 15 939 (38.8%) | 5256 (73.1%) | 1592 (32.0%) | 2637 (69.4%) |
| Hypertension, n (%) | 1870 (8.7%) | 5195 (25.2%) | 5081 (12.4%) | 3044 (42.3%) | 2385 (48.1%) | 3000 (79.1%) |
| Diabetes, n (%) | 197 (0.9%) | 802 (3.9%) | 681 (1.7%) | 351 (4.9%) | 1028 (20.7%) | 1467 (38.6%) |
| Lifetime smoker, n (%) | 7268 (34.0%) | 9263 (44.9%) | 14 633 (35.6%) | 4258 (59.2%) | 784 (15.8%) | 1781 (46.9%) |
| Overweight, n (%) | 4120 (19.3%) | 5424 (26.3%) | 9023 (22.0%) | 2004 (27.9%) | 2295 (46.2%) | 1988 (52.3%) |
Data are presented as n (% of participants) and mean [standard deviation (SD) ]. Intermediate and high-risk groups indicate people with ≥7.5% 10-year CVD risk according to PCE and ≥10% 10-year CVD risk according to QRISK3 in the UK Biobank, and ≥10% 10-year CVD risk according to modified Framingham Risk Score in SEED study.
CVD, cardiovascular disease; SEED, Singapore Eye Epidemiology Diseases; Reti-CVD, deep-learning-based retinal CVD imaging biomarker.
Among 48 260 included participants from the UK Biobank, 20 643 had ≥7.5% 10-year CVD risk according to PCE, and 7192 had ≥10% 10-year CVD risk according to QRISK3. Among those classified as intermediate- and high-risk, 82.7% (17 069/20 643) and 82.6% (5939/7192) belong to the high-risk group based on the Reti-CVD binary risk stratification system. Among 8770 included participants from the SEED study, 3799 had ≥10% 10-year CVD risk according to modified FRS and were classified as intermediate- and high-risk. Among these 3799 people classified as intermediate- and high-risk, 82.1% (3119/3799) belong to the high-risk group based on the Reti-CVD binary risk stratification system. In both studies, CVD risk factors such as old age, gender, hypertension, diabetes, lifetime smoking status, and being overweight were more prevalent in intermediate- and high-risk groups than in low-risk groups.
Aggregated saliency maps indicated that the highlighted area along the arcade vessels was more prominent in images of Reti-CVD high risk group than in those of Reti-CVD low risk group (see Supplementary material online, eFigure S1).
Table 2 details the number of participants classified by Reti-CVD’s binary risk groups (low vs. high) and by different standard CVD risk assessment tool’s two risk groups (low/borderline vs. intermediate and high) in all participants with a breakdown by gender. Repeated analysis according to specific at-risk factors (smoking status and overweight status) are provided in Supplementary material online, eTable S1.
Confusion matrix of Reti-cardiovascular disease risk group according to cardiovascular disease risk assessment tools
| Risk group according to CVD risk assessment tools of PCE, QRISK3, and modified FRSa | total | ||
|---|---|---|---|
| Population (risk assessment tools)/Reti-CVD Risk groups | Low risk | Intermediate- and high-risk | |
| UK Biobank (PCE) | |||
| All population | |||
| ȃLow risk | 18 738 (44.6) | 3574 (8.5) | 22 312 (53.1) |
| ȃHigh risk | 2663 (6.3) | 17 069 (40.6) | 19 732 (46.9) |
| ȃTotal | 21 401 (50.9) | 20 643 (49.1) | 42 044 (100.0) |
| Female | |||
| ȃLow risk | 14 852 (63.5) | 1163 (5.0) | 16 015 (68.5) |
| ȃHigh risk | 2327 (10.0) | 5036 (21.5) | 7363 (31.5) |
| ȃTotal | 17 179 (73.5) | 6199 (26.5) | 23 378 (100.0) |
| Male | |||
| ȃLow risk | 3886 (20.8) | 2411 (12.9) | 6297 (33.7) |
| ȃHigh risk | 336 (1.8) | 12 033 (64.5) | 12 369 (66.3) |
| ȃTotal | 4222 (22.6) | 14 444 (77.4) | 18 666 (100.0) |
| UK Biobank (QRISK3) | |||
| All population | |||
| ȃLow risk | 35 104 (72.7) | 1253 (2.6) | 36 357 (75.3) |
| ȃHigh risk | 5964 (12.4) | 5939 (12.3) | 11 903 (24.7) |
| ȃTotal | 41 068 (85.1) | 7192 (14.9) | 48 260 (100.0) |
| Female | |||
| ȃLow risk | 24 065 (88.9) | 1049 (3.9) | 25 114 (92.8) |
| ȃHigh risk | 1064 (3.9) | 887 (3.3) | 1951 (7.2) |
| ȃTotal | 25 129 (92.9) | 1936 (7.2) | 27 065 (100.0) |
| Male | |||
| ȃLow risk | 11 039 (52.1) | 204 (1.0) | 11 243 (53.1) |
| ȃHigh risk | 4900 (23.1) | 5052 (23.8) | 9952 (47.0) |
| ȃTotal | 15 939 (75.2) | 5256 (24.8) | 21 195 (100.0) |
| SEED (modified FRS) | |||
| All population | |||
| ȃLow risk | 4006 (45.7) | 680 (7.8) | 4686 (53.4) |
| ȃHigh risk | 965 (11.0) | 3119 (35.6) | 4084 (46.6) |
| ȃTotal | 4971 (56.7) | 3799 (43.3) | 8770 (100.0) |
| Female | |||
| ȃLow risk | 2878 (63.4) | 205 (4.5) | 3083 (67.9) |
| ȃHigh risk | 501 (11.0) | 957 (21.1) | 1458 (32.1) |
| ȃTotal | 3379 (74.4) | 1162 (25.6) | 4541 (100.0) |
| Male | |||
| ȃLow risk | 1128 (26.7) | 475 (11.2) | 1603 (37.9) |
| ȃHigh risk | 464 (11.0) | 2162 (51.1) | 2626 (62.1) |
| ȃTotal | 1592 (37.6) | 2637 (62.4) | 4229 (100.0) |
Intermediate- and high-risk groups indicate people with ≥7.5% 10-year ASCVD risk according to Pooled Cohort Equation in the UK Biobank; ≥ 10% 10-year CVD risk according to QRISK3 in the UK Biobank; ≥ 10% 10-year CVD risk according to modified Framingham Risk Score in the SEED study.
CVD, cardiovascular disease; SEED, Singapore Eye Epidemiology Diseases; PCE, Pooled Cohort Equation; Reti-CVD, deep-learning-based retinal CVD imaging biomarker.
Risk groups for Pooled Cohort Equation are low and borderline-risk vs. intermediate and high-risk.
Table 3 summarizes Reti-CVD’s performance in identifying intermediate- and high-risk groups (defined by the different formal CVD risk assessment tools). According to PCE and QRISK3, the overall proportion of individuals in the UK Biobank categorized as intermediate- and high-risk was 49.0% and 15.0%, respectively. Reti-CVD identified PCE-based intermediate- and high-risk groups with a sensitivity, specificity, PPV, and NPV of 82.7%, 87.6%, 86.5%, and 84.0%, respectively. Reti-CVD identified QRISK3-based intermediate- and high-risk groups with a sensitivity, specificity, PPV, and NPV of 82.6%, 85.5%, 49.9%, and 96.6%, respectively. In the SEED study, the overall prevalence of people classified as intermediate- and high-risk was 43.0%. Reti-CVD identified intermediate- and high-risk groups according to the modified FRS with a sensitivity, specificity, PPV, and NPV of 82.1%, 80.6%, 76.4%, and 85.5%, respectively. Repeated analysis according to specific at-risk groups (lifetime smoking status and overweight status) and age are provided in Supplementary material online, eTables S2 and S3.
Performance of Reti-cardiovascular disease in identifying intermediate- and high-risk individuals by gender
| Population (risk assessment tools)/metrics | All participants | Female | Male |
|---|---|---|---|
| UK Biobank (PCE) | |||
| ȃPrevalence | 49.0% (49.0–49.6%) | 27.0% (26.0–27.1%) | 77.0% (77.0–78.0%) |
| ȃSensitivity | 82.7% (82.2–83.2%) | 81.2% (80.2–82.2%) | 83.3% (82.7–83.9%) |
| Specificity | 87.6% (87.1–88.0%) | 86.5% (85.9–87.0%) | 92.0% (91.2–92.8%) |
| ȃPPV | 86.5% (86.0–87.0%) | 68.4% (67.3–69.5%) | 97.3% (97.0–97.6%) |
| NPV | 84.0% (83.5–84.5%) | 92.7% (92.3–93.1%) | 61.7% (60.5–62.9%) |
| UK Biobank (QRISK3) | |||
| ȃPrevalence | 15.0% (15.0–15.2%) | 7.2% (6.8–7.5%) | 25.0% (24.0–25.4%) |
| Sensitivity | 82.6% (81.7–83.4%) | 45.8% (43.6–48.1%) | 96.1% (95.6–96.6%) |
| ȃSpecificity | 85.5% (85.1–85.8%) | 95.8% (95.5–96.0%) | 69.3% (68.5–70.0%) |
| ȃPPV | 49.9% (49.0–50.8%) | 45.5% (43.2–47.7%) | 50.8% (49.8–51.8%) |
| ȃNPV | 96.6% (96.4–96.7%) | 95.8% (95.6–96.1%) | 98.2% (97.9–98.4%) |
| SEED (modified FRS) | |||
| ȃPrevalence | 43.0% (42.0–44.4%) | 26.0% (24.0–26.9%) | 62.0% (61.0–63.8%) |
| ȃSensitivity | 82.1% (80.8–83.3%) | 82.4% (80.0–84.5%) | 82.0% (80.5–83.4%) |
| ȃSpecificity | 80.6% (79.5–81.7%) | 85.2% (83.9–86.4%) | 70.9% (68.6–73.1%) |
| ȃPPV | 76.4% (75.0–77.7%) | 65.6% (63.1–68.1%) | 82.3% (80.8–83.8%) |
| ȃNPV | 85.5% (84.4–86.5%) | 93.4% (92.4–94.2%) | 70.4% (68.1–72.6%) |
CVD; cardiovascular disease; SEED; Singapore Eye Epidemiology Diseases; Reti-CVD; deep-learning-based retinal CVD imaging biomarker; PCE; Pooled Cohort Equation; PPV; positive predictive value; NPV; negative predictive value.
Table 4 summarizes Reti-CVD’s performance in identifying intermediate- and high-risk groups (defined by the different formal CVD risk assessment tools) in each ethnic group from the SEED study. The prevalence of intermediate- and high-risk groups was 26.0% in Singaporean Chinese, 56.0% in Singaporean Indian, and 48.0% in Singaporean Malay. Sensitivity of Reti-CVD in identifying intermediate- and high-risk groups was 79.7% in Singaporean Chinese, 83.2% in Singaporean Indian, and 82.1% in Singaporean Malay. The NPV of Reti-CVD in identifying intermediate- and high-risk groups was especially high with 99.3% in Singaporean Chinese females. Repeated analysis according to specific at-risk groups (lifetime smoking status and overweight status) is provided in Supplementary material online, eTable S4.
Performance of Reti-cardiovascular disease in identifying intermediate- and high-risk groups according to modified framingham risk score in different ethnicities in the SEED study
| Population/metrics | All participants | Female | Male |
|---|---|---|---|
| Chinese | |||
| ȃPrevalence | 26.0% (24.0–27.1%) | 6.8% (5.6–8.2%) | 45.0% (43.0–47.7%) |
| ȃSensitivity | 79.7% (76.6–82.5%) | 92.2% (85.1–96.6%) | 77.7% (74.3–80.9%) |
| ȃSpecificity | 78.5% (76.7–80.2%) | 84.3% (82.3–86.2%) | 68.0% (64.6–71.2%) |
| ȃPPV | 55.9% (52.9–58.9%) | 30.0% (25.0–35.4%) | 66.6% (63.1–70.0%) |
| ȃNPV | 91.9% (90.5–93.1%) | 99.3% (98.7–99.7%) | 78.8% (75.5–81.8%) |
| Indian | |||
| ȃPrevalence | 56.0% (55.0–58.3%) | 38.0%(35.0–40.1%) | 76.0%(74.0–78.6%) |
| ȃSensitivity | 83.2% (81.3–85.0%) | 81.0% (77.5–84.2%) | 84.3% (82.0–86.4%) |
| ȃSpecificity | 78.6% (76.2–80.9%) | 83.1% (80.6–85.5%) | 66.1% (60.7–71.2%) |
| ȃPPV | 83.5% (81.6–85.3%) | 74.3% (70.6–77.7%) | 88.9% (86.8–90.8%) |
| ȃNPV | 78.2% (75.9–80.5%) | 87.9% (85.6–90.0%) | 56.5% (51.4–61.5%) |
| Malay | |||
| ȃPrevalence | 48.0% (46.0–50.0%) | 32.0% (30.0–34.7%) | 66.0% (63.0–68.5%) |
| ȃSensitivity | 82.1% (80.1–84.1%) | 81.9% (78.2–85.1%) | 82.3% (79.7–84.7%) |
| ȃSpecificity | 85.2% (83.3–87.0%) | 88.0% (85.9–89.9%) | 78.9% (75.0–82.5%) |
| ȃPPV | 83.8% (81.7–85.7%) | 76.6% (72.8–80.1%) | 88.3% (86.0–90.4%) |
| ȃNPV | 83.7% (81.8–85.5%) | 91.0% (89.1–92.7%) | 69.7% (65.6–73.6%) |
CVD; cardiovascular disease; SEED; Singapore Eye Epidemiology Diseases; Reti-CVD; deep-learning-based retinal CVD imaging biomarker; PPV; positive predictive value; NPV; negative predictive value.
Sensitivity analyses that applied PCE-risk group on SEED study also showed results similar to those of the main analysis (see Supplementary material online, eTables S5 and S6).
Discussion
In this study, we used Reti-CVD to identify individuals at intermediate- and high-risk for CVD according to PCE (10-year CVD risk ≥7.5%) and QRISK3/modified FRS (10-year CVD risk ≥10%) in the UK and Singapore. The retinal imaging CVD biomarker, Reti-CVD, adequately identified individuals of PCE-based intermediate- and high-risk with a sensitivity of 82.7% in the UK Biobank, individuals of QRISK3-based intermediate- and high-risk with a sensitivity of 82.6% in the UK Biobank, and individuals of modified FRS-based intermediate- and high-risk with a sensitivity of 79.7% in Chinese, 83.2% in Indian, and 82.1% in Malay in Singapore.
First, Reti-CVD can increase CVD risk screenings and make the process more efficient. By identifying high-risk patients earlier and encouraging patients to undergo a full health check-up for further evaluation, Reti-CVD can support national health screening programs such as the ‘UK NHS Health Check’ and ‘Singapore Screen for Life.’ In the UK, this could potentially boost the compliance rate for NHS health screening, which has been estimated to be less than 50%.24 Moreover, the non-invasive nature of Reti-CVD can further promote public screening compliance as it avoids the need for patients to undergo the use of needles for fasting glucose and lipid levels for routine labs. This would encourage previously reluctant patients who have trypanophobia to seek health screening examinations. Given the large delays in phlebotomy due to resource limitations from lack of trained personnel to insufficient equipment, Reti-CVD provides another accurate way to assess CVD risk in an expedited fashion. Furthermore, the non-invasive nature of Reti-CVD would be more cost-effective for patients as it simply requires an image of the retina that requires minimal personnel. Of note, these retinal cameras already exist in many optometric offices that can be incorporated into pre-existing healthcare system to further offset the high initial investment.
Second, as Reti-CVD is an imaging biomarker that can be obtained on routine eye examinations, the opportunistic nature of this CVD risk screening may help include ‘hard to reach’ populations in CVD risk assessment. For example, the convenience of accessing Reti-CVD in neighbourhood optical shops could increase participation rates and complement the sub-optimal NHS Health Check participation rate.24 This makes Reti-CVD compatible for use in many parts of the UK that are currently providing various ophthalmic services (e.g. NHS Sight Test providers, acute eye clinics, diabetic retinopathy screening programs, etc.) In fact, vision loss is highly correlated with social determinants of health.25 In vulnerable populations, these ‘hard to reach’ patients can be accessed more routinely by optometrist as these patients are more likely to seek ophthalmic care for glasses and vision concerns. Furthermore, third, since Reti-CVD simply requires an image of the retina, this opportunistic CVD screening can be utilized to retrospectively screen the general public using stored retinal photographs. Moreover, in an era where telemedicine is becoming the standard of care, especially with the COVID-19 pandemic, this retrospective CVD screening in conjunction with telemedicine could improve patient care. For example, patients could transmit their latest Reti-CVD results during televisits to physicians who can use this information to guide patients on whether or not to seek a more detailed CVD risk assessment. With such easily accessible screening opportunities, healthcare professionals can promote a paradigm shift in healthcare from one that focuses on disease treatment to one that focuses on preventative measures such as Life’s Essential 8 and American Heart Association’s recent guidelines.26 By identifying patients with CVD risk through the retina, patients can be treated pre-emptively for CVD with statins. Studies have demonstrated how statin use reduces the risk of CVD events when patients have an elevated 10-year CVD risk.27 Moreover, depending on patient-specific risk factors, physicians can address these risk factors through lifestyle modifications and medications for hypertension and diabetes. Additional research on trends by comparing older and more recent retinal scans will add another layer of predictive power to our AI algorithm, which would enhance its ability to evaluate CVD risk.
Fourth, given Reti-CVD’s ability to predict future CVD risk in the UK Biobank and diverse Asian populations, adults who are high-risk according to Reti-CVD but have <10% CVD risk according to formal risk assessment tools (i.e. false positive) could obtain life-saving early interventions, which may be extremely cost-effective for providers and patients since tertiary prevention of CVD is significantly more expensive than primary and secondary prevention of CVD.16 In our explorative analysis using QRISK3, the CVD incidence was 8.6 per 1000 person-years in this false positive group, which is more than double compared to adults who are low-risk according to Reti-CVD and have <10% CVD risk according to formal risk assessment tools (3.3 per 1000 person-years) in the UK Biobank. Reti-CVD has the potential to serve as a highly desirable risk detector that is non-invasive, scalable, and specific.
The strengths of this study demonstrate the efficacy of deep-learning-based imaging biomarkers in accordance with current clinical guidelines of standard CVD risk assessment tools by using large-scale population-based studies in two different countries. Moreover, this study also demonstrates the potential of using the retina to assess CVD risk thereby opening many possibilities in addressing CVD preventatively by creating another potential cost-effective office-based test for patients as noted above. However, since Reti-CVD is based on a deep-learning algorithm, there are inherent limitations to be aware of. Due to the nature of testing and training deep-learning algorithms through datasets, the accuracy of Reti-CVD scores is dependent upon the dataset that was used to train the algorithm and open to biases that occur while compiling the dataset. As we excluded those who had missing clinical variables, if the 10-year CVD risk of excluded individuals differs significantly form those included, it may affect the actual performance of Reti-CVD score. Moreover, many datasets stem from voluntary studies that often attract an accessible population that is not always generalizable. Therefore, Reti-CVD must be used with caution when applying it to new sub-populations or across different ethnicities. Thus, Reti-CVD scores used in this study may not be applicable globally. Moving forward, it is always possible to find more optimal Reti-CVD cut-off values for different populations, especially if there exist population-based eye studies, including retinal photographs and blood tests. To further validate Reti-CVD and decrease potential bias, we hope to evaluate Reti-CVD using cohort studies in other countries such as the USA in the future. The effectiveness of Reti-CVD among those with eye disease was not extensively evaluated. In our explorative analysis, we confirmed there were no differences in area under ROC curve (AUCs) between those without cataract and with cataract in SEED study (AUCs, 0.824 and 0.817, respectively, P = 0.568). In addition, it has been acknowledged that other risk factors such as age and/or gender can affect test outcomes in AUCs. Thus, we provided covariate-adjusted AUCs in the supplementary materials online, eDocument S3. Moreover, we excluded poor quality images during the development and validation of Reti-CVD. The quality of retinal photographs in clinical settings may vary and may pose challenges for real-world implementation. Though completely replacing traditional means of assessing CVD risk through current standard risk assessment models with Reti-CVD may be premature, this study demonstrates the potential of deep-learning in assessing CVD risk.
In conclusion, a new deep-learning and retinal photograph-derived CVD biomarker, Reti-CVD, could effectively identify individuals with intermediate- and high-risk for CVD in accordance with different national guidelines. As a CVD risk triage tool, Reti-CVD has the potential to not only make CVD risk assessment more affordable and accessible, but also benefit patients through early interventions and awareness.
Supplementary material
Supplementary material is available at European Heart Journal—Digital Health online.
Author contributions
T.H.R. conceptualized the study. H.K. and G.L. developed the algorithm. J.K.Y. and T.H.R. wrote the manuscript and researched its contents. All authors provided comments to improve the manuscript. A.B. verified the dataset.
Funding
This project is supported by the Agency for Science, Technology and Research (A*STAR) under its RIE2020 Health and Biomedical Sciences (HBMS) Industry Alignment Fund Pre-Positioning (IAF-PP) Grant No. H20c6a0031. Any opinions, findings, and conclusions or recommendations expressed in this material are those of the author(s) and do not reflect the views of the A*STAR.
Data availability
The UK Biobank test dataset was obtained from UK Biobank (application number 68 428). Data cannot be shared publicly due to the violation of patient privacy and the absence of informed consent for data sharing. Data from Singapore are available to researchers who meet the criteria for access to confidential data; requests should be made to Prof. Ching-yu Cheng ([email protected]).
References
Author notes
Joseph Keunhong Yi and Tyler Hyungtaek Rim Contributed equally.
Calvin W L Chin and Ching-Yu Cheng Contributed equally as the last author.
Conflict of interest: T.H.R, H.K., and G.L. are employees of Mediwhale Inc. T.H.R. and G.L. own stock of Mediwhale Inc., and hold the following patents that might be affected by this study: 10–2018–0166720(KR), 10–2018–0166721(KR), 10–2018–0166722(KR), and 62/694,901(US), 62/715729(US), 62/776345(US). S.P. received honorarias from Pfizer, Boryoung Pharmaceutical, Hanmi Pharmaceutical, Daewoong Pharmaceutical, Donga Pharmaceutical, Celltrion, Servier, Daiichi Sankyo, and Daewon. S.P. also received a research grant from Daiichi Sankyo and participated in Celltrion’s advisory board meetings. C.J.L. received honorarias from Yuhan Corporation, Boryung Pharmaceutical, Novartis, Boehringer Ingelheim, Hanmi Pharmaceutical, and Daewoong Pharmaceutical. C.J.L. also has a National Research Foundation of Korea grant (2020R1C1C1013627). E.S.’s institution, University of Liverpool, was paid a consulting fee unrelated to this study and publication from Mediwhale. C.Y.Y. was a consultant to Mediwhale Inc. All other authors declare no competing interests.
