


Abstract
The incremental usefulness of circulating biomarkers from different pathological pathways for predicting mortality has not been evaluated in acute Type A aortic dissection (ATAAD) patients. We aim to develop a risk prediction model and investigate the impact of arch repair strategy on mortality based on distinct risk stratifications.
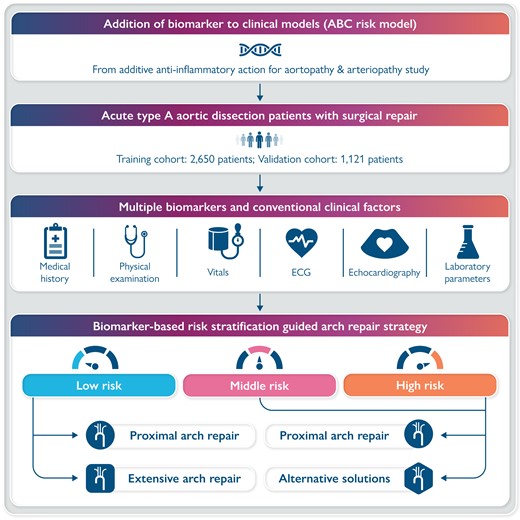
A total of 3771 ATAAD patients who underwent aortic surgery retrospectively included were randomly divided into training and testing cohorts at a ratio of 7:3 for the development and validation of the risk model based on multiple circulating biomarkers and conventional clinical factors. Extreme gradient boosting was used to generate the risk models. Subgroup analyses were performed by risk stratifications (low vs. middle–high risk) and arch repair strategies (proximal vs. extensive arch repair). Addition of multiple biomarkers to a model with conventional factors fitted an ABC risk model consisting of platelet–leucocyte ratio, mean arterial pressure, albumin, age, creatinine, creatine kinase-MB, haemoglobin, lactate, left ventricular end-diastolic dimension, urea nitrogen, and aspartate aminotransferase, with adequate discrimination ability {area under the receiver operating characteristic curve (AUROC): 0.930 [95% confidence interval (CI) 0.906–0.954] and 0.954, 95% CI (0.930–0.977) in the derivation and validation cohort, respectively}. Compared with proximal arch repair, the extensive repair was associated with similar mortality risk among patients at low risk [odds ratio (OR) 1.838, 95% CI (0.559–6.038); P = 0.316], but associated with higher mortality risk among patients at middle–high risk [OR 2.007, 95% CI (1.460–2.757); P < 0.0001].
In ATAAD patients, the simultaneous addition of circulating biomarkers of inflammatory, cardiac, hepatic, renal, and metabolic abnormalities substantially improved risk stratification and individualized arch repair strategy.
Introduction
Acute Type A aortic dissection (ATAAD), the most serious manifestation of the acute aortic syndrome, represents the major cause of morbidity and mortality worldwide.1 Because of the heterogeneity of this patient population and aortic disease severity, a wide range of mortality risk estimates has been reported, and an appropriate surgery strategy remains controversial.2 Consequently, patients with ATAAD may differ in the magnitude of absolute benefit received from treatment strategies, such as open surgical, endovascular, and hybrid repair.3 To appropriately tailor the intensity of existing treatments, there is a need for implementing risk stratification instruments in patients with ATAAD.4
Although clinically used risk algorithms, such as additive and logistic EuroSCORE, Parsonnet score, the Cleveland score, Ontario Province Risk (OPR) score, SinoSCORE have been developed for mortality prediction in the cardiovascular setting,5–10 there was no specific guideline-recommended risk prediction tool to date for ATAAD. Recently, two risk models were developed to predict the early mortality for patients undergoing surgery for ATAAD on the basis of the international registry for ATAAD data,11,12 mainly consisting of clinical variables and yield acceptable discrimination for mortality. However, the two scores were developed based on international clinical practices in the management of ATAAD, which has not yet been validated in a large Chinese ATAAD patient population.
It has been suggested that biomarkers that reflect myocardial cell damage, hepatic injury, renal failure, metabolic disorders, and inflammation are associated with mortality and morbidity in aortic dissection.13 During the recent decades, circulating biomarkers have been increasingly recognized to provide objective and accurate information with prognostic significance in the wake of deeper insights into the pathophysiology of cardiovascular diseases.14,15 Despite the accumulated evidence in the literature, the routine measurement of these biomarkers for prognostic purposes is not recommended by the European Society of Cardiology (ESC)2 and American Association for Thoracic Surgery (AATS) guidelines.16 Moreover, it is less clear whether these candidate biomarkers provide additional information when they are integrated with a risk prediction model for cardiovascular events in the Chinese ATAAD patient population.
The aims of this study were to develop and validate a useful risk prediction model using clinical variables and biomarkers, and to investigate whether the biomarker-based risk stratification could individualize the arch repair strategy in ATAAD surgery.
Methods
Study design
Additive Anti-inflammatory Action for Aortopathy & Arteriopathy (5A) was a multicenter registry study in which eligible patients with aortic dissection were consecutively enrolled at 13 cardiovascular centers across China. The 5A study aimed to characterize the inflammatory response, and initiate an additive anti-inflammatory action for patients with aortopathy or arteriopathy. For the risk model of mortality, we retrospectively analyzed patients with ATAAD from the 5A cohort, in which patients were randomly divided into a training set (70% of patients) and a testing set (30%). The 5A study was approved by the research ethics committee of all collaborating hospitals (2021-SR-381). The study complied with the Declaration of Helsinki. This study was registered with Clinical Trials. Gov number NCT04918108. Informed consent was waived for this retrospectively observational study, the data have been analyzed anonymously, and all personal information of the participants was confidential.
Study population
Patients with ATAAD undergoing open surgical repair at an age of 18 years or above were included in the 5A registry between January 2016 and July 2021. Aortic dissection is classified according to the Stanford system: Type A involves the ascending aorta, regardless of the site of the primary intimal tear, and Type B involves only the descending aorta. Acute aortic dissection is defined as ≤14 days from symptom to diagnosis. Exclusion criteria included Type B aortic dissection, recurrent aortic dissection, and onset time of >14 days. This study adheres to the Transparent Reporting of a Multivariable Prediction Model for Individual Prognosis or Diagnosis (TRIPOD) reporting guideline for diagnostic and prognostic studies.17
Variables and measure
We collected the baseline clinical data including demographic characteristics, risk factors and medical history, laboratory test profiles, echocardiography and computed tomography angiography recordings, and procedural variables. For each variable, we extracted the most abnormal value recorded within the first 6 h of hospital presentation before surgery. The central laboratories of participating hospitals in this registry were all certified by the China National Accreditation Service for Conformity Assessment of Laboratory, which allows the accuracy and standardization of all laboratory test data for each measurement.
Outcomes
The primary outcome was operative mortality, defined as any death, regardless of cause, occurring within 30 days after surgery in or out of the hospital, and after 30 days during the same hospitalization subsequent to the operation according to the Society of Thoracic Surgeons criteria.18 Secondary outcomes included the mechanical ventilation duration, intensive care unit (ICU) length of stay, and hospital length of stay. All outcomes were adjudicated independently by an event collaborative team.
Algorithm
The extreme Gradient Boosting (XGBoost) algorithm, a modern implementation of gradient boosting decision trees, was selected to develop a risk model in this study, as designed for speed, performance, and managing missing data points.19 To tackle the significant class imbalance, a loss weighting was applied. The loss of the entity with fewer samples (in this study the occurrence of operative death) was weighted higher than the dominant entities (no operative death).20 A feature importance was calculated to supporta deeper understanding of the algorithm’s predictions and give insight into the data.
We first generated a clinical model using the XGBoost algorithm based on the candidate clinical variables a priori as those which appear in any of the existing clinical scores for mortality prediction, namely the additive and logistic EuroSCORE, the Parsonnet score, the Cleveland score, OPR score, SinoSCORE, IRAD score, and GERAADA score.5–12
To assess the additive contribution of biomarkers, we added the candidate biomarker into the clinical model to develop a biomarker-based risk model (full-risk model). We calculated the net reclassification improvement index (NRI) and integrated the discrimination improvement index (IDI), which measures the improvement in predictive performance gained by the addition of the biomarker to the clinical risk model.21 Recursive feature elimination was performed to limit the necessary number of features for the application of the final risk score to a minimum.22 At last, we selected the top six features of impotence to develop the final risk model (simple risk model). As an exploratory analysis, we examined the functional relationships of the top feature of importance as a continuous scale with mortality in the final risk model using restricted cubic splines.
Model assessment and validation
Discrimination, calibration, and clinical decision curve were calculated to assess the performance of these risk models in the development and validation cohort, compared with the currently existing risk scores (additive and logistic EuroSCORE, Parsonnet score, the Cleveland score, OPR score, SinoSCORE, IRAD score, and GERAADA score).5–12 Discrimination was assessed by area under the receiver operating characteristic curve (AUROC), for comparison of which between the models followed the method of DeLong et al.23 Calibration was assessed by Nagelkerke’s R2,24 by the Brier score (defined as the mean squared difference between the observed and the predicted outcome25), and by calibration curve (plotting the predicted vs. observed rate of operative mortality).26,27 To evaluate clinical utility, we performed a decision curve analysis by estimating the net benefit of the final risk model to stratify patients relative to assuming that no patient will have an event according to a continuum of decision thresholds of risk for mortality.28,29
Besides, considering the extremely low incidence of the outcome in our data set, we plotted the area under the precision-recall curve (AUPRC), graphing precision (positive predictive value) on the y-axis against recall (sensitivity) on the x-axis with the baseline being the percentage of true positives in the data set.20–32 For handling class-imbalanced data in tuning the model parameters, which more correctly reflects the ability of the model to identify true positives than the AUROC does.
Additional analysis
Patients with predicted risk thresholds of <5%, 5–10%, and > 10% were grouped into low-, middle-, and high-risk categories in the development cohort, respectively. The probability of mortality was calculated in each risk category and odds ratios (ORs) were assessed by logistic regression. Subgroup analyses were performed by risk stratifications (low vs. middle–high risk) and arch repair strategies (proximal vs. extensive arch repair).
Statistical analysis
The continuous data were presented as median [interquartile ranges (IQRs)] depending on the nature of variable and the categorical data were reported as percentages (%). Logistic regression was used to investigate the association of potential variables with mortality by OR with 95% confidence interval (CI). Missing data were assumed to be missing at random and were imputed using multiple imputations of chained equations. Based on the proportion of incomplete cases, we determined that 5 imputed datasets and 10 iterations were needed to minimize the simulation error (Monte Carlo).33 All statistical analyses were performed using R, version 3.6.1 (R Foundation for Statistical Computing).
Results
Patient characteristics and outcomes
A total of 3771 patients with ATAAD were included for final analysis: 2650 patients were randomly assigned to the derivation cohort for model training, and 1121 patients were assigned to the validation cohort for model testing. The flowchart of patient recruitment is provided in Supplementary material online, Figure S1. Baseline demographic, clinical, and procedural characteristics and perioperative outcomes among cohorts are summarized in Tables 1 and 2.
Baseline and clinical characteristics and perioperative outcomes of three cohorts
| Derivation cohort (n = 2650) | Available data | Validation cohort (n = 1121) | Available data | |
|---|---|---|---|---|
| Demographic characteristics | ||||
| Age (year) | 50 (40–58) | 2650 | 53 (43–62) | 1121 |
| Sex (male) | 1993 (75.2%) | 2650 | 838 (74.8%) | 1121 |
| Height (cm) | 172 (166.0–176.0) | 2650 | 171.0 (165–176) | 1121 |
| Weight (kg) | 75 (65–85) | 2650 | 75 (66–82) | 1121 |
| Body mass index (kg/m2) | 25.4 (23.0–27.8) | 2650 | 25.3 (23.1–27.7) | 1121 |
| Clinical characteristics | ||||
| Time from onset to operation (days) | 1 (1–2) | 2650 | 1 (1–2) | 1121 |
| Heart rate (b.p.m.) | 80 (75–86) | 2642 | 80 (76–88) | 1120 |
| Systolic blood pressure (mmHg) | 130 (120–140) | 2642 | 130 (120–140) | 1120 |
| Diastolic blood pressure (mmHg) | 75 (67.0–80.0) | 2642 | 74 (65–81) | 1120 |
| Mean blood pressure (mmHg) | 93 (85–99) | 2642 | 92 (85–100) | 1120 |
| Smoking (%) | 1162 (44.5%) | 2311 | 414 (38.2%) | 1085 |
| Drinking (%) | 2005 (78.2%) | 2563 | 203 (19.2%) | 1055 |
| Chronic lung disease (%) | 55 (2.1%) | 2641 | 46 (4.1%) | 1121 |
| Coronary heart disease (%) | 228 (8.6%) | 2647 | 158 (14.1%) | 1121 |
| Hypertension (%) | 1913 (72.8%) | 2626 | 777 (69.4%) | 1121 |
| Diabetes (%) | 141 (5.3%) | 2650 | 55 (4.9%) | 1121 |
| Arrhythmias (%) | 66 (2.5%) | 2634 | 47 (4.2%) | 1121 |
| Congestive heart failure (%) | 16 (0.6%) | 2638 | 2 (0.2%) | |
| Previous cardiac surgery (%) | 363 (13.7%) | 2650 | 156 (13.9%) | 1121 |
| Crisis state (%) | 84 (3.2%) | 2634 | 28 (2.5%) | 1121 |
| Dissection characteristics | ||||
| Malperfusiona (%) | 891 (33.6%) | 2650 | 228 (20.3%) | 1121 |
| Spinal | 19 (0.7%) | 1 (0.1%) | ||
| Renal | 358 (13.5%) | 162 (14.5%) | ||
| Intestinal | 82 (3.1%) | 8 (0.7%) | ||
| Limb | 225 (8.5%) | 62 (5.5%) | ||
| Cerebral | 279 (10.6%) | 87 (7.8%) | ||
| Coronary | 498 (18.9%) | 104 (9.3%) | ||
| Involvement of descending aorta (%) | 1475 (55.7%) | 2650 | 463 (41.3%) | 1121 |
| Thrombosis of the false lumen (%) | 526 (24.5%) | 2145 | 214 (21.5%) | 993 |
| Circulation characteristics | ||||
| Pericardial tamponade (%) | 220 (8.9%) | 2467 | 78 (7.0%) | 1111 |
| Aortic regurgitation (%) | 2465 | 1109 | ||
| Mild | 816 (33.1%) | 347 (31.3%) | ||
| Moderate | 340 (13.8%) | 138 (12.4%) | ||
| Severe | 500 (20.3%) | 271 (24.4%) | ||
| Pericardial effusion (%) | 2629 | 1121 | ||
| Mild | 262 (10.0%) | 43 (3.8%) | ||
| Moderate | 54 (2.1%) | 15 (1.3%) | ||
| Severe | 25 (1.0%) | 10 (0.9%) | ||
| LVEF (%) | 62 (59–66) | 2436 | 62 (59–65) | 1103 |
| LVEDD (mm) | 50 (46–55) | 2436 | 50 (46–55) | 1103 |
| Shock (%) | 39 (1.5%) | 2949 | 9 (0.8%) | 1121 |
| Biomarkers | ||||
| Leucocyte (×109/L) | 8.7 (6.3–12.1) | 2650 | 7.7 (5.9–10.8) | 1121 |
| Platelet (×109/L) | 193 (156–235) | 2650 | 197 (160–242) | 1121 |
| Haemoglobin (g/L) | 138.0 (126–149) | 2629 | 139 (126–150) | 1116 |
| Creatine kinase-MB (ng/mL) | 1.2 (0.7–2.3) | 2596 | 1.4 (0.8–2.3) | 1113 |
| Lactic dehydrogenase (µ/L) | 196 (164–240) | 1869 | 190 (162–233) | 1028 |
| Lactic acid (mmol/L) | 1.4 (1.0–1.9) | 2353 | 1.4 (1.1–1.9) | 994 |
| Alanine transaminase (µ/L) | 20 (14–31) | 2630 | 18 (12–27) | 1115 |
| Aspartate aminotransferase (µ/L) | 20 (16–27) | 2630 | 18 (15–24) | 1115 |
| Albumin (g/L) | 40.2 (37.0–43.0) | 2564 | 41.3 (38.0–44.1) | 1115 |
| Urea nitrogen (mmol/L) | 6.0 (4.7–7.5) | 2606 | 5.7 (4.6–7.1) | 1114 |
| Creatinine (μmol/L) | 75.0 (62.9–91.3) | 2624 | 74.8 (62.7–87.6) | 1114 |
| Platelet–leucocyte ratio | 22.6 (14.3–33.5) | 2650 | 26.8 (16.2–36.9) | 1121 |
Data are n (%) or median (IQR), unless otherwise specified.
LVEDD, left ventricular end-diastolic dimension; LVEF, left ventricular ejection fraction; IQR, interquartile range.
Defined as one of the following conditions: coronary, renal, cerebral, spinal, intestinal, and limb malperfusion.
Procedural characteristics and perioperative outcomes of derivation and validation cohorts
| Derivation cohort | Validation cohort | |
|---|---|---|
| Procedural variables | ||
| Aortic valve replacement (%) | 75 (2.8%) | 73 (6.5%) |
| Bentall (%) | 966 (36.5%) | 432 (38.5%) |
| David (%) | 43 (1.6%) | 10 (0.9%) |
| Total arch replacement + FET implantation (%) | 1347 (50.8%) | 392 (35.0%) |
| Hemi-arch replacement (%) | 310 (11.7%) | 144 (12.8%) |
| Total arch replacement (%) | 1373 (51.8%) | 396 (35.3%) |
| Inclusion technique (%) | 1935 (73.0%) | 653 (58.3%) |
| Concomitant CABG (%) | 200 (7.5%) | 127 (11.3%) |
| Concomitant valve surgery (%) | 120 (4.5%) | 63 (5.6%) |
| Cardiopulmonary bypass time (min) | 173 (138–208) | 163 (129–199) |
| Aortic cross-clamp time (min) | 99 (78–123) | 97 (74–124) |
| Circulatory arrest of lower body (%) | 1802 (68.2%) | 561 (50.0%) |
| Circulatory arrest time (min) | 23 (18–30) | 23 (17–30) |
| Perioperative outcomes | ||
| Operative mortality (%) | 156 (5.9%) | 98 (8.7%) |
| 30-day mortality (%) | 141 (5.3%) | 87 (7.8%) |
| Mechanical ventilation time (h) | 18 (14–37) | 20 (16–41) |
| ICU stay (h) | 32 (19–65) | 24 (19–63) |
| Hospital stay (days) | 15 (11–21) | 18 (13–26) |
Data are n (%) or median (IQR), unless otherwise specified.
FET, frozen elephant trunk; CABG, coronary artery bypass grafting; ICU, intensive care unit; IQR, interquartile range.
Model development and assessment
Based on the candidate clinical variables, we developed a clinical risk model, which achieved an AUROC of 0.882 (95% CI 0.851–0.913) and a specificity of 0.865, and a sensitivity of 0.763 (Figure 2A). Its AUPRC was 0.514, which showed improvement in mortality prediction compared with a model with no predictive value (which would have a baseline AUPRC of 0.059, the incidence of mortality in the derivation set) (Figure 2C).
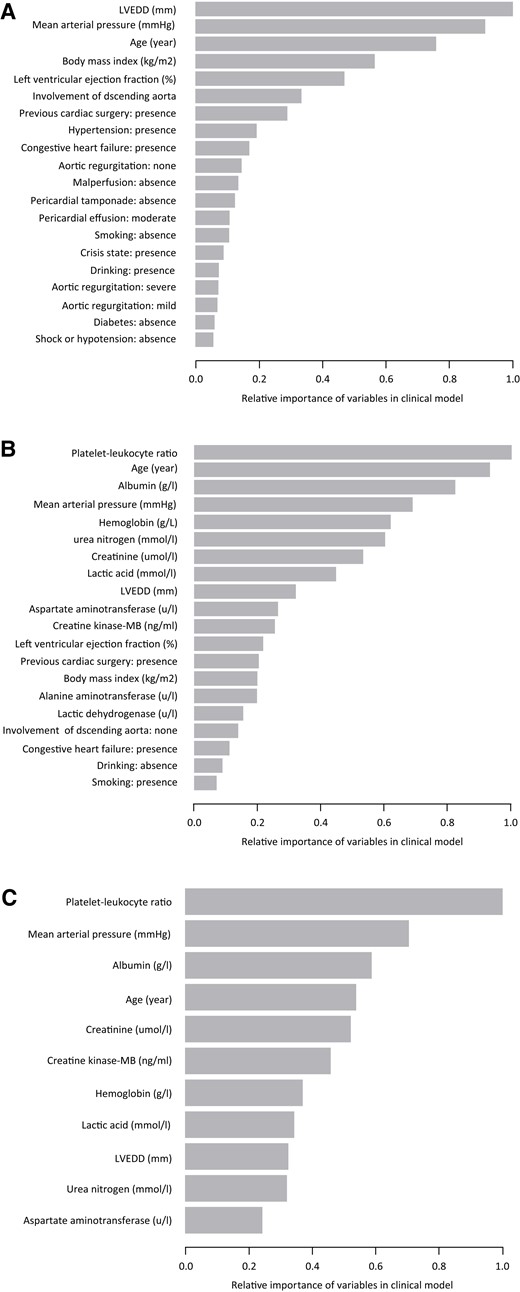
Feature importance in the clinical, full, and selective risk models in derivation cohort. (A) Relative importance of candidate variables predictive from the clinical model; (B) relative importance of candidate variables predictive from the full model; and (C) relative importance of candidate variables predictive from the selective model. LVEDD, left ventricular end-diastolic dimension; LVEF, left ventricular ejection fraction.


Performances of the clinical and full-risk models in derivation cohort. (A) AUROC of clinical model; (B) AUROC of full-risk model; (C) AUPRC of clinical model; (D) AUPRC of full-risk model; (E) calibration curves of clinical model; (F) calibration curves of full-risk model; (G) decision curves of clinical model; and (H) decision curves of full-risk model. AUROC, the area under the receiver operating characteristic curve; AUPRC, the area under the precision-recall curve.
By adding multiple circulating biomarkers into the clinical risk model, we fitted a full-risk model, which displayed improved discriminative capability compared with the clinical risk model, with an AUROC of 0.950 (95% CI 0.929–0.969) (Figure 2B), an AUPRC of 0.776 (Figure 2D), and a specificity of 0.923 and sensitivity of 0.846, which was further confirmed by the NRI for mortality [0.083, 95% CI (0.010–0.157); P = 0.026] and IDI [0.143, 95% CI (0.068–0.218); P = 0.0002]. Calibration and clinical decision curves of clinical risk modeland full risk model were showed in Figure 2E–H.
For simplicity and practicability, we selected the top 11 features of impotence with gain >0.03 to develop a selective risk model (Addition of Biomarker to Clinical model, named ABC model), comprising (in importance order): the platelet–leucocyte ratio, mean arterial pressure, albumin, age, serum creatinine, creatine kinase-MB, haemoglobin, lactic acid, left ventricular end-diastolic dimension, urea nitrogen, and aspartate aminotransferase (Figure 1). Logistic regression showed the higher platelet–leucocyte ratio was associated with a lower risk of operative mortality in the derivation cohort [OR 0.955, 95% CI (0.940–0.970); P < 0.001], and the functional relationships were shown in Supplementary material online, Figure S2. Besides, a Web application based on the software R was implemented and can be found at http://www.empowerstats.net/pmodel/? m=7473_ATAAD. A screenshot of the app can be found in Supplementary material online, Figure S3.
Compared with the clinical model, the ABC model significantly improves the discrimination ability with an AUROC of 0.930, 95% CI (0.906–0.954) (Figure 3A), an AUPRC of 0.657 (Figure 3C), and a specificity of 0.893, and a sensitivity of 0.853, which was further confirmed by the NRI for mortality [0.090, 95% CI (−0.008, 0.172); P = 0.032], and IDI [0.118, 95% CI (0.003–0.202); P = 0.006].


Performances of the ABC risk models in derivation and validation cohorts. (A) AUROC of the ABC risk models in derivation cohort; (B) AUROC of the ABC risk models in validation cohort; (C) AUPRC of the ABC risk models in derivation cohort; (D) AUPRC of the ABC risk models in validation cohort; (E) calibration curves of the ABC risk models in derivation cohort; (F) calibration curves of the ABC risk models in validation cohort; (G) decision curves of the ABC risk models in derivation cohort; and (H) decision curves of the ABC risk models in validation cohort. AUROC, the area under the receiver operating characteristic curve; AUPRC, the area under the precision-recall curve.
In comparison with the full model, the ABC model did not significantly lose the discrimination performances, without statistically significant differences of AUROC, AUPRC, specificity, and sensitivity also as evidenced by the NRI for mortality [−0.0064, 95% CI (−0.067, 0.054); P = 0.835], and IDI [0.0253, 95% CI (−0.036, 0.087); P = 0.420]. In the validation cohort, the ABC risk model also achieved excellent discrimination performances with an AUROC of 0.954, 95% CI 0.930–0.977 (Figure 3B), an AUPRC of 0.768 (Figure 3D), and a specificity of 0.839 and a sensitivity of 0.918.
In the derivation and validation cohorts, the ABC risk model showed adequate calibration with comparable observed and predicted mortality risks (Figure 3E and F). In clinical decision curve analysis, the ABC risk model provided a larger net benefit across the range of mortality risks (Figure 3G and H).
Comparisons with the existing clinical scores
In the derivation cohort, the ABC model significantly outperformed the currently existing clinical scores: additive EuroSCORE, logistic EuroSCORE, Parsonnet score, Cleveland score, OPR score, and SinoSCORE, IRAD risk score, and GERAADA risk score (Figure 4A). In the validation cohort, the ABC risk model achieved optimal discrimination performances [ABC model: AUROC 0.954 (0.930–0.977)], which consistently significantly outperformed the eight currently existing clinical scores in the validation cohort (Figure 4B).
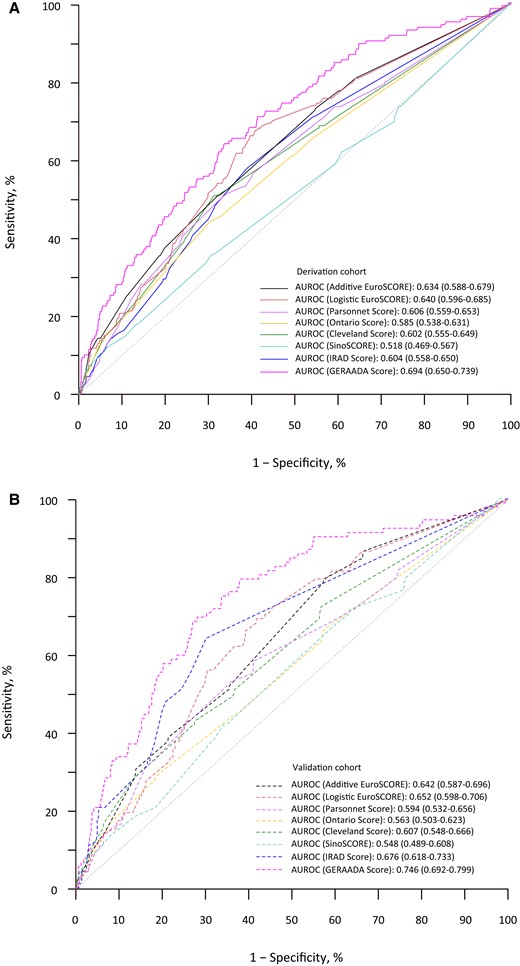
Performances of the currently existing clinical risk scores in derivation and validation cohorts. (A) AUROC of the currently existing clinical risk scores in derivation cohort and (B) AUROC of the currently existing clinical risk scores in validation cohort. AUROC, the area under the receiver operating characteristic curve.
Subgroup analysis
With reference to the low-risk group of ABC score (<5.0%), the middle-risk group (5.0–10.0%) and the high-risk group (>10.0%) conferred a significant gradient risk of mortality in the total cohort [OR 9.408, 95% CI (4.643–19.064); OR 184.324, 95% CI (99.306–342.129); P for trend < 0.001]. Compared with proximal arch repair, the extensive arch repair was not significantly associated with a higher risk of mortality among the low-risk group [OR 1.838, 95% CI (0.559–6.038); P = 0.316], but significantly associated with a higher risk of mortality among the middle- and high-risk group (OR 2.007, 95% CI 1.460–2.757; P < 0.0001) (P interaction = 0.889).
Discussion
In this prospective, multicenter study of Chinese patients with ATAAD who received surgical repair, we develop a risk model (ABC score) to predict operative mortality. To the best of our current knowledge, this is the largest sample size of the ATAAD study from China. The incorporation of a combination of circulating biomarkers that reflect inflammatory, cardiac, hepatic, renal, metabolic, and haematological pathways to a model with conventional risk factors improved the risk stratification for operative mortality following surgical repair. Compared with proximal arch repair, the extensive arch repair was associated with similar mortality risk among patients at low risk but associated with higher mortality risk among patients at middle–high risk.
Among several risk scores for predicting mortality that has been published in the setting of cardiovascular diseases.5–10 Of them, EuroSCORE is the most notable and broadly adopted; however, it is not specifically developed for aortic dissection surgery but for general cardiovascular surgery. Therefore, the clinical application of EuroSCORE was limited to predicting mortality in ATAAD surgery to a large extent taking into account the disparity in pathophysiology and procedural characteristics between aortic dissection and general cardiovascular diseases. Currently, the available scores specifically designed to risk-stratify ATAAD patients such as IRAD score11 and GERAADA score,12 these risk models were developed on the basis of an international aortic dissection database,34 and they have not been rigorously assessed for their risk stratification in Chinese ATAAD patients.
However, the IRAD score and GERAADA score demonstrates only moderate discrimination of mortality in our cohort. This may be due to population heterogeneity and/or practice differences. For instance, the observed prevalence of operative mortality and distributions of risk factors in our cohort were different from other cohorts. In addition, surgical strategy for ATAAD may affect the performance of the IRAD score and GERAADA score. Our cohort had a higher proportion of patients receiving more extensive arch repair like total arch replacement and frozen elephant trunk implantation compared with those reported in the other cohort. This procedure is more common and typical in Chinese clinical practices,35 but may increase the likelihood of operative risk.
Early risk assessment is important and necessary to guide the physician to provide appropriate therapeutic strategies for ATAAD patients. The availability of risk scores in clinical-specific subpopulations is crucial for tailored risk stratification. Until now, risk stratification of ATAAD patients has barely been reported and has not been comprehensively validated.12,36,37 Thanks to the larger size and the entirely independent data collection at the 13 participating sites, our study could provide excellent conditions for the establishment of a risk stratification model.
Importantly, the ABC model showed reasonable predictive performances for ATAAD patients by incorporating multiple biomarkers into conventional clinical variables, making the model comprehensive and generalizable. The risk model effectively identifies a gradient risk of operative mortality and thus supporting clinical decisions. For the predicted middle–high-risk patients, a less aggressive arch repair strategy is warranted. However, a more aggressive strategy may be recommended for patients with the predicted low risk of mortality against the risk of future aortic events associated with less invasive aortic treatment.4
Limitations
Our study has potential limitations. First, the risk score model was developed on basis of Chinese patients, however, it is unknown whether the findings can be extrapolated to other regions of the world. External validation or recalibration of the risk model in other cohorts is needed to extend its utility. Second, candidate biomarkers collected in our study have previously been suggested to be promising predictors of mortality in cardiovascular settings; however, it is possible that other biomarkers that were not tested would have provided additional prognostic information. Finally, surgical strategy selection in the study was determined by balancing the risks and benefits associated with each procedure in conjunction with the available baseline factors and the preferences of surgeons involved; thus, the specific expertise may differ from those of other practitioners, potentially limiting the generalizability of these results to other institutions.
Conclusions
Among ATAAD patients, the approach of simultaneously adding several circulating biomarkers that reflect the inflammatory, cardiac, hepatic, renal, metabolic, and haematological pathways to the model that includes the conventional clinical risk factors substantially improves the risk stratification for operative mortality following surgical repair. If these results are validated, the incorporation of these factors in clinical practice for early mortality prediction could be accomplished quickly, since the measurement of these circulating biomarkers is already well-established for diagnostic use. It offers an improved decision support tool to stratify ATAAD patients by their risks of operative mortality, providing individualized treatment strategies.
Group information
The 5A Investigators are listed in Supplementary information.
Supplementary material
Supplementary material is available at European Heart Journal – Digital Health online.
Acknowledgements
None.
Funding
This work was supported by Scientific Research Common Program of Beijing Municipal Commission of Education (KM202110025014) and Beijing Municipal Science and Technology Commission (Z211100002921010).
Data availability
Individual data used for this study are not publicly available for proprietary reasons. The coding used to train the models is dependent on annotation, infrastructure, and hardware and therefore, cannot be released.
References
Author notes
Si-Chong Qian, Lu Han, Ying-Yuan Zhang, Ying Wu, Liang Hong, Ji-Nong Yang, Ji-Sheng Zhong, Yu-Qi Wang, Dong-Kai Wu, Guo-Liang Fan, Jun-Quan Chen, Sheng-Qiang Zhang, Xing-Xing Peng and Zhi-Wei Tang equally contributed to this work.
Conflict of interest: None declared.
