


Abstract
Clinical scoring systems for pulmonary embolism (PE) screening have low specificity and contribute to computed tomography pulmonary angiogram (CTPA) overuse. We assessed whether deep learning models using an existing and routinely collected data modality, electrocardiogram (ECG) waveforms, can increase specificity for PE detection.
We create a retrospective cohort of 21 183 patients at moderate- to high suspicion of PE and associate 23 793 CTPAs (10.0% PE-positive) with 320 746 ECGs and encounter-level clinical data (demographics, comorbidities, vital signs, and labs). We develop three machine learning models to predict PE likelihood: an ECG model using only ECG waveform data, an EHR model using tabular clinical data, and a Fusion model integrating clinical data and an embedded representation of the ECG waveform. We find that a Fusion model [area under the receiver-operating characteristic curve (AUROC) 0.81 ± 0.01] outperforms both the ECG model (AUROC 0.59 ± 0.01) and EHR model (AUROC 0.65 ± 0.01). On a sample of 100 patients from the test set, the Fusion model also achieves greater specificity (0.18) and performance (AUROC 0.84 ± 0.01) than four commonly evaluated clinical scores: Wells’ Criteria, Revised Geneva Score, Pulmonary Embolism Rule-Out Criteria, and 4-Level Pulmonary Embolism Clinical Probability Score (AUROC 0.50–0.58, specificity 0.00–0.05). The model is superior to these scores on feature sensitivity analyses (AUROC 0.66–0.84) and achieves comparable performance across sex (AUROC 0.81) and racial/ethnic (AUROC 0.77–0.84) subgroups.
Synergistic deep learning of ECG waveforms with traditional clinical variables can increase the specificity of PE detection in patients at least at moderate suspicion for PE.

Introduction
Pulmonary embolism (PE) is a life-threatening complication of venous thromboembolism (VTE) with high short- and long-term cardiovascular morbidity and mortality globally.1,2 Given the lack of specificity in presenting symptoms and existing clinical decision rules, diagnostic uncertainty in PE remains high and requires clinicians to use thoracic imaging modalities, most commonly computed tomography pulmonary angiogram (CTPA), to confirm diagnosis, especially in those who are at moderate- to high suspicion of PE.3 Overreliance on CTPA has been documented across health systems and has important implications for resource utilization. In a multicentre analysis of medical centres in the USA, only 3.1% of CTPA scans were positive for PE.4 More importantly, widespread CTPA confers risk to patients through large radiation doses and may be contraindicated in specific subpopulations.5,6 An effectively developed framework improving CTPA diagnostic yield for PE using routinely collected clinical information would have crucial implications for PE detection and management, increasing patient safety, and mitigating systemic inefficiencies.
Integration of different data modalities and analytic approaches may provide a means to improve prediction. For example, deep learning models leveraging non-traditional data forms [such as raw electrocardiogram (ECG) waveforms] set themselves apart from other classes of models by their ability to computationally derive features without pre-specification.7 Previous work has demonstrated that such ECG models can be used to predict future arrhythmias from normal sinus rhythm ECGs, characterize right- and left-sided ventricular function, and increase detection of left ventricular dysfunction in a primary care setting.8–11 The results of these investigations suggest that deep learning models can be used to detect subtle signals indiscernible to clinicians and effectively augment the clinical workflow.
In this article, we provide a preliminary fusion modelling framework that integrates ECG waveform and clinical data to predict the likelihood of acute PE. Our approach differs from previous PE prediction approaches because it integrates a deep learning-based embedding representation of ECG waveforms into the prediction framework.12–15 We hypothesize that ECG waveforms and clinical data can be combined synergistically in a machine learning modelling framework to detect PE in those patients with at least moderate PE suspicion.
Methods
Data sources and study population
We conducted a retrospective cohort study to predict the probability of a PE (Figure 1A) in patients at moderate- to high suspicion of PE using data between 1 January 2003 and 3 June 2020 from five hospitals in the Mount Sinai Health System (New York City, NY, USA) serving a diverse and urban population. Dataset curation, study design, and model development are reported using the Strengthening the Reporting of Observational Studies in Epidemiology (STROBE) and the Transparent Reporting of a Multivariable Prediction Model for Individual Prognosis or Diagnosis (TRIPOD) statements16,17 (Supplementary material online, Tables S1 and S2). The study was approved by the Mount Sinai Institutional Review Board.
![Study design. (A) Our pipeline for creating models to detect pulmonary embolism consists of using three data modalities: electrocardiograms, clinical data [electronic health records (EHR)] including patient demographics, comorbidities, vital signs, and relevant labs, and computed tomography pulmonary angiograms that are labelled using a two-stage approach combining natural language processing pattern matching and manual clinician annotations. These data are linked together to develop, analyse, and benchmark models to predict pulmonary embolism. (B) We split our dataset for training, validation, and testing first by first identifying all unique patients (not unique computed tomography pulmonary angiogram or unique electrocardiogram) and separating them based on whether they have at least one PE-positive computed tomography pulmonary angiogram scan (PE+) or not (PE−). This stratum is further split into 90% for nine-fold cross-validation (89% for training, 11% for model selection and model development) and 10% for testing to assess model performance and benchmark against clinical scores. (C) Electrocardiograms are labelled as PE+ if they are recorded within 24 h of a PE+ computed tomography pulmonary angiogram. Electrocardiograms recorded 24 h after or between 6 months and 24 h before a positive computed tomography pulmonary angiogram are discarded. Electrocardiograms not meeting the above criteria for PE+ computed tomography pulmonary angiograms are labelled PE−. EHR data are retained if collected within 24 h of the computed tomography pulmonary angiogram and labelled equally with the computed tomography pulmonary angiogram finding.](https://oup.silverchair-cdn.com/oup/backfile/Content_public/Journal/ehjdh/3/1/10.1093_ehjdh_ztab101/2/m_ztab101f1.jpeg?Expires=1750217969&Signature=2A98YL9H4A6maSK0U7mH9Ug5BL~B0lWQo4iq5ThELR1sZkbbzWrCnOws4OMt12AxQDRNRk6GPq~RXTon2ZZakl3a8eX5EcfGHsumZA-Oug12pXJvufiRuIIuNy8B6lfqi7zh00zLaksktbY9PB7oyV2~uCvyVXtdI8xfl~-lRUD2PDyA2bK7Db26QxfBPxZuVp-UB2xcn82JgW1qx1iZ8r1zn0Vj1r38PFKMAquel~MebG6RQOd-cjmMTpec1Twgm8R3wcFxgRjf65NizsuFrSjfsuwSJl7lhA4flC3-8~xz0EVkkF-BlLBb-s8viE4VFE~jWmjfGB3BqK~-ClUh-w__&Key-Pair-Id=APKAIE5G5CRDK6RD3PGA)
Study design. (A) Our pipeline for creating models to detect pulmonary embolism consists of using three data modalities: electrocardiograms, clinical data [electronic health records (EHR)] including patient demographics, comorbidities, vital signs, and relevant labs, and computed tomography pulmonary angiograms that are labelled using a two-stage approach combining natural language processing pattern matching and manual clinician annotations. These data are linked together to develop, analyse, and benchmark models to predict pulmonary embolism. (B) We split our dataset for training, validation, and testing first by first identifying all unique patients (not unique computed tomography pulmonary angiogram or unique electrocardiogram) and separating them based on whether they have at least one PE-positive computed tomography pulmonary angiogram scan (PE+) or not (PE−). This stratum is further split into 90% for nine-fold cross-validation (89% for training, 11% for model selection and model development) and 10% for testing to assess model performance and benchmark against clinical scores. (C) Electrocardiograms are labelled as PE+ if they are recorded within 24 h of a PE+ computed tomography pulmonary angiogram. Electrocardiograms recorded 24 h after or between 6 months and 24 h before a positive computed tomography pulmonary angiogram are discarded. Electrocardiograms not meeting the above criteria for PE+ computed tomography pulmonary angiograms are labelled PE−. EHR data are retained if collected within 24 h of the computed tomography pulmonary angiogram and labelled equally with the computed tomography pulmonary angiogram finding.
For cohort selection, we extracted all the patients who had CTPA, for whom radiologist annotated CTPA reports (report text, time of acquisition) were obtained from the Mount Sinai Data Warehouse (MSDW). Details on the patient encounter selection in our dataset are described further in the Supplementary material online, Methods, Figures S1, and S6. In addition to CTPA reports, we also extracted the following data and temporally linked them to CTPA reports: ECG morphology parameters (e.g. PR-interval length, ventricular rate), physician-confirmed diagnostic reads, and raw signals or waveforms were parsed from ECG data from the General Electric (GE) MUSE data management system. Waveforms recorded at 500 Hz for 10 s (total of 5000 data points) were available for all linearly independent leads: I, II, V1, V2, V3, V4, V5, and V6. Tabular EHR data consist of demographics, comorbidities, vitals, and labs. Database codes representing unique comorbidities, vital signs, and important labs were manually consolidated across the five hospital sites. ECG metadata was used to fill in missing demographics (age, sex, and race) for patient encounters missing those data from MSDW. Patients were only coded as having a comorbidity if the corresponding diagnostic codes were created before the start of the CTPA-related encounter (Supplementary material online, Table S3). Vital signs (heart rate, blood pressure, respiration rate, temperature, and oxygen saturation) and labs [D-dimer, brain-natriuretic peptide (BNP), and troponin-I] were also extracted.
Computed tomography pulmonary angiogram report acquisition and labelling
The MSDW database was queried by IT personnel for all thoracic computed tomography scans acquired between 1 January 2003 and 3 June 2020 in adult patients (age ≥ 18). We use natural language processing (NLP) of semi-structured reports to determine PE status and to exclude scans ordered for an indication other than assessment of the pulmonary vasculature. Pretrained NLP models from SciSpacy, which are trained using biomedical, scientific, and clinical text,18 were used to preprocess, tokenize, and stem all text in the CTPA reports. Full details on CTPA report preprocessing may be found in Supplementary material online, Methods (page 2). To annotate CTPA reports, we used a two-stage approach predicated on two assumptions: (i) that the majority of CTPA reports are negative for a PE and (ii) that the absence of a PE in the ‘Impression’ section is reported in a standardized format (Supplementary material online, Figure S1). In the first stage, we identify all reports negative for a PE by matching those containing a highly specific pattern (Supplementary material online, Figure S2). In the second stage, we used a team of four Internal Medicine residents and one medical student to annotate the presence, chronicity, and vascular location of a PE in the remaining reports. Chronic PEs without any acute or subacute changes that may be associated with the presentation were classified as PE-negative to restrict the PE-positive class to only acute PEs causing the current symptomology. Given controversy over their clinical significance, we also excluded CTPAs that only documented subsegmental PEs.19–22 Further details may be found in Supplemental material online, Methods (page 2).
Linking electrocardiogram and EHR data with computed tomography pulmonary angiogram labels
For a given patient encounter, ECGs and CTPAs were linked differently with one another depending on whether the CTPA was PE-positive or PE-negative (Figure 1C). If the CTPA was PE-positive, ECGs recorded within 24 h of the CTPA were retained and labelled as PE-positive. If an ECG was taken after 24 h of the CTPA, it was discarded to minimize the impact of medical intervention started after the positive scan. Electrocardiograms taken before 24 h but less than 6 months of a positive CTPA were also conservatively discarded, since knowledge of when the PE began could not be assessed through ordinary means. If the CTPA was PE-negative, all ECGs were labelled as PE-negative. Example scenarios are shown in Supplementary material online, Table S4.
Experimental design
Given the low number of PE-positive CTPAs and the resulting class imbalance, we used a stratified k-fold approach to create our cross-validation (training and validation) and testing sets. We first split all patients by those who have at least one positive CTPA (‘positive’) and those who have only negative CTPAs (‘negative’) to ensure no leakage of patient data between the training, validation, and testing sets. Next, we split each subset into 90% for cross-validation and 10% for testing. We further stratify the cross-validation set into nine folds to maintain an overall 80–10–10 training–validation–test split. The positive and negative patients from each split are combined to yield the final nine-fold cross-validation sets and holdout testing set. Given the prognostic severity of PEs, thresholds for classification were set at the greatest value (to maximize specificity) at which the models achieved 100% sensitivity (i.e. no false negative PEs) on the validation set.
Modelling overview
Details of ECG preprocessing to remove baseline drift and exclude poor quality waveforms are found in Supplementary material online, Methods (page 2) and Supplementary material online, Figures S4 and S5. Each ECG is treated as a series of eight contiguous leads (I, II, V1–V6) of length 5000 data points (10 s). To predict the probability of PE from raw ECG waveforms, we employ a convolutional neural network (CNN) model (‘ECG’) composed of a series of 12 residual blocks followed by a fully-connected layer and an output sigmoid activation layer (Figure 2A). Details on model architecture and training are discussed in Supplementary material online, Methods (pages 2–3).

Modelling overview, performance, and interpretability. (A) The electrocardiogram model, which is a convolutional neural network with residual connections, trains and infers pulmonary embolism likelihood using 10-s long waveform from 8 leads (I, II, V1–V6) recorded at 500 Hz. The EHR model is an Extreme Gradient Boosting (XGBoost) model that uses tabular clinical data (demographics, comorbidities, labs, and vital signs) and electrocardiogram morphology parameters to predict the likelihood of pulmonary embolism. Finally, the fusion model is an XGBoost model that uses a principal component decomposition of an electrocardiogram waveform embedding from the electrocardiogram model, tabular clinical data, and electrocardiogram morphology parameters in an XGBoost framework to predict the likelihood of pulmonary embolism. (B) Mean receiver-operating characteristic (top) and precision-recall (bottom) curves with 95% confidence intervals for the electrocardiogram (red), EHR (blue), and Fusion (orange) models, with the mean and standard deviations for the area under each respective curve (AUROC, AUPRC) in the figure legend. In top plot, the horizontal and vertical lines correspond to optimal threshold. The Fusion model outperforms both the electrocardiogram and EHR models. (C) SHAP dependency plots for the EHR model (top) and Fusion model (bottom), representing the marginal contribution from patient encounters in the test set (dots, coloured by value of feature) of different features (y-axis, in descending order of importance) on the model output (x-axis, positive favours increased pulmonary embolism likelihood). Grey dots represent samples with missing data points.
For the EHR-only (‘EHR’) models, all demographics, comorbidities, vitals, labs, and ECG morphology parameters (PR interval, QRS interval length, QTc, and R-wave axis) presented in Table 1 were used as inputs. Vitals, labs, and ECG-derived parameters were associated with a patient encounter if they were collected within 24 h of the time the CTPA scan was ordered. For encounters with multiple vitals and labs within the 24-h time period, the closest one to the CTPA order time was used. To predict PE from the EHR dataset, we evaluated four classes of models [logistic regression, ElasticNet, random forest, and Extreme Gradient Boosting (XGBoost)] under different conditions (Supplementary material online, Table S5).
Baseline characteristics in the PE-positive and PE-negative cohorts
| CTPA or PE-encountera | |||||
|---|---|---|---|---|---|
| Missing | Overall | Negative | Positive | P-value | |
| n | 23 793 | 21 358 | 2435 | ||
| Age (years), mean (SD) | 122 | 57.9 (17.7) | 57.6 (17.8) | 60.7 (17.0) | <0.001 |
| Sex, n (%) | |||||
| Female (code = 0) | 13 | 14 786 (62.2) | 13 441 (63.0) | 1345 (55.3) | <0.001 |
| Male (code = 1) | 8994 (37.8) | 7907 (37.0) | 1087 (44.7) | ||
| Race, n (%) | |||||
| Asian | 189 | 591 (2.5) | 531 (2.5) | 60 (2.5) | <0.001 |
| Black | 6376 (27.0) | 5674 (26.8) | 702 (29.0) | ||
| Hispanic | 3486 (14.8) | 3217 (15.2) | 269 (11.1) | ||
| White | 8083 (34.2) | 7170 (33.8) | 913 (37.8) | ||
| Other | 5068 (21.5) | 4595 (21.7) | 473 (19.6) | ||
| Arrhythmia, n (%) | 2642 | 2371 (11.2) | 2112 (11.1) | 259 (11.8) | 1.000 |
| Coronary artery disease, n (%) | 2642 | 3272 (15.5) | 2950 (15.6) | 322 (14.7) | 1.000 |
| Cancer, n (%) | 2642 | 5030 (23.8) | 4507 (23.8) | 523 (23.8) | 1.000 |
| Chronic kidney disease, n (%) | 2642 | 1811 (8.6) | 1612 (8.5) | 199 (9.1) | 1.000 |
| Coagulopathy, n (%) | 2642 | 378 (1.8) | 333 (1.8) | 45 (2.1) | 1.000 |
| Chronic obstructive pulmonary disease, n (%) | 2642 | 2235 (10.6) | 2062 (10.9) | 173 (7.9) | 0.001 |
| Diabetes mellitus, n (%) | 2642 | 3752 (17.7) | 3378 (17.8) | 374 (17.0) | 1.000 |
| History of DVT or PE, n (%) | 2642 | 1875 (8.9) | 1548 (8.2) | 327 (14.9) | <0.001 |
| Congestive heart failure, n (%) | 2642 | 2704 (12.8) | 2406 (12.7) | 298 (13.6) | 1.000 |
| Hypertension, n (%) | 2642 | 7439 (35.2) | 6634 (35.0) | 805 (36.7) | 1.000 |
| Pregnancy, n (%) | 2642 | 613 (2.9) | 568 (3.0) | 45 (2.1) | 0.466 |
| Pulmonary hypertension, n (%) | 2642 | 1364 (6.4) | 1173 (6.2) | 191 (8.7) | <0.001 |
| Rheumatological disease, n (%) | 2642 | 3904 (18.5) | 3500 (18.5) | 404 (18.4) | 1.000 |
| Heart rate (b.p.m.), mean (SD) | 5031 | 90.6 (22.6) | 90.3 (22.9) | 93.1 (20.3) | <0.001 |
| Systolic blood pressure (mmHg), mean (SD) | 5175 | 128.7 (26.8) | 128.8 (27.1) | 127.4 (23.9) | 0.538 |
| Diastolic blood pressure (mmHg), mean (SD) | 5127 | 71.2 (15.1) | 71.1 (15.3) | 72.0 (14.1) | 0.241 |
| Respiration rate (breaths per minute), mean (SD) | 5227 | 19.6 (4.4) | 19.6 (4.3) | 20.3 (5.6) | <0.001 |
| Oxygen saturation (%), mean (SD) | 7592 | 96.9 (14.8) | 96.9 (13.8) | 96.9 (21.4) | 1.000 |
| BNP (pg/mL), mean (SD) | 18 986 | 437.7 (1078.4) | 449.2 (1115.4) | 381.7 (873.6) | 1.000 |
| D-dimer (µg/mL FEU), mean (SD) | 16 248 | 2.7 (7.2) | 2.3 (7.1) | 6.5 (6.5) | <0.001 |
| Troponin (ng/mL), mean (SD) | 10 375 | 0.2 (4.3) | 0.2 (4.5) | 0.3 (1.7) | 1.000 |
| PR interval length (ms), mean (SD) | 7737 | 151.5 (29.5) | 151.5 (29.3) | 151.3 (31.0) | 1.000 |
| QRS duration (ms), mean (SD) | 6402 | 89.3 (19.9) | 89.2 (20.0) | 90.0 (19.7) | 1.000 |
| QTc (ms), mean (SD) | 6402 | 450.0 (37.4) | 449.3 (36.9) | 454.8 (40.3) | <0.001 |
| Cardiac axis (degrees), mean (SD) | 6402 | 26.1 (50.0) | 26.2 (49.4) | 24.8 (54.5) | 1.000 |
| PE location, n (%) | |||||
| No PE | 0 | 21 358 (89.8) | 21 358 (100.0) | <0.001 | |
| Truncal | 126 (0.5) | 126 (5.2) | |||
| Main | 515 (2.2) | 515 (21.1) | |||
| Lobar | 692 (2.9) | 692 (28.4) | |||
| Segmental | 1102 (4.6) | 1102 (45.3) | |||
Unit of analysis is unique patient encounter or, by extension, unique CTPAs.
DVT, deep vein thrombosis; FEU, fibrinogen equivalent units.
We use a fusion modelling approach to combine ECG waveform information and tabular EHR data.23 To represent ECG waveform data, we use the output after all convolutional blocks (i.e. ‘flatten’ layer) from the ECG model. Since the dataset size for fusion modelling is much smaller (i.e. samples of patient-encounters vs. samples of ECGs), we use principal components analysis (PCA) to reduce the dimensionality of this intermediate output to 20 components. This lower-dimensional representation of ECG waveforms after PCA is combined with tabular EHR data and used as the model’s input. Independent PCA components are also beneficial for interpretability analysis used below.24 For these fusion models (‘Fusion’), ECGs for PE-negative patients recorded outside of the 24-h window were not discarded, since these prior ECGs may still contain relevant information about a patient’s clinical status. To predict PE from this fusion dataset, we use the best performing model from the EHR experiments as our scaffold and assess the model’s robustness through feature sensitivity studies against a holdout test set (Supplementary material online, Figures S10 and S11).
All models were developed in Python (version 3.5.1) and PyTorch (version 1.5.1).25
Model interpretability
We evaluated feature contributions towards model prediction using Shapley Additive Explanations (SHAP) scores26 for the EHR and Fusion models. SHAP scores are a game-theoretic approach to model interpretability; they provide explanations of global model structures based upon combinations of several local explanations for each prediction. To interpret and rank the significance of input features towards the final prediction of the model, mean absolute SHAP values were calculated for each feature across all observations in the holdout test set for each model trained on a cross-validation fold. These values are visualized using SHAP dependency plots (Figure 2C), which show how different values (dot colour) of features (y-axis) affect model output (x-axis). We also perform extensive feature sensitivity analyses to investigate the effect of features that may cache clinician driven bias (e.g. a BNP lab may be drawn if competing diagnoses, like [congestive heart failure (CHF)], are high in suspicion or may be a sign of PE prognostication) by assessing change in model performance after their removal from the model input feature set.
Comparison to existing clinical scores
To understand the performance of these models relative to existing clinical screening tools in the diagnostic workflow particularly patients with CTPA (who are at moderate- to high suspicion of PE), we compare the performance of our model against common clinical criteria for assessing patient likelihood of having PE: Wells’ Criteria for PE (Wells’),27 the Revised Geneva Score for PE (Geneva),28 PE Rule-Out Criteria (PERC),29 and 4-Level PE Clinical Probability Score (4PEPS).30 However, three of the clinical scores used (Wells’, Geneva, and 4PEPS) require D-dimer in their framework to determine whether a CTPA is warranted. To restrict clinical bias that may be embedded in those patients in our dataset with missing D-dimers and ensure a fairer comparison, we compose a manual validation sample of 100 patient encounters selected from the holdout test set, 50 of whom have D-dimer and 50 of them are randomly selected without replacement. Details on the chart review for examining these cases are found in Supplementary material online, Methods.
Statistical analysis
Unique CTPAs were the unit of analysis chosen to make univariate comparisons. Cohen’s kappa statistic was used to assess for interrater reliability on the test set of PE annotations. To assess model performance, mean receiver operating characteristic (ROC) and mean precision-recall (PRC) curves with 95% confidence intervals (alpha = 0.05) on the holdout test set across each fold were plotted and the mean and standard deviation areas under the ROC curve (AUROC) and PRC curve (AUPRC) were calculated. Analysis of variance was used to compare inter-model performance. Sensitivity, specificity, positive predictive value, and negative predictive value were estimated using the optimal threshold ensuring maximal sensitivity while maximizing specificity on the validation set. Model calibration plots showing the fraction of positives at each average predicted probability value for the fusion model were created. Brier score loss was used to quantitatively assess fusion model calibration. McNemar’s test was used to compare the diagnostic performance of the fusion models against the clinical scores. All statistical analyses were performed using the statsmodels library (version 0.12.0)31 in Python (version 3.5.1).
Role of the funding source
The funders had no role in study design, data collection, data analysis, data interpretation, writing the report, or the decision to submit the paper for publication. The corresponding author had full access to all data and the final responsibility to submit for publication.
Results
Study population
A total of 30 109 potential CTPAs were retrieved from our healthcare system. After NLP-augmented annotation of these reports (Supplementary material online, Figure S1), a total of 28 496 CTPA reports were labelled, of which 25 099 reports (88.1%) were PE-negative and 3397 reports (11.9%) were PE-positive. Mean interrater reliability on the test set for annotation was 0.97 with a standard deviation of 0.03. After preprocessing and linking with the ECG datasets (Supplementary material online, Figure S4–S6), a total of 23 793 CTPAs (10.0% positive for PE) and 320 746 ECGs (12.8% positive for PE) across 21 183 unique patients were available for model development and testing. Within the PE-positive CTPAs, there were 126 (5.2%) truncal, 515 (21.1%) main, 692 (28.4%) lobar, and 1102 (45.3%) segmental PEs. In our sample (Table 1), PE-positive CTPAs were more common in patients who were older (mean age 60.7 vs. 57.6 years), were more likely to have a history of deep vein thrombosis (DVT) or PE (14.9% vs. 8.2%), and had higher heart rates (93.1 vs. 90.3 beats per minute) and D-dimer levels (6.5 vs. 2.3 µg/mL FEU) on admission. Additional univariate analysis of our dataset by data split, PE location, and feature missingness are provided in Supplementary material online, Tables S6–S8.
Model evaluation
For predicting PE from ECG waveforms, the deep neural network achieved modest performance for the cross-validation set (AUROC 0.69). Results for optimization experiments to fine-tune the sampling method, learning rate, kernel size, and model depth can be found in Supplementary material online, Table S9. XGBoost was chosen as the scaffold for both EHR and fusion models since it performed best-in-class in the EHR-only experiments (AUROC 0.64 on the selected cross-validation set). For predicting PE from both ECG waveforms and EHR data, the fusion model achieved an AUROC of 0.82 on the selected cross-validation set.
On the holdout test set (Figure 2B), the fusion model performed the best (AUROC of 0.81 ± 0.01, AUPRC of 0.35 ± 0.01), followed by the EHR model (AUROC 0.65 ± 0.01, AUPRC 0.17 ± 0.01) and the ECG model (AUROC 0.59 ± 0.01, AUPRC 0.18 ± 0.02). For ECG model, we have also predicted the performance using PCA components only and the results (AUROC 0.59, AUPRC 0.14) are close to the original CNN results. EHR model SHAP scores on this holdout set (Figure 2C) demonstrated that higher values of age, male gender, history of DVT or PE, absence of chronic obstructive pulmonary disease (COPD), higher heart rates, lower oxygen saturation, and lower QRS duration on ECG shifted the model output to predict PE, with the largest impact stemming from a positive history of DVT or PE (towards predicting PE) and positive history of COPD (towards predicting not PE). Fusion model SHAP scores on the holdout set showed model output being driven more by continuous features, such that model output was shifted to predict PE with older age, higher D-dimer, higher QTc, lower QRS duration, lower values of the first principal component from the ECG waveform representation (PCA 1), and higher values of PCA 3. In subgroup analysis of model performance by PE location, all models detected truncal PEs the best, followed in order by main, lobar, and segmental PEs (Supplementary material online, Figure S7). Finally, we found comparable performance in fusion model performance by gender (mean AUROC 0.81) and race (mean AUROC 0.77–0.84) (Supplementary material online, Figure S8).
To assess the impact of missingness and data derived from clinician decision-making on model prediction, we perform a series of feature sensitivity experiments (Supplementary material online, Figure S9). Model performance on the holdout test set remained the same when removing race and sex (AUROC 0.81 ± 0.01), comorbidities (AUROC 0.81 ± 0.01), and vitals (AUROC 0.81 ± 0.01) but decreased with removal of D-dimer (AUROC 0.78 ± 0.01), all labs (AUROC 0.76 ± 0.01), and ECG morphology parameters (AUROC 0.75 ± 0.01). The fusion model was overall well-calibrated (Brier score 0.076) and particularly had greater accuracy for negative-PE cases, for which the prediction probability of the model is lower and maps to label of 0 (Supplementary material online, Figure S10).
Model performance against clinical scores
On all patients in the sample holdout set, we benchmark our model performance against standard-of-care scoring systems through a threshold-independent metric (AUROC) and a threshold-dependent metric (specificity). On threshold-independent evaluation (Figure 3A), the fusion model with D-dimer (AUROC 0.84 ± 0.02) and without D-dimer (AUROC 0.70 ± 0.02) outperformed the clinical scores: Wells’ criteria (AUROC 0.54), revised Geneva score (AUROC 0.52), PERC (AUROC 0.50), and 4PEPS (AUROC 0.58). When thresholding these scores based on published standards to exclude PE without the need for a D-dimer, the Wells’ criteria score missed the most PEs (8), followed by the Geneva Score (7) and 4PEPS (3). Only PERC missed no PEs. For equitable comparison, the fusion model trained without D-dimer (since this is not available to these clinical scores) using cross-validation set achieved perfect sensitivity (1.00) with greater specificity (0.18) than the Wells’ criteria (0.00) and PERC (0.03) (Table 2). Even when setting classification thresholds to achieve perfect sensitivity by adjusting the threshold for PE using the holdout test set, the fusion model without D-dimer had greater specificity (0.30) compared to 4PEPS (0.05), PERC (0.03), Wells’ criteria (0.00), and the revised Geneva score (0.00) (Table 2). To assess the impact of missingness on model performance, another feature sensitivity study was performed on the fusion model, which demonstrated better performance of these fusion model (AUROC 0.63–0.84) relative to the clinical scoring systems (AUROC 0.50–0.58) (Supplementary material online, Figure S11). Notably, model performance suffered minimally with removal of demographics (AUROC 0.83), comorbidities (AUROC 0.83), vitals (AUROC 0.83), and ECG morphology parameters (AUROC 0.81).
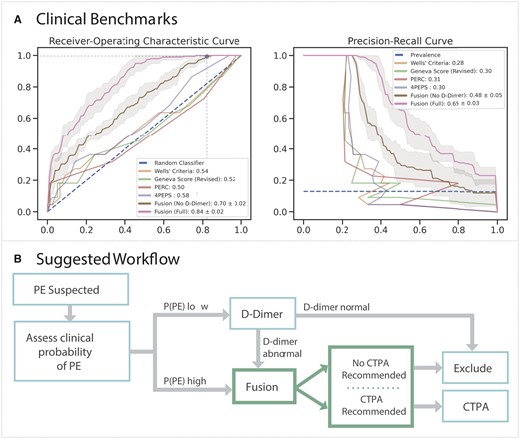
Clinical benchmark and integration. (A) Mean receiver-operating characteristic (ROC, left) and precision-recall (PRC, right) curves with 95% confidence intervals for the Fusion model with (pink) and without (brown) D-dimer, whereas ROC and PRC are shown for the clinical scores—Wells’ Criteria (yellow), Revise Geneva Score (green), PERC (red), and 4PEPS (purple). In top plot, the horizontal and vertical lines correspond to optimal threshold. Mean and standard deviations for the area under each respective curve (AUROC, AUPRC) for the Fusion models are displayed in the legend, whereas area under each respective curve (AUROC, AUPRC) are shown for the clinical scores. (B) The Fusion model may be used to recommend computed tomography pulmonary angiogram or exclude pulmonary embolism in patients with moderate to high likelihood of pulmonary embolism after clinical stratification or those at low suspicion with an abnormal D-dimer.
Fusion model performance benchmarked against clinical scores
| Threshold source | Model | Threshold | TP | TN | FP | FN | Sensitivity | Specificity | PPV | NPV | McNemar test |
|---|---|---|---|---|---|---|---|---|---|---|---|
| Cross-validation fold | Fusion model | 0.037 | 22 | 14 | 62 | 0 | 1.00 | 0.18 | 0.26 | 1.00 | (Base) |
| Fusion model (no D-dimer) | 0.040 | 22 | 14 | 62 | 0 | 1.00 | 0.18 | 0.26 | 1.00 | 1.000 | |
| Wells et al.26 | Wells’ criteria | 1 | 14 | 24 | 52 | 8 | 0.64 | 0.32 | 0.21 | 0.75 | 0.005 |
| Le Gal et al.27 | Revised Geneva Score | 4 | 15 | 20 | 56 | 7 | 0.68 | 0.26 | 0.21 | 0.74 | 0.041 |
| Kline et al.28 | PERC | 1 | 22 | 2 | 74 | 0 | 1.00 | 0.03 | 0.23 | 1.00 | 0.185 |
| Roy et al.29 | 4PEPS | 0 | 19 | 19 | 57 | 3 | 0.86 | 0.25 | 0.25 | 0.86 | 0.002 |
| Holdout test set | Fusion model | 0.091 | 22 | 43 | 33 | 0 | 1.00 | 0.57 | 0.40 | 1.00 | (Base) |
| Fusion model (no D-dimer) | 0.072 | 22 | 21 | 55 | 0 | 1.00 | 0.28 | 0.29 | 1.00 | <0.001 | |
| Wells’ criteria | 0 | 22 | 0 | 76 | 0 | 1.00 | 0.00 | 0.22 | 0.00 | <0.001 | |
| Revised Geneva Score | 0 | 22 | 0 | 76 | 0 | 1.00 | 0.00 | 0.22 | 0.00 | <0.001 | |
| PERC | 1 | 22 | 2 | 74 | 0 | 1.00 | 0.03 | 0.23 | 1.00 | <0.001 | |
| 4PEPS | −1 | 22 | 4 | 72 | 0 | 1.00 | 0.05 | 0.23 | 1.00 | <0.001 |
Encounters are classified as PE-positive if the clinical score or model likelihood is greater than or equal to the threshold value.
4PEPS, 4-Level Pulmonary Embolism Clinical Probability Score; FN, false negatives; FP, false positives; NPV, negative predictive value; PERC, Pulmonary Embolism Rule-Out Criteria; PPV, positive predictive value; TN, true negatives; TP, true positives.
Discussion
In this study, we present a novel approach for detecting PEs through a fusion modelling framework built on a large dataset of readily available clinical data and routinely collected ECG waveforms linked to annotated CTPA reports. We demonstrate that raw ECG waveform embeddings act synergistically with tabular clinical data to detect PE with greater specificity (AUROC 0.84, specificity 0.18) in those at moderate- to high-suspicion relative to commonly employed clinical scores (AUROC 0.50–0.58, specificity 0.00–0.05) in our retrospective cohort.
Improving PE detection remains a crucial modelling task for informaticians and clinical researchers. Despite the steady decrease in mortality attributable to PE, improving diagnostic yield remains important given that the condition remains underdiagnosed globally.32 However, given the high morbidity and mortality risk of PE, current clinical prediction models overpredict further workup with CTPA to reduce missed PEs. The downside of this approach is the overreliance on CTPAs and decreased diagnostic yield of PEs, which results in greater patient exposure to contrast and ionizing radiation, contributes to increased patient time in the hospital, and worsens systemic inefficiencies. Furthermore, this CTPA utilization is more selectively increasing in older populations, who are at increased cancer risk from ionizing radiation.33
Our work represents an integrated deep learning approach on a clinically relevant subset of patients suspected of having acute PE. Past work integrating machine learning approaches to PE has relied on integrating EHR data on a smaller subset of CTPA images.14 This past work also relies on clinical data alone, while we provide the first integration of raw ECG waveforms and show that it improves outcome prediction. For example, we note that traditional ECG measurements such as QTc and QRS duration had an important influence on model output. But we also found that embeddings from raw ECG waveforms also had a large contribution on model prediction, suggesting thereby that these ECG signals provide information beyond what is contained in traditional ECG measurements. This is a novel finding and suggests that further work must be done to identify relevant clinical features our deep learning models are identifying from ECGs that otherwise remain indiscernible to clinicians. For example, we suspect that our framework may be picking up subtle electrocardiographic signs of increased predisposition to thrombus formation (such as morphologic characteristics representing underlying hypertensive heart disease) or more acute findings suggestive of subclinical PE manifestation (such as right heart strain). This, however, remains difficult to parse out and we are undergoing further post hoc analysis to better understand the implications of our model’s outputs.
Moreover, while deep learning-based systems may lack straightforward interpretation, we remain encouraged by patterns emerging from our outputs in analysis of the holdout data. First, we observe that our model demonstrates monotonically increasing performance in more proximal vascular territories, which have the most severe clinical implications.34 In previous machine learning-based analysis of PEs, it is unclear whether there was a differential preponderance for the detection of more anatomically relevant lesions. Second, we note that our interpretability analysis prioritized features traditionally associated with increased PE incidence and risk, including age, previous VTE, and vital sign abnormalities.35 The model also appropriately predicted lower PE likelihood in those with COPD, a feature inversely predictive of PE probability and a prominent feature of other PE prediction scores such as the 4PEPS algorithm.30 Third, our model performance is comparable across gender and race stratifications, likely reflective of the diverse population on which we trained our model. Increased representation of minority groups and women is imperative for increasing equity in artificial intelligence (AI) where White males tend to be overrepresented in training data.36 We additionally note that big data approaches, particularly ones relying on routinely collected EHR data, are often hampered by data quality issues, impeding the progress of algorithmic approaches. However, our extensive feature sensitivity experiments attest to the robustness of our framework, even in the setting of missing or noisy data. Indeed, even in the absence of strong prognostic markers such as D-dimer, our approach outperforms other available clinical prediction rules (Supplementary material online, Figure S11).
As a case study, we examined in greater detail a 53-year-old male patient with diabetes mellitus, hypertension, and chronic stable angina in our clinical validation cohort with a saddle PE. On admission, the patient’s chief complaint was substernal chest pain that began one day prior and resolved with nitroglycerine with a weeklong history of exertional fatigue, dyspnoea on exertion, and lightheadedness. His physical exam on admission was remarkable only for tachycardia (heart rate of 123) but notably without hypoxia, tachypnoea, or any lower extremity oedema or pain. While a troponin-I was normal at 0.16 ng/mL and BNP of 19.78 pg/mL, D-dimer was notably remarkably elevated at 13.7 µg/mL FEU. Sinus tachycardia with biatrial enlargement and new concordance of previously discordant T-waves in V5 and V6 were present on the admission ECG, while right ventricular hypokinesis was noted on bedside transthoracic echocardiography. In the absence of any reported oestrogen use, a history of recent immobilization or active cancer, haemoptysis, or other PE risk factors, this gentleman had remarkably low initial clinical likelihood scores for PE (Wells’ criteria of 1.5, Geneva score of 5, PERC of 2, and 4PEPS of 1). From admission notes, the clinical suspicion for PE from providers in the Emergency Department (ED) was low, with the triad of troponin, BNP, and D-dimer initially drawn non-specifically and CTPA diagnosis ascertained 10 h after presentation. However, both ECG (model output 0.26, threshold = 0.05), EHR (model output 0.18, threshold = 0.103), and fusion models (model output of 0.20, for both with and without admission labs as features) provided outputs well above their decision thresholds for recommending evaluation by CTPA (Table 2).
Our current study faces some limitations. First, given the retrospective nature of this dataset, the association of all input data modalities as being PE-positive and PE-negative within a specific time frame to strike an appropriate balance between missingness and timeliness remains a source of modelling error. While our framework attests to the value of combining ECG waveforms and routinely collected clinical data, data collection will need to reflect information more optimally at the point of presentation. However, this current framework may serve as an effective pre-trained scaffold for this future analysis. While overall discrimination was favourable for the fusion model, the model was only well-calibrated up until a moderate clinical predicted probability. This is consistent with the low overall prevalence of PE in our development data. It is also important to mention the limitation of comparing our models with the clinical scores, which have robust performance in the general ED population (where the bulk of the patients are at low suspicion of PE)30 but perform poorly in patients with an elevated pretest probability of PE.25 Since this dataset contains only patients who have already had CTPA and met some threshold for PE suspicion, the clinical scores have a poor performance. This comparison only serves to demonstrate how limited these scores are at discriminating moderate- to high-risk PE patients. But we have shown that our models can improve the performance for this group of patients. Inferences about how the model compares to the scores in a general ED population requires further research. Future work will focus on assessing the algorithm’s performance on patients with low suspicion for PE that were excluded by a negative D-dimer and ultimately never received a CTPA to compare against existing clinical scoring systems more accurately. Despite demonstrations of model robustness against missingness and cached clinician decision making, there is a risk that the institutional and provider bias in the diagnostic workup a patient undergoes, or just as importantly fails to undergo, has been embedded in this algorithm. However, it is difficult to discern whether the marginal loss in performance from feature ablation stems from inability to capitalize on this embedded clinical decision-making bias or an informative signal helping to provide information about the pathophysiological state of the patient. Given that clinical decision-making tools have existed for decades, we assumed that medically appropriate diagnostic workup was undertaken since our source data comes from an academic hospital that reflects the European Society of Cardiology (ESC) guidelines for PE diagnosis. To improve generalizability, we plan to validate the algorithm at external sites that have different patient populations, clinical workflows, and different data collection modalities (e.g. ECG machines, blood chemistry assays).
In summary, we present a fusion modelling framework that uses raw ECG waveforms and traditional clinical variables to predict acute PE more accurately and specifically than existing clinical scores in those patients with at least a moderate clinical suspicion of acute PE.
Supplementary material
Supplementary material is available at European Heart Journal – Digital Health online.
Acknowledgements
We acknowledge Manbir Singh and Mark Shervy with IT support. We thank Shelly Kaur and Yovanna Roa for administrative and project management support. We thank Zahi Fayad, Thomas Fuchs, Erwin Bottinger, and Alexander Charney for infrastructural support. We thank GE and Percy LaRosa, Adeyinka Fadehan, Thareesh Dondapati, and Ejaz Siddiqui for facilitating data access.
Funding
This study has been approved by the institutional review board at the Icahn School of Medicine at Mount Sinai. This study was supported by the National Center for Advancing Translational Sciences, National Institutes of Health (U54 TR001433-05). Dr Nadkarni is supported by National Institutes of Health grants: R01DK127139 from NIDDK and R01HL155915 from NHLBI.
Conflict of interest: S.S.S. is a co-founder of and owns equity in Monogram Orthopedics. J.N.N. is a scientific co-founder, consultant, advisory board member, and equity owner of Renalytix AI; a scientific co-founder and equity holder for Pensieve Health; a consultant for Variant Bio; and received grants from Goldfinch Bio and personal fees from Renalytix AI, BioVie, Reata, AstraZeneca, and GLG Consulting. B.S.G. is a consultant for Anthem AI and Prometheus Biosciences. All other authors have reported that they have no relationships relevant to the contents of this paper to disclose.
Data availability
The data underlying this article cannot be publicly shared due to HIPAA but may be shared on reasonable request to the corresponding author.
References
Seabold S, Perktold J. Statsmodels: econometric and statistical modeling with python. In: Proceedings of the 9th Python in Science Conference 2010 (Vol. 57, p. 61).
