


Abstract
The detection of white-coat hypertension/white-coat uncontrolled hypertension (WCH/WUCH) with out-of-office blood pressure (BP) monitoring is time- and resource-consuming. We aim to develop a machine learning (ML)-derived prediction model based on the characteristics of patients from a single outpatient visit.
Data from two cohorts in Taiwan were used. Cohort one (970 patients) was used for development and internal validation, and cohort two (464 patients) was used for external validation. WCH/WUCH was defined as an office BP of ≥140/90 mmHg and daytime ambulatory BP of <135/85 mmHg in treatment-naïve or treated individuals. Logistic regression, random forest (RF), eXtreme Gradient Boosting, and artificial neural network models were trained using 26 patient parameters. We used SHapley Additive exPlanations values to provide explanations for the risk factors. All models achieved great area under the receiver operating characteristic curve (AUROC), specificity, and negative predictive value in both validations (AUROC = 0.754–0.891; specificity = 0.682–0.910; negative predictive value = 0.831–0.968). The RF model was the best performing (AUROC = 0.884; sensitivity = 0.619; specificity = 0.887; negative predictive value = 0.872; accuracy = 0.819). The five most influential features of the RF model were office diastolic BP, office systolic BP, current smoker, estimated glomerular filtration rate, and fasting glucose level.
Our prediction models achieved good performance, underlining the feasibility of applying ML models to outpatient populations for the diagnosis of WCH and WUCH. Further validation with other prospective data sets should be considered in the future.
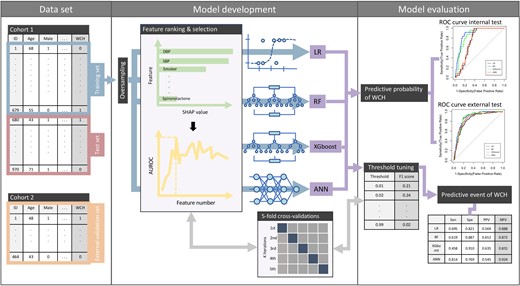
Two cohorts were used for model development after splitting and external validation respectively. With oversampled training set, four algorithms were developed through the process of feature ranking with SHapley Additive exPlantions values, feature selection, and threshold tuning under five-fold cross-validation. Models were then evaluated by variant metrics. Present study demonstrated the feasibility of applying machine learning models to outpatient population for the identify of white-coat hypertension and white-coat uncontrolled hypertension. ANN, artificial neural network; AUROC, area under the receiver operating characteristic curve; DBP, diastolic blood pressure; LR, logistic regression; NPV, negative predictive value; PPV, positive predictive value; RF, random forest; ROC, receiver operating characteristic; SBP, systolic blood pressure; Sen, sensitivity; SHAP, SHapley Additive exPlanations; Spe, specificity; WCH/WUCH, white-coat hypertension/white-coat uncontrolled hypertension; XGboost, eXtreme Gradient Boosting.
Introduction
White-coat hypertension (WCH) refers to patients whose blood pressure (BP) is elevated in the medical environment, but typically maintains a normal ambulatory or home BP.1,2 Approximately 10–30% of patients attending clinics due to high BP have WCH.3 Originally limited to untreated individuals, the concept of WCH has been generalized to individuals treated with antihypertensive drug(s) in which their BP fails to reach specified therapeutic targets, termed as white-coat uncontrolled hypertension (WUCH).2,4
Unlike the higher definite risks of cardiovascular disease (CVD) and all-cause mortality in individuals with masked hypertension or sustained hypertension (SH), the prognostic value of WCH/WUCH remains controversial.5–7 Current guidelines do not recommend the initiation or intensification of antihypertensive drug therapy for patients with WCH/WUCH.1,2 To prevent unnecessary treatment, it is recommended to screen for WCH before diagnosing hypertension and initiating pharmacological therapy.1,2,8 Having high variability of office BP, having elevated BP without evidence of target organ damage (TOD) or CVD, or pseudo-resistant hypertension are also recommended as clinical indications to diagnose WCH/WUCH.9
For the diagnosis of WCH/WUCH, the combined use of office BP monitoring and out-of-office BP monitoring, including 24 h ambulatory BP monitoring (ABPM) and home BP monitoring (HBPM), is required.1,2 ABPM, which has fewer measurement errors and provides nocturnal readings,2 is stated to be more desirable to screen for WCH than HBPM.1 However, ABPM is more time- and resource-consuming.10
The possibility of early identification of WCH/WUCH based on the clinical characteristics of a single outpatient visit is still unknown. Therefore, we aimed to derive new diagnostic machine learning (ML) prediction models to detect patients with WCH/WUCH in clinical settings. The developed models may facilitate enhanced diagnosis of WCH/WUCH.
Methods
Source of data and participants
The data for this study were derived from two cohorts. Cohort one was a nationwide prospective study of patients with hypertension. The study design and methods used on cohort one have been previously independently described.11 The inclusion and exclusion criteria of cohort one are listed in Supplementary material online, Material S1. A total of 1039 patients were enrolled from 2004 to 2005 from six medical centres in Taiwan. Among them, 69 patients who did not have complete ABPM data were excluded. Cohort two was a single-centre prospective cohort study of patients with hypertension. The study design and methods used on cohort two have been previously independently described.12 The inclusion and exclusion criteria of cohort two are listed in Supplementary material online, Material S2. A total of 575 patients were enrolled between February 2012 and November 2021 from the Taipei Veterans General Hospital. Among them, 111 patients who did not have complete ABPM data were excluded.
This study was performed in accordance to the tenets of the Declaration of Helsinki. The study protocol was approved by the ethics committee of the Taipei Veterans General Hospital. Written informed consent was obtained from all participants before data collection.
Study design
Data from cohort one was used to develop prediction models for identifying patients with WCH/WUCH and for internal validation. Data from cohort two was used for external validation. A flowchart of the study is shown in Figure 1.
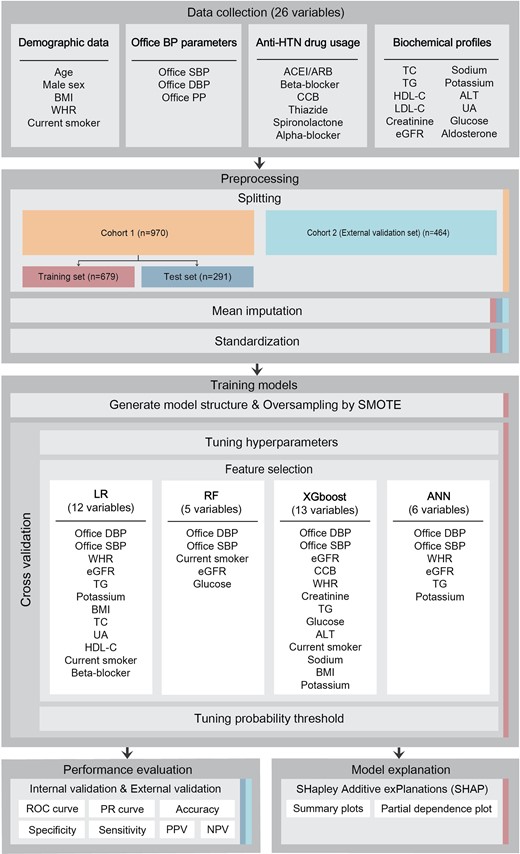
A flowchart of the study. The data set used in each step is indicated as coloured columns on the right side. Five-fold cross-validation was performed, respectively, in hyperparameter optimization, feature selection, and threshold-moving process. Twelve, five, thirteen, and six features were selected as final predictors in the LR, RF, XGboost, and ANN models, respectively, which are written in descending order of importance. ACEI/ARB, angiotensin-converting enzyme inhibitor/angiotensin receptor blocker; ALT, alanine aminotransferase; ANN, artificial neural network; Anti-HTN, anti-hypertensive; BMI, body mass index; BP, blood pressure; CCB, calcium channel blocker; DBP, diastolic blood pressure; eGFR, estimated glomerular filtration rate; HDL-C, high-density lipoprotein-cholesterol; LDL-C, low-density lipoprotein-cholesterol; LR, logistic regression; NPV, negative predictive value; PP, pulse pressure; PPV, positive predictive value; PR, precision-recall; SMOTE, synthetic minority oversampling technique; RF, random forest; ROC, receiver operating characteristic; SBP, systolic blood pressure; TC, total cholesterol; TG, triglyceride; UA, uric acid; WHR, waist-to-hip ratio; XGboost, eXtreme Gradient Boosting.
Outcome definition
WCH and WUCH were defined as having an office BP of ≥140/90 mmHg and a daytime ambulatory BP of <135/85 mmHg (definition A) in antihypertensive treatment-naïve and treated individuals, respectively. To explore whether our evaluation results were robust against varying definitions of WCH/WUCH using different BP indices, we further defined WCH and WUCH as having an office BP of ≥140/90 mmHg, 24 h ambulatory mean BP of <130/80 mmHg, daytime ambulatory BP of <135/85 mmHg, and night-time ambulatory BP of <120/70 mmHg (definition B) in antihypertensive treatment-naïve and treated individuals, respectively (see Supplementary material online, Table S1).
Candidate predictors
In total, 65 and 47 variables collected at baseline were considered for analysis in cohort one and two, respectively (see Supplementary material online, Table S2). The data collection protocol is described in Supplementary material online, Material S3. Based on the literature review,6,7,13,14 26 parameters that were routinely used as clinical markers, related to WCH/WUCH, and available in the external validation set were selected as candidate predictors (Figure 1), including (i) categorical variables (yes vs. no): male sex, current smoking status, angiotensin-converting enzyme inhibitor/angiotensin receptor blocker, beta-blocker, calcium channel blocker (CCB), thiazide, spironolactone, and alpha-blocker use; (ii) continuous variables: age, body mass index (BMI), waist-to-hip ratio (WHR), office systolic BP (SBP), office diastolic BP (DBP), office pulse pressure, total cholesterol (TC), triglyceride (TG), high-density lipoprotein-cholesterol (HDL-C), low-density lipoprotein-cholesterol, estimated glomerular filtration rate (eGFR), creatinine, sodium, potassium, alanine aminotransferase, uric acid, fasting glucose, and aldosterone.
Model development
Logistic regression (LR), random forest (RF), eXtreme Gradient Boosting (XGboost), and artificial neural network (ANN) were used as classifiers. All models were developed using Python (version 3.9.10, Python Software Foundation). The libraries and modules that were used are listed in Supplementary material online, Table S3.
The model development pipeline is illustrated in Figure 1. Splitting cohort one data was done randomly into training and test sets in a 0.7/0.3 ratio in a stratified manner so that the ratio of events (patients with WCH/WUCH) to non-events (patients without WCH/WUCH) in each split was identical to that of the entire data set. Missing continuous variable were filled in with the means of all available values for the same variable in the training set (three missing in cohort one and 66 missing in cohort two). All numerical variables in the data set passed to each model, no matter the training, test, or external validation sets, were scaled by subtracting the mean and then dividing by the standard deviation (SD) of the data set used to train each model.
We tuned the hyperparameters with a grid search in the LR and RF models and with a random search in the XGboost and ANN models. This was done by obtaining the uppermost area under the receiver operating characteristic curve (AUROC) in the LR, XGboost, and ANN models, and by obtaining the lowest out-of-bag score in the RF model. Features were ranked by importance based on SHapley Additive exPlanations (SHAP) values.15 Supervised feature selection was carried out to achieve the highest AUROC. We established a confusion matrix and calculated the F1 score while threshold-moving. The optimal probability threshold that yielded the largest F1 score was defined and published in the final models.
In the process of hyperparameter optimization, feature selection, and threshold-moving, we performed five-fold cross-validations on the training set, in which the synthetic minority oversampling technique was used to equalize the number of events and non-events.16 The test and external validation sets were always independent of the training and tuning processes during the development of the models.
Performance metrics
A confusion matrix was tallied after setting a classification threshold for the binary classifier. Probability metrics [sensitivity, specificity, positive predictive value (PPV), negative predictive value (NPV), and accuracy] and ranking [AUROC and average precision (AP)] aspects were used to evaluate overall performance.
Model explanation
SHAP values were used to quantify the association of a feature with the outcome of a single participant, which was calculated to provide attribution values for each feature within the RF model. SHAP summary and partial dependence plots for each predictor variable were constructed.
Statistical analysis
Continuous variables were expressed as means ± SD. Categorical variables were expressed as frequencies and proportions. Comparisons between cohort one and two were performed using unpaired Student’s t-tests, Mann–Whitney U tests, and χ2 tests for continuous parametric variables, continuous non-parametric variables, and categorical variables, respectively. One-way ANOVA or Mann–Whitney U tests were used to compare continuous variables. χ2 or Fisher’s exact tests were used to compare categorical variables between the training and test sets. Spearman's rank correlation coefficients were calculated for the 26 candidate predictors. Data were analysed using SPSS software (version 21.0, SPSS Inc., Chicago, IL, USA) or RStudio (version 1.3.1056, RStudio, PBC, Boston, MA, USA). Statistical significance was defined as a two-sided P-value of < 0.05.
Sensitivity analyses
Several sensitivity and subgroup analyses were performed to better understand the generalizability of the developed models and statistical interactions. First, definition B of WCH/WUCH was applied. Second, we conducted age stratification for subjects aged <50 years and those aged ≥50 years. Finally, subgroup analyses for inclusion scenarios were performed, such as individuals with a BMI of ≥27 kg/m2 or fasting glucose level of ≥100 mg/dL.17 We estimated sensitivity, specificity, PPV, NPV, accuracy, AUROC, and AP (see Supplementary material online, Material S4).
Results
Baseline characteristics of participants
The clinical and biochemical characteristics of the study participants are shown in Table 1. In cohort one, all participants were aged 20–50 years and had BMI ≤35 kg/m2. In cohort two, there were 358 (77.2%) participants aged >50 years and 12 (2.6%) participants having BMI >35 kg/m2.
Baseline characteristics and the proportion of WCH/WUCH
| Cohort 1 | Cohort 2 (n = 464) | P-valued | P-valuee | |||
|---|---|---|---|---|---|---|
| Training set (n = 679) | Test set (n = 291) | All (n = 970) | ||||
| Demographic data | ||||||
| Age, mean (SD), years | 41.1 (7.2) | 40.9 (7.1) | 41.0 (7.2) | 61.0 (14.2) | 0.583 | <0.001c |
| Male sex, no. (%) | 466 (68.6%) | 198 (68.0%) | 664 (68.5%) | 266 (57.3%) | 0.856 | <0.001c |
| BMI, mean (SD), kg/m2 | 26.5 (3.4) | 26.6 (3.5) | 26.5 (3.4) | 26.1 (3.7) | 0.657 | 0.065 |
| WHR, mean (SD), % | 87.4 (6.0) | 88.0 (6.3) | 87.6 (6.1) | 91.0 (7.3) | 0.182 | <0.001c |
| Current smoker, no. (%) | 164 (24.2%) | 68 (23.4%) | 232 (23.9%) | 22 (4.7%) | 0.793 | <0.001c |
| Office BP parameters | ||||||
| Office SBP, mean (SD), mmHg | 126.4 (14.6) | 125.5 (14.3) | 126.1 (14.5) | 131.3 (16.6) | 0.352 | <0.001c |
| Office DBP, mean (SD), mmHg | 85.3 (11.3) | 84.1 (12.6) | 84.9 (11.7) | 81.8 (10.5) | 0.163 | <0.001c |
| Office PP, mean (SD), mmHg | 41.1 (9.9) | 41.3 (9.5) | 41.2 (9.8) | 49.5 (14.4) | 0.761 | <0.001c |
| Antihypertensive drug usage | ||||||
| ACEI/ARB, no. (%) | 292 (43.0%) | 118 (40.5%) | 410 (42.3) | 307 (66.2%) | 0.478 | <0.001c |
| Beta-blocker, no. (%) | 305 (44.9%) | 132 (45.4%) | 437 (45.1%) | 109 (23.5%) | 0.899 | <0.001c |
| CCB, no. (%) | 298 (43.9%) | 107 (36.8%) | 405 (41.8%) | 344 (74.1%) | 0.039c | <0.001c |
| Thiazide, no. (%) | 109 (16.1%) | 48 (16.5%) | 157 (16.2%) | 89 (19.2%) | 0.864 | 0.366 |
| Spironolactone, no. (%) | 7 (1.0%) | 0 (0.0%) | 7 (0.7%) | 6 (1.3%) | 0.082 | 0.169 |
| Alpha-blocker, no. (%) | 16 (2.4%) | 6 (2.1%) | 22 (2.3%) | 21 (4.5%) | 0.778 | 0.062 |
| Biochemical profiles | ||||||
| TC, mean (SD), mg/dL | 194.7 (34.6) | 198.3 (37.2) | 195.8 (35.4) | 184.0 (30.8) | 0.161 | <0.001c |
| TG, mean (SD), mg/dL | 164.4 (112.0) | 170.1 (112.7) | 166.1 (112.2) | 127.7 (80.4) | 0.465 | <0.001c |
| HDL-C, mean (SD), mg/dL | 45.5 (11.9) | 45.3 (12.5) | 45.4 (12.1) | 49.0 (13.1) | 0.825 | <0.001c |
| LDL-C, mean (SD), mg/dL | 124.9 (30.8) | 128.3 (32.7) | 126.0 (31.4) | 111.8 (27.1) | 0.131 | <0.001c |
| Creatinine, mean (SD), mg/dL | 0.8 (0.2) | 0.8 (0.2) | 0.8 (0.2) | 0.9 (0.2) | 0.955 | 0.966 |
| Biochemical profiles (continued) | ||||||
| eGFR, mean (SD), mL/min/1.73 m2 | 129.9 (38.5) | 128.1 (37.8) | 129.4 (38.3) | 87.2 (19.4) | 0.499 | <0.001c |
| Sodium, mean (SD), mmol/L | 141.2 (2.7) | 141.4 (2.5) | 141.3 (2.6) | 140.9 (2.4) | 0.239 | 0.021c |
| Potassium, mean (SD), mmol/L | 4.0 (0.3) | 4.1 (0.3) | 4.0 (0.3) | 3.9 (0.6) | 0.046c | <0.001c |
| ALT, mean (SD), U/L | 27.4 (19.2) | 27.9 (19.4) | 27.6 (19.3) | 26.1 (16.4) | 0.747 | 0.371 |
| UA, mean (SD), mg/dL | 6.6 (1.7) | 6.7 (1.7) | 6.6 (1.7) | 6.0 (1.5) | 0.296 | <0.001c |
| Fasting glucose, mean (SD), mg/dL | 98.1 (9.4) | 98.1 (8.7) | 98.1 (9.2) | 100.7 (18.4) | 0.993 | <0.001c |
| Aldosterone, mean (SD), pg/mL | 223.7 (109.5) | 232.9 (144.4) | 226.5 (121.0) | 122.6 (31.6) | 0.327 | <0.001c |
| Ambulatory BP parameters | ||||||
| 24 h SBP, mean (SD), mmHg | 123.4 (12.4) | 122.9 (11.6) | 123.2 (12.2) | 121.5 (11.4) | 0.603 | 0.029c |
| 24 h DBP, mean (SD), mmHg | 82.8 (9.5) | 81.9 (9.5) | 82.6 (9.5) | 73.1 (8.3) | 0.176 | <0.001c |
| Daytime SBP, mean (SD), mmHg | 126.1 (13.0) | 125.9 (12.1) | 126.1 (12.7) | 123.4 (11.7) | 0.790 | 0.001c |
| Daytime DBP, mean (SD), mmHg | 85.2 (10.0) | 84.3 (9.8) | 84.9 (9.9) | 74.7 (8.5) | 0.211 | <0.001c |
| Night-time SBP, mean (SD), mmHg | 114.3 (12.9) | 113.3 (12.4) | 114.0 (12.8) | 117.0 (12.9) | 0.258 | <0.001c |
| Night-time DBP, mean (SD), mmHg | 75.1 (9.8) | 74.0 (10.4) | 74.7 (10.0) | 69.4 (9.3) | 0.130 | <0.001c |
| WCH/WUCH by definition Aa, no. (%) | 55 (8.1%) | 24 (8.2%) | 79 (8.1%) | 118 (25.4%) | 0.939 | <0.001c |
| WCH/WUCH by definition Bb, no. (%) | 17 (2.5%) | 8 (2.7%) | 25 (2.6%) | 45 (9.7%) | 0.825 | <0.001c |
ACEI/ARB, angiotensin-converting enzyme inhibitor/angiotensin receptor blocker; ALT, alanine aminotransferase; BMI, body mass index; BP, blood pressure; CCB, calcium channel blocker; DBP, diastolic blood pressure; eGFR, estimated glomerular filtration rate; HDL-C, high-density lipoprotein-cholesterol; LDL-C, low-density lipoprotein-cholesterol; PP, pulse pressure; SBP, systolic blood pressure; TC, total cholesterol; TG, triglyceride; UA, uric acid; WCH/WUCH, white-coat hypertension/white-coat uncontrolled hypertension; WHR, waist-to-hip ratio; XGboost, eXtreme Gradient Boosting.
WCH/WUCH by definition A: office BP ≥140/90 mmHg and daytime ambulatory BP <135/85 mmHg.
WCH/WUCH by definition B: office BP ≥140/90 mmHg and 24 h ambulatory mean BP <130/80 mmHg and daytime ambulatory BP <135/85 mmHg and night-time ambulatory BP <120/70 mmHg.
Differences were considered significant when P < 0.05.
P-value between the training set and test set.
P-value between the cohort one and cohort two.
A total of 970 participants were included in cohort one, of which 79 (8.1%) had a confirmed diagnosis of WCH/WUCH according to definition A. Characteristics of the participants in the training and test sets were similar, except for higher potassium levels (4.1 vs. 4.0 mmol/L; P = 0.046) and lower CCB usage (36.8 vs. 43.9%; P = 0.039) in the test set vs. the training set. While participants in the training set were taking more spironolactone than those in the test set (1.0 vs. 0.0%; P = 0.082), it was not statistically significant.
A total of 464 participants were included in cohort two, of which 118 (25.4%) had a confirmed diagnosis of WCH/WUCH according to definition A. Most of the participant characteristics were different between the two cohorts, including the proportion of WCH/WUCH in each. A heatmap showing Spearman's correlation coefficients with significance levels of pairwise comparisons between the variables is presented in Supplementary material online, Figure S1.
Model specification and feature selection
The tuned hyperparameters are presented in Supplementary material online, Table S4. A matrix plot for the RF model is shown in Supplementary material online, Figure S2, revealing the top five out of 26 parameters that considerably contributed to the model. Specifically, office DBP, office SBP, current smoker, eGFR, and fasting glucose level. A plot showing model performance vs. complexity is shown in Supplementary material online, Figure S3. The selected predictors for each final model are shown in Figure 1 and Supplementary material online, Table S5. The optimal probability thresholds for the LR, RF, XGboost, and ANN models were 0.51, 0.50, 0.46, and 0.48, respectively. Supplementary material online, Figures S4 and S5 include decision tree plots of the RF and XGboost models. Performance metrics of the four models in the training set were presented in Supplementary material online, Table S6.
Model performance—internal validation
For the receiver operating characteristic (ROC) curve and precision-recall (PR) curve analyses (Figure 2A and C), the RF model achieved the greatest AUROC (0.891), and AP (4.2 times compared with the baseline) among the four models. Performance metrics comparing the four models are shown in Table 2. The highest overall performance was achieved in the RF model, with a specificity of 0.906, NPV of 0.953, and accuracy of 0.873. However, the PPV was very low in all models. A confusion matrix for the RF model is presented in Supplementary material online, Table S7.
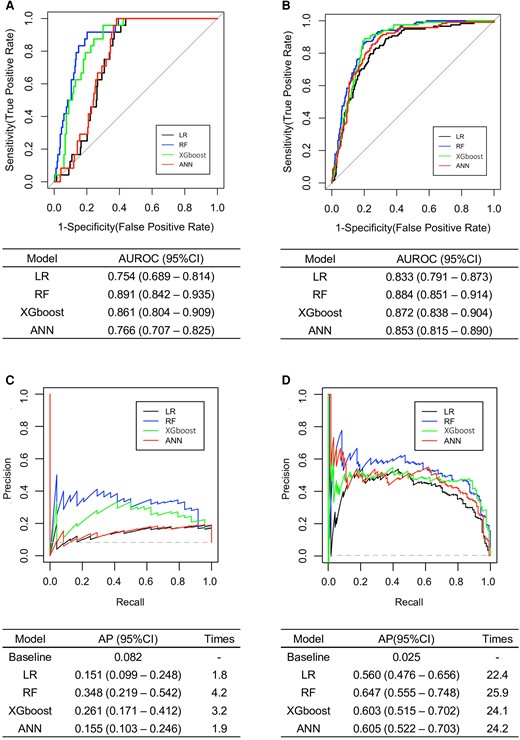
Comparison of the AUCs among machine learning models for WCH/WUCH prediction by definition A. RF yielded the greatest AUCs. The grey dashed line represents baseline AP, which is defined by the total number of events over the total number of data in the data set. ‘Times’ refers to the AP value of each individual model divided by the baseline AP. (A) ROC curves and AUROCs for internal validation. (B) ROC curves and AUROCs for external validation. (C) PR curves and APs for internal validation. (D) PR curves and APs for external validation. ANN, artificial neural network; AP, average precision; AUC, area under the curve; AUROC, area under the receiver operating characteristic curve; CI, confidence interval; LR, logistic regression; PR, precision-recall; RF, random forest; WCH/WUCH, white-coat hypertension/white-coat uncontrolled hypertension; XGboost, eXtreme Gradient Boosting.
Performance metrics among the developed models for WCH/WUCH prediction by definition Aa
| Model | Sensitivity (95% CI) | Specificity (95% CI) | PPV (95% CI) | NPV (95% CI) | Accuracy (95% CI) | |
|---|---|---|---|---|---|---|
| Internal validation | LR | 0.625 (0.431–0.819) | 0.734 (0.681–0.787) | 0.174 (0.094–0.255) | 0.956 (0.928–0.984) | 0.725 (0.674–0.776) |
| RF | 0.500 (0.300–0.700) | 0.906 (0.871–0.941) | 0.324 (0.173–0.475) | 0.953 (0.927–0.979) | 0.873 (0.835–0.911) | |
| XGboost | 0.458 (0.259–0.658) | 0.910 (0.876–0.944) | 0.314 (0.160–0.468) | 0.949 (0.922–0.976) | 0.873 (0.835–0.911) | |
| ANN | 0.750 (0.577–0.923) | 0.682 (0.626–0.738) | 0.175 (0.101–0.248) | 0.968 (0.943–0.993) | 0.687 (0.634–0.741) | |
| External validation | LR | 0.695 (0.612–0.778) | 0.821 (0.780–0.861) | 0.569 (0.489–0.650) | 0.888 (0.853–0.922) | 0.789 (0.752–0.826) |
| RF | 0.619 (0.531–0.706) | 0.887 (0.854–0.921) | 0.652 (0.564–0.740) | 0.872 (0.837–0.907) | 0.819 (0.784–0.854) | |
| XGboost | 0.458 (0.368–0.548) | 0.910 (0.880–0.940) | 0.635 (0.533–0.738) | 0.831 (0.793 − 0.869) | 0.795 (0.759–0.832) | |
| ANN | 0.814 (0.743–0.884) | 0.769 (0.724–0.813) | 0.545 (0.472–0.619) | 0.924 (0.893–0.954) | 0.780 (0.742–0.818) |
ANN, artificial neural network; CI, confidence interval; LR, logistic regression; NPV, negative predictive value; PPV, positive predictive value; RF, random forest; WCH/WUCH, white-coat hypertension/white-coat uncontrolled hypertension; XGboost, eXtreme Gradient Boosting.
WCH/WUCH by definition A: office BP ≥140/90 mmHg and daytime ambulatory BP <135/85 mmHg.
Model performance—external validation
Both ROC and PR curve analyses revealed reliable performance among the four models with no significant differences from the internal validation (Figure 2B and D). The RF model exhibited the greatest AUROC (0.884) and AP (25.9 times compared with the baseline). The highest overall performance was also achieved in the RF model, with a specificity of 0.887, NPV of 0.872, and accuracy of 0.819 (Table 2). A confusion matrix for the RF model is reported in Supplementary material online, Table S7.
Model explanation
To identify the features that influenced the prediction model the most, we conducted a SHAP summary plot of the RF model (Figure 3). This plot depicts how high and low feature values were related to the SHAP values in the training set. Partial dependence plots were used to understand how a single feature affects the output of the RF model (see Supplementary material online, Figure S6).
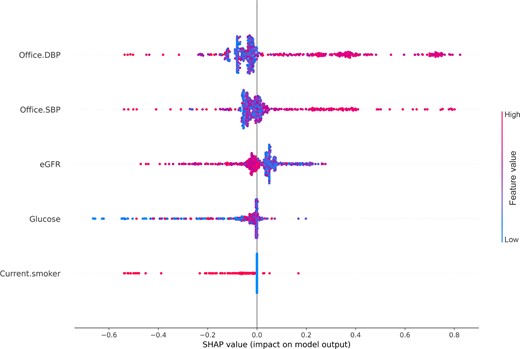
A SHAP summary plot of the top five features of the RF model. The higher the SHAP value of a feature, the higher the probability of WCH/WUCH. A dot is used for each feature attribution value for the model of each participant. The dots are coloured according to the values of the features for the participant and accumulate vertically to depict density. The features are arranged from top to bottom in descending order of importance, accessed by these five features only. DBP, diastolic blood pressure; eGFR, estimated glomerular filtration rate; SBP, systolic blood pressure; SHAP, SHapley Additive exPlanation; WCH/WUCH, white-coat hypertension/white-coat uncontrolled hypertension.
Sensitivity analyses
The sensitivity analyses presented in Table 3 show how the performance of the RF model when using the alternative WCH/WUCH by definition B, was similar to that by definition A (AUROC of 0.831, specificity of 0.802, NPV of 0.955, and accuracy of 0.787 in the external validation set). The performance of the RF model in subgroup analysis based on (i) age ≥50 years (n = 368), (ii) BMI ≥27 kg/m2 (n = 177), (iii) fasting glucose ≥100 mg/dL (n = 204), and (iv) fasting glucose ≥100 mg/dL, or age ≥50 years, or BMI ≥27 kg/m2 (n = 425) was similar to that of the main model (AUROC of 0.855–0.899, specificity of 0.860–0.888, NPV of 0.842–0.874, and accuracy of 0.785–0.821) (Table 3; Supplementary material online, Material S5).
Performance of the RF model for WCH/WUCH prediction in sensitivity and subgroup analyses
| Sensitivity (95% CI) | Specificity (95% CI) | PPV (95% CI) | NPV (95% CI) | Accuracy (95% CI) | AUROC (95% CI) | AP (95% CI) | |
|---|---|---|---|---|---|---|---|
| WCH/WUCH by definition Bb prediction | |||||||
| Test set | 0.500 (0.154 − 0.846) | 0.883 (0.846 − 0.921) | 0.108 (0.008 − 0.208) | 0.984 (0.969 − 1.000) | 0.873 (0.835 − 0.911) | 0.874 (0.764 − 0.957) | 0.160 (0.059 − 0.409) |
| External validation set | 0.644 (0.505 − 0.784) | 0.802 (0.764 − 0.840) | 0.259 (0.178 − 0.340) | 0.955 (0.933 − 0.976) | 0.787 (0.749 − 0.824) | 0.831 (0.785 − 0.873) | 0.253 (0.186 − 0.382) |
| WCH/WUCH by definition Aa prediction in subgroups in the external validation set | |||||||
| Age ≥ 50 years | 0.626 (0.531 − 0.722) | 0.888 (0.851 − 0.926) | 0.674 (0.578 − 0.770) | 0.866 (0.826 − 0.906) | 0.818 (0.779 − 0.857) | 0.899 (0.866 − 0.928) | 0.722 (0.625 − 0.812) |
| BMI ≥ 27 kg/m2 | 0.583 (0.444 − 0.723) | 0.860 (0.801 − 0.920) | 0.609 (0.468 − 0.750) | 0.847 (0.786 − 0.909) | 0.785 (0.725 − 0.846) | 0.855 (0.795 − 0.907) | 0.635 (0.504 − 0.773) |
| Fasting glucose ≥ 100 mg/dL | 0.629 (0.509 − 0.749) | 0.866 (0.810 − 0.922) | 0.672 (0.552 − 0.793) | 0.842 (0.783 − 0.902) | 0.794 (0.739 − 0.850) | 0.873 (0.823 − 0.917) | 0.687 (0.564 − 0.803) |
| Fasting glucose ≥ 100 mg/dL, or age ≥ 50 years, or BMI ≥ 27 kg/m2 | 0.640 (0.550 − 0.729) | 0.885 (0.850 − 0.921) | 0.664 (0.574 − 0.753) | 0.874 (0.838 − 0.911) | 0.821 (0.785 − 0.858) | 0.895 (0.865 − 0.924) | 0.708 (0.608 − 0.792) |
AP, average precision; AUROC, area under the receiver operating characteristic curve; BMI, body mass index; CI, confidence interval; NPV, negative predictive value; PPV, positive predictive value; RF, random forest; WCH/WUCH, white-coat hypertension/white-coat uncontrolled hypertension.
WCH/WUCH by definition A: office BP ≥140/90 mmHg and daytime ambulatory BP <135/85 mmHg.
WCH/WUCH by definition B: office BP ≥140/90 mmHg and 24 h ambulatory mean BP <130/80 mmHg and daytime ambulatory BP <135/85 mmHg and night-time ambulatory BP <120/70 mmHg.
Discussion
We developed and validated four ML algorithms using 26 clinical and biochemical patient parameters obtained during single outpatient visits to predict WCH/WUCH. All models exhibited relatively high AUROC, specificity, NPV, and accuracy. Among them, the RF model had the best overall performance, with the greatest AUROC and AP values. This presents a novel method to complement WCH/WUCH screening in both outpatient and public health settings.
Evidence to date suggests that WCH carries a higher cardiovascular (CV) risk when compared with normotension.4,18,19 Aside from increased CV risk, studies have shown that WCH is also associated with TOD, such as end stage renal disease in non-dialysis chronic kidney disease patients.20 Moreover, the risk of progression to SH is significantly higher in patients with WCH.21 In order to avoid CVD, TOD, and progression to SH, enhanced efficient and cost-effective methods are required for the early identification of WCH.
Identifying WUCH is also an important issue. Previous studies have identified that individuals with WUCH are prone to out-of-office hypotension when exposed to overtreating.22 However, a meta-analysis conducted by Huang et al. found that neither the risk of CV events nor total mortality increased in association with WUCH.18 Evidently, a prediction model aiding in the identification of patients with WUCH could potentially reduce unnecessary treatment intensification.9
Previous studies have shown the potential benefits of ML in the field of arterial hypertension. However, the application of ML in hypertension diagnosis or classification is still limited.23 To the best of our knowledge, the present study is the first to report the development and evaluation of ML prediction models for WCH/WUCH. These models achieved reasonable discrimination in an external validation set, highlighting the applicability of these models in outpatient settings.
To prevent WCH/WUCH misdiagnosis that could potentially lead to inappropriate treatments, the selection of our models aimed to optimize for higher specificity rather than sensitivity. However, it is also critical to achieve a balance between sensitivity and specificity. Consequently, although the XGboost model had the highest specificity, its apparent deficiency in sensitivity made it unsuitable for WCH/WUCH identification (Table 2). Accordingly, the RF model was considered more applicable and practical for use in real-world settings as it has comparably high specificity and sensitivity.
Higher prevalence of WCH/WUCH may lead to a higher PPV in the external validation set in the present study. However, the prevalence of WCH/WUCH by definition A in cohort two (25.4%) was most similar to other reports,3,24 which implies that the performance of the external validation set better reflects the generalizability of our results. Since the participants in cohort one were significantly younger than those in cohort two, only 8.1% of participants in cohort one had WCH/WUCH by definition A. The finding is compatible with a previous study which reported that the prevalence of WCH increases exponentially with age.25 This could potentially contribute to the fact that the increase of SBP with age is greater for office than for out-of-office BPs.26
In the present study, we included variables previously reported to be associated with WCH/WUCH, such as old age, female sex, non-smoking status, obesity, higher TC, higher TG, and lower HDL-C levels.6,7,13,14 In all models, office DBP, office SBP, and eGFR were chosen as predictors. Current smoker, TG, WHR, and potassium levels were chosen in three models (see Supplementary material online, Table S5). Office DBP, current smoker, beta-blocker use, and TG levels were also confirmed as independent predictors of WCH/WUCH in univariate and multivariate LR analysis (see Supplementary material online, Tables S8 and S9). However, there were no differences in the percentage of WCH/WUCH in female vs. male participants in the present study (see Supplementary material online, Table S10).
The kidneys are vital organs that contribute to the stability of BP. There are differences between eGFR in the two cohorts, which may be due to the inter-cohort differences in age, comorbidities, and medication. In the SHAP analysis of the RF model, a lower eGFR level was associated with an increased risk of experiencing the white-coat effect (see Supplementary material online, Figure S6C). A study by Wang et al. discovered that 24 h SBP variability increased with a decline in eGFR.27 Further studies are still required to elucidate the possible mechanisms related to renal function decline and the development of WCH/WUCH.
In the present study, we found that smokers were less likely to experience the white-coat effect (see Supplementary material online, Figure S6E). Smoking is considered as an important contributing factor to SH. Nicotine, an adrenergic agonist found in cigarettes, mediates catecholamine and vasopressin release, which may result in persistently elevated BP. Therefore, smokers may present with less differences between out-of-office and office BPs. This finding is also consistent to that of a previous study.6
Notably, we found TG levels to be another risk factor for WCH/WUCH. The white-coat effect was reported to be associated with dysmetabolic factors.7,13,14 Johansson et al. found that dyslipidaemia problems in the form of higher TG and cholesterol levels were higher among WCH patients when compared with normotensive patients when analysed by age, sex, and home SBP.13 Cuspidi et al. observed a greater age-adjusted and sex-adjusted risk of new-onset metabolic syndrome in patients with WCH, identified by either office/ambulatory or office/home measurements.14 This indicates that there might be an intricate interplay between WCH and metabolic dysfunction, which may explain the elevated CV risk observed in WCH patients.
Although beta-blocker use was not selected as a predictor in the models, it was a significant parameter in the multivariate LR analysis (see Supplementary material online, Table S9). Previous studies have shown that compared with normotensive patients, patients with WCH are associated with increased peripheral sympathetic nerve activity, which is also seen in patients with SH.28 Another important factor is anxiety. Previous studies have shown that patients with anxiety are more likely to experience the white-coat effect.29 Although not routinely prescribed to reduce stress or relieve anxiety, some beta-blockers such as propranolol and atenolol have been used as off-label anxiolytics for social and performance anxiety. Patients with hypertension and anxiety are more likely to be prescribed beta-blockers to control their BP, with an additional benefit of stress relief. However, since they are currently not approved as standard medication for anxiety control, their significance may not be as prominent as it should be in the current models. Further studies are required to confirm the effects of beta-blockers on WCH/WUCH.
The American College of Cardiology/American Heart Association (ACC/AHA) guidelines define WCH/WUCH as patients with office BP of ≥130/80 mmHg and daytime ABPM of <130/80 mmHg or home BP of <130/80 mmHg.1 However, the European Society of Cardiology/European Society of Hypertension (ESC/ESH) guidelines define WCH/WUCH as patients with office BP of ≥140/90 mmHg and 24 h ABPM of <130/80 mmHg and/or home BP of <135/85 mmHg.2,10 We tested our models using the BP cut-offs according to the ACC/AHA guidelines in Supplementary material online, Table S11, but this achieved poorer results. This may be explained by the fact that the definition by the ACC/AHA offers no buffer zone for patients with daytime ABPM in the range of 131 − 139/81 − 89 mmHg unlike the ESC/ESH definition, which makes ML hard to fine tune.
Strengths and limitations
Our study has several strengths. First, through external validation of a different group of participants with high dissimilarity, we demonstrated the applicability of our models to outpatient settings. Second, SHAP values were used to uncover the black box of ML. Other than raking the importance of variables, SHAP values can inform us on the magnitude and direction of the impact that each variable has on the prediction of WCH/WUCH. Third, not only was ROC curve analysis used for performance evaluation, but we also conducted PR curve analysis. This prevents an excessively optimistic view of the performance provided by the ROC curve in imbalanced binary classification models.30 Lastly, we performed sensitivity analyses to explore whether our evaluation results were robust against varying BP cut-offs and inclusion scenarios.
This study also has several limitations. First, our analyses included relatively few participants. Data from more diverse populations, with better comprehensive distribution of participant characteristics, and a larger sample size including more untreated patients must be obtained to demonstrate better transportability. Second, the data from cohort two came from a single centre. Multi-centred data should be obtained in the future to confirm the applicability of our model. Third, BP measurements were taken via different monitors in cohorts one and two. This was because Omega 1400 NBP used in cohort one was no longer available when cohort two was examined. However, both Omega 1400 NBP and Omron HEM-7121 are Taiwan Food and Drug Administration approved (license numbers 026021 and 007137, respectively), guaranteeing the reliability of both devices. Fourth, we combined WCH and WUCH as outcomes in our models despite the differences in the pathophysiology and aetiology behind them. Further studies are required to develop prediction models that can detect WCH and WUCH separately. Fifth, HBPM was not included in the diagnostic criteria for WCH/WUCH, potentially indicating that some WCH/WUCH cases may have been missed. Sixth, the predictive ability of the models might be impaired by the relatively small number of events recorded in the patient cohorts. Seventh, the mean office SBP and DBP were relatively normal in the two cohorts (Table 1). However, the majority of participants had office SBP ≥130 mmHg or office DBP ≥80 mmHg (69.5% in cohort one and 72.0% in cohort two) (see Supplementary material online, Table S12). Furthermore, more than one-third of participants had office SBP ≥140 mmHg or office DBP ≥90 mmHg (36.3% in cohort one and 37.5% in cohort two) (see Supplementary material online, Table S12). Although the present study demonstrated acceptable results in patients with relatively normal mean office BP, further studies are needed to confirm the applicability of the current models to other cohorts with different ranges of office BPs. Finally, some variables related to WCH/WUCH were not included in our study. For example, we did not collect data regarding urine metabolites in cohort two, and thus were unable to analyse this parameter. In the future, these models could be further optimized by including more variables, and then validated in prospective cohort studies. As such, we aim to provide the physicians with an easier and more user-friendly approach to calculate the risks by convert the current models to web or smartphone-based applications.
Conclusion
This study successfully demonstrated that ML prediction models are capable of detecting populations more prone to the white-coat effect. Patients can be assessed during a single outpatient visit, making the models readily applicable to clinical settings. The RF model yielded the best overall results and could potentially assist physicians in the early diagnosis of patients at higher risks of WCH/WUCH.
Authors’ contributions
Concept and design: L.-C.S., Y.-C.W., M.-H.H. and C.-C.H. Acquisition, analysis, or interpretation of data: All authors. Drafting the manuscript: All authors. Critical revision of the manuscript for important intellectual content: C.-C.H. Statistical analysis: L.-C.S., Y.-C.W., M.-H.H., H.C. and C.-C.H. Supervision: C.-C.H.
Role of the funder/sponsor
The funders had no role in the design and conduct of the study; collection, management, analysis, and interpretation of the data; preparation, review, or approval of the manuscript; and decision to submit the manuscript for publication.
Supplementary material
Supplementary material is available at European Heart Journal – Digital Health online.
Funding
We appreciate the funding provided by all the funders. This work was supported by research grants V101B-004, V102B-024, V103C-019, V111C-086, V111D63-002-MY2-1, and 111EA-014 from Taipei Veterans General Hospital, Taipei, Taiwan, ROC, and research grants MOST108-2314-B-075-062-MY3 and MOST111-2314-B-075-008-MY3 from the Ministry of Science and Technology, Taiwan, ROC.
Data availability
As the study involves human participants, the data from this study is held securely at the Taipei Veterans General Hospital and cannot be made freely available in the manuscript, the appendix, or a public repository. Although confidential agreements prevent public access of the data set, access might be granted for specific uses. Proposals should be directed to [email protected].
References
Author notes
Joint first authors.
Conflict of interest: None declared.
