


Abstract
We conducted a network meta-analysis (NMA) to determine the effects of low-dose (20 mg/day or less) conventional statin therapy (CST) and high-dose (40 mg/day or more) intensive statin therapy (IST) on the frequency of Tregs and their associated cytokines (IFN-γ, IL-10, TGF-β) compared with control.
PubMed, Cochrane Library, and EMBASE databases were searched for randomized clinical trials (RCTs) to identify relevant articles published until June 2021. We pooled data extracted from the included studies using the standardized mean difference (SMD). A random-effects model was used to conduct this NMA. Heterogeneity was evaluated using Cochran's Q test and the I2 test. The Grading of Recommendations, Assessment, Development and Evaluations (GRADE) was used to assess the quality of the study. Data analysis was conducted using R software.
A total of 505 patients were enrolled in the five RCTs. NMA indicated a significant increase in Treg frequency in the CST group compared with the control group (SMD 1.77; 95% CI: 0.77–2.76; P = 0.0005) and a larger increase in the Treg frequency associated with the IST group compared with the control group (SMD 2.12; 95% CI: 1.15–3.10; P-value < 0.0001). However, there was significant heterogeneity and inconsistency among the included studies [τ2 = 0.6096; τ = 0.7808; I2 = 91.2% (80.5%; 96.0%)]. When compared with control, both CST and IST increased the levels of secreted IL-10 (SMD 2.69; 95% CI: 2.07–3.31; P-value < 0.0001 and SMD 2.14; 95% CI: 1.76–2.52; P-value < 0.0001). Compared with the control group, CST was associated with increased levels of TGF-β (SMD 3.83; 95% CI: 0.63–7.0; P-value = 0.0189); this association was not seen in the IST group. IFN-γ levels decreased significantly in both the IST and CST groups (SMD −1.52; 95% CI: −1.94–1.10; P-value < 0.0001 and SMD −2.34; 95% CI: −2.73–1.95; P-value < 0.0001, respectively).
The findings of our study indicated that both high- and low-dose statin groups increased Treg frequency compared with the control group. IST demonstrated greater benefits than CST. Furthermore, statin therapy increased IL-10 and TGF-β levels and decreased IFN-γ levels. Overall, these results have significant implications for patients with ACS who would benefit from Treg-induced immunomodulatory balance.
Introduction
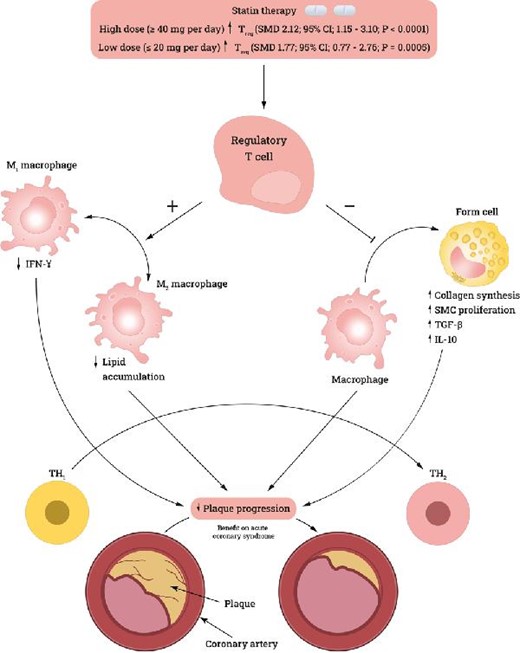
Hypercholesterolemia is a major risk factor for cardiovascular disease (CVD). Therefore, reducing blood lipid levels in patients with a history of CVD or patients with no history of CVD is an important pharmaceutical objective.1 Statins inhibit 2-hydroxy-3-methylglutaryl-CoA reductase, inhibiting cholesterol synthesis and consequently upregulating LDL receptor expression on hepatocytes, increasing LDL uptake and decreasing serum LDL levels. Studies suggest that, in addition to their direct role in reducing blood LDL levels, statins demonstrate immunomodulatory effects.2 One immunomodulatory mechanism of statins is that they increase T-regulatory cell (Treg) frequency and facilitate their immunosuppressive action.2 Through this mechanism, statins promote an anti-inflammatory environment and reduce atherosclerotic plaque development and progression.2
Another study suggested that atorvastatin, a popular statin, induces STAT6 phosphorylation and production of anti-inflammatory T-helper 2 (Th2) cytokines, such as TGF-β and IL-10. Furthermore, atorvastatin inhibits STAT4 phosphorylation, thereby reducing the secretion of T-helper 1 (Th1) cytokines, such as TNF-α and IFN-γ.3 Therefore, statins can promote an anti-inflammatory environment by shifting the balance toward Th2 cytokines.
Tregs (CD4 + CD25 + FOXP3+) are a subpopulation of CD4 + T cells that play an essential role in developing post-thymic self-tolerance and preventing autoimmunity.4 This immunomodulatory role is mediated by suppression of CD4 + T and B cells through cell-to-cell contact.5 One proposed mechanism is through the secretion or facilitation of secretion of TGF-β and IL-10, which has been demonstrated in cell-transfer studies of colitis.5 This immunosuppression is mediated by cell-to-cell contact through persistent TGF-β1 expression on their cell surface.5 Tregs are also a source of secreted TGF-β1, which is important when Tregs are stimulated with plate-bound anti-CD3 and co-signaling molecules in vivo.5
Inflammation is a key factor in the progression of coronary artery disease and leads to increased plaque instability.6 This instability is mediated through accumulation in coronary lesions. Major inflammatory cells implicated in this process are monocytes, which differentiate into resident macrophages called ‘foam cells’ in plaques. Other immune cells that contribute to plaque instability include T lymphocytes and mast cells.6 As reported by Luizzo et al., a subset of unstable angina (UA) patients have increased proliferation of unusual CD4 + T cells that produce excessive amounts of IFN-γ upon stimulation.6 This explains the role of activated T cells in stimulating monocyte activation and acute phase reactions. IFN-γ produced by CD4 + CD28null T cells is found in high numbers in UA patients and distinctly low numbers instable angina (SA) patients and controls. The emergence of a CD4 + CD28null T-cell subset can be explained by persistent antigenic stimulation.6
The aim of this network meta-analysis (NMA) is to compare the effects of different doses of statins [low-dose (20 mg/day or less) conventional statin therapy (CST) and high-dose (40 mg/day or more) intensive statin therapy (IST)] on Treg frequency and Treg-associated cytokines (IFN-γ, IL-10, TGF-β), compared with placebo.
Methods
Eligibility criteria
Inclusion and exclusion criteria were set a priori. Studies were included if they met the following criteria: (1) randomized controlled trials (RCTs), (2) published in English, (3) adult patients aged ≥ 18 years, (4) studies that quantified Treg frequency and their associated cytokines (IFN-γ, IL-10, TGF-β) by flow cytometric analysis before and after statin treatment, (5) intervention with low-dose CST (20 mg/day or less) and high-dose IST (40 mg/day or more), and (6) sufficient data for pooling (i.e. number of patients, mean, and standard deviation of Tregs and their associated cytokines). Studies were excluded if (1) they failed to report the interest of outcome, (2) studied non-humans, (3) were letters, case reports, or systematic reviews, or (4) were published in a language other than English.
Search strategy
PubMed, Cochrane Library, and EMBASE databases were searched for RCTs to identify relevant articles published between 2010 and June 2021. The search was performed with ‘regulatory T-cells’ ‘interleukin 10’, ‘interferon-gamma’, ‘TGF beta’, ‘hydroxymethylglutaryl-CoA reductase inhibitors’, and ‘acute coronary syndrome’ as medical subject headings (MeSH), in addition to the key word ‘statin’. The detailed search strategy can also be found in Supplementary Material Appendix 1.
Exposure variables
Studies were classified by effects of low-dose CST (20 mg/day or less) and high-dose IST (40 mg/day or more) compared with placebo on patients with ACS. Studies were classified by the intensity of the statin treatment according to the American Heart Association definition7 for potency in reduction of lipid levels.
Outcome variables
The primary outcomes were based on the post-intervention frequency of suppressor Tregs. Secondary outcomes were (1) IFN-γ, (2) IL-10, and (3) TGF-β levels. All outcomes were reported independently by two authors.
Data collection and analysis
Two authors (E.G. and S.K.) independently screened the titles and abstracts of all extracted papers and assessed the full texts of studies that met the inclusion criteria. Disagreements were settled by a third author (G.M.). Eligible articles were included based on the pre-specified criteria, and references were searched to retrieve additional relevant studies.
Quality assessment of included studies
Risk of bias in the included studies was evaluated using the Cochrane tool.16 The process was completed in the following domains: bias due to the randomization process, bias due to deviation from the intended intervention and the role of blinding, bias due to missing outcome data, bias in the measurement of the outcomes, and bias in the selection of the reported results. Trials were rated as having a low risk of bias, some concerns/probably low risk of bias, high risk of bias, or some concerns/probably high risk of bias. Studies were rated as having an overall low risk of bias if all domains were rated as probably low risk of bias or low risk of bias. Studies were rated as having an overall high risk of bias if one or more domains were rated as probably high risk of bias or high risk of bias. (Supplementary Appendix 2.1). The certainty of the evidence was assessed using the Grading of Recommendations, Assessment, Development and Evaluations GRADE methodology,8,18 with four levels of evidence quality: very low, low, moderate, and high. Two independent reviewers (E.G. and S.K.) assessed the risk of bias and quality of evidence for each outcome, and disagreements were resolved via discussion with a third author (G.M.) to reach a final decision.
Synthesis of results
Standardized mean difference (SMD) was used as a summary estimate of the nature of the outcomes and the statistical method to pool the results. A random-effects model was used to conduct this NMA. Heterogeneity was evaluated using Cochran's Q9 (P < 0.10 was considered significant for heterogeneity), the I2 test. All analyses used random‐effects models and the treatment effect of each study (mean and standard deviation for each group). Publication bias could not be evaluated because there were not enough studies in each direct meta-analysis to generate a funnel plot. The NMA was performed using the R-package.10
Results
Study selection
The search resulted in retrieval of 202 articles; 5 additional articles were identified through citation searching. After duplicates were removed, 190 articles remained. We assessed 11 full-text articles for eligibility, of which 6 were excluded because 3 did not include ACS patients, 1 measured only effector T cells and not Tregs, and 2 studies involved in vitro experiments. Finally, five studies met the full eligibility criteria. Figure 1 presents a flow diagram illustrating the process of study selection for each step of the systematic review.
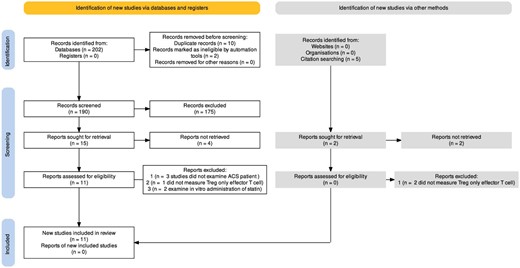
Prisma flow diagram illustrating the process of study selection for each step of the systematic review.
Characteristics of the included studies
The included studies had a total of 505 patients, of which 281 received statin therapy and 274 were controls. A study by Ma et al. was the only one to administer two different doses of atorvastatin oral tablet, 20 mg and 40 mg; three other studies administered atorvastatin oral tablets, one at a dose of 80 mg and the others at 20 mg and 10 mg, respectively.12,15 A study by Xie et al. used rosuvastatin oral tablets at a dose of 40 mg.13 Only studies by Zhang et al. and Wang et al. used placebos in the control group; in contrast, Ma et al. did not include a control group, and patients were randomized to a conventional group (atorvastatin 20 mg) or intensive group (atorvastatin 40 mg). Xie et al. and Hu et al. did not administer any medications to their control groups beside conventional ACS medications. The characteristics of the included studies are summarized in Table 1.
Characteristics of the five included studies.
| Age (mean ± SD) | Gender (male/female) | Sample size | Statin and dose | Length of | Marker of | ||||
|---|---|---|---|---|---|---|---|---|---|
| Author (year) | Therapy | Control | Therapy | Control | Therapy | Control | administration | T reg | |
| Ma et al.11 (2019) | 65.7 ± 10 | NA | 23/11 | NA | 32 | 25 | Atorvostatin 20 mg | 1 week | CD4 + CD25 + FOXP3+ |
| Ma et al. | 67.3 ± 9.4 | NA | 20/12 | NA | 34 | 25 | Atorvostatin 40 mg | 1 week | CD4 + CD25 + FOXP3+ |
| Wang et al.12 (2015) | 54 ± 16.5 | 50 ± 15.5 | 44/16 | 38/22 | 60 | 60 | Atorvostatin 20 mg | 4 weeks | CD4 + CD25 − FOXP3+ |
| Xie et al.13 (2014) | 61.5 ± 11.4 | 59.8 ± 10.5 | 59/20 | 56/24 | 79 | 80 | Rosuvostatin 40 mg | 24 hours | CD4 + CD25− |
| Zhang14 (2011) | 62.1 ± 10.8 | 60.5 ± 9.5 | 42/10 | 52/8 | 52 | 60 | Atorvostatin 80 mg | 3 months | CD4 + CD25 − FOXP3+ |
| Hu et al.15 (2007) | 59.5 ± 23.3 | 56.5 ± 26.1 | 32/16 | 11/7 | 24 | 24 | Atorvostatin 10 mg | 2 weeks | CD4 + CD25− |
Risk of bias
The five studies in the D1 domain had a low risk of bias due to randomization (Figure 2). In the D2 domain, all studies had a high risk of bias due to the nature of the studies, as blinding was not possible. The D3 and D4 domain studies had a low risk of bias because all results were reported for outcomes and were identified at the start of the reviews. The D5 domain studies included studies by Ma et al., Xie et al., and Zhang et al. and were evaluated to have some concern/low risk; Wang et al.’s study was evaluated to have a low risk of bias. Details of these bias assessments are shown in Supplementary Appendix 2,2.1.
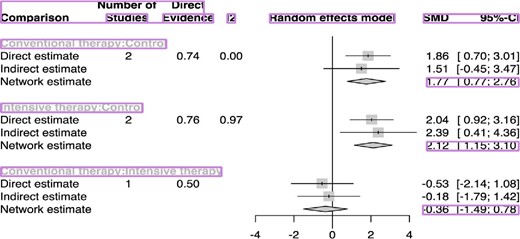
Forest plot showing the contribution of direct and indirect evidence in generating summary estimates for suppressor regulatory T cells (Tregs). Number of studies represents the number of component trials in each comparison.
Primary outcomes
The NMA indicated a significant increase in Treg frequency in the CST group compared with the control group (SMD 1.77; 95% CI: 0.77–2.76; P-value = 0.0005); a greater increase in Treg frequency was associated with the IST group than the control group (SMD 2.12; 95% CI: 1.15–3.10; P-value < 0.0001) (Figure 2). However, there was significant heterogeneity and inconsistency among the included studies [τ2 = 0.6096; τ = 0.7808; I2 = 91.2% (80.5%; 96.0%)].
Secondary outcomes
Treatment interventions were mapped for IL-10 levels in three studies,11,12,16 IFN-γ levels in three studies,12,14,16 and TGF-β levels in four studies.11,12,14,16 When compared with control, both CST and IST significantly increased levels of secreted IL-10 (SMD 2.69; 95% CI: 2.07–3.31; P-value < 0.0001 and SMD 2.14; 95% CI: 1.76–2.52; P-value < 0.0001, respectively) (Figure 4). When compared with the control group, CST was associated with significantly higher levels of TGF-β (SMD 3.83; 95% CI: 0.63–7.0; P-value = 0.0189) (Figure 4); this association was not seen in the IST group. IFN-γ levels were decreased significantly in both the IST and CST groups (SMD −1.52; 95% CI: −1.94–1.10; P-value < 0.0001 and SMD −2.34; 95% CI: −2.73–1.95; P-value < 0.0001, respectively) (Figure 3).
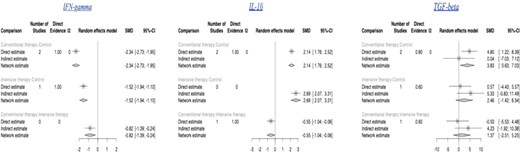
Forest plot showing the contribution of direct and indirect evidence in generating summary estimates for IFN-γ, IL-10, and TGF-β.
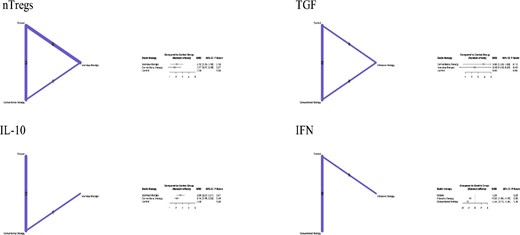
Network meta-analysis of the included clinical outcomes.
Network plots provide a visual display of where conventional statin therapy and intensive statin therapy have been compared in head-to-head trials, and importantly whether there is a connected network of evidence; an essential requirement for network meta-analysis. Each node on the plot represents an individual intervention with connecting lines between nodes indicating where one or more of the trials have evaluated both interventions on a head-to-head basis. The size of the nodes and the thickness of edges depend on the number of people randomized and the number of trials conducted, respectively.
NMA of the primary and secondary clinical outcomes is summarized in Figure 3.
Ranking treatment
The SUCRA (Surface Under the Cumulative Ranking) ranking analyze for this NMA on Figure 5 shows that IST is being ranked first with SUCRA score 78.88%, followed by CST with SUCRA score 64.52% and placebo with SUCRA score 6.60%.
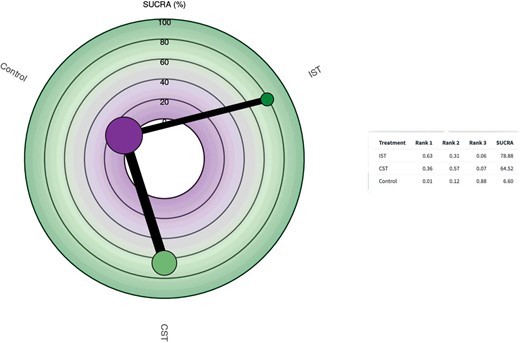
Surface Under the Cumulative Ranking for the effect of low-dose (20 mg/day or less) conventional statin therapy and high-dose (40 mg/day or more) intensive statin therapy on the frequency of Tregs compared with control. Radial Surface Under the Cumulative Ranking plot represent: Higher Surface Under the Cumulative Ranking values indicate better treatment; size of nodes represents number of patients and thickness of lines indicate number of trials conducted. Table represent ranking probabilities for each treatment to be ranked as the most effective treatment, ‘rank 1’, then second most effective treatment, ‘rank 2’, until the least effective treatment and Surface Under the Cumulative Ranking values for all treatments.
Quality of evidence
The quality of direct evidence for all outcomes was generally rated as moderate. When applying GRADE to NMA evidence, most comparisons of interventions were rated as moderate quality for primary outcomes. More details on the quality of evidence of the studies are presented in Appendix 3.
Discussion
Principal findings
This NMA of 505 individuals suggested that both high- and low-dose statin therapy increased Treg frequency compared with placebo in patients with ACS. The IST group was more effective in increasing Treg frequency and shifting the immunomodulatory balance to an anti-inflammatory state in patients with ACS. Furthermore, statin therapy increased IL-10 and TGF-β levels and decreased IFN-γ levels, contributing to the stabilization of atherosclerotic plaques and an overall benefit in patient with ACS. The SUCRA rank shows that IST group shows better increase in Treg frequency which promotes an anti-inflammatory environment by shifting the balance towards Th2 cytokines.
Strengths and limitations of this study
A novel contribution of this study to the literature was the first application of an NMA to estimate the dose-response effect of statin therapy on the frequency of Tregs and Treg-associated cytokines (IL-10, TGF-β, and IFN-γ) using two clinically significant groups of statin treatment (high dose and low dose). This NMA provided information about risk by using all the available data, while traditional meta-analyses are limited to direct observations.17 However, this study had certain limitations. There was high heterogeneity in the pooled results; however, GRADE analysis indicated a low-to-moderate quality of evidence for the primary outcomes. Multiple baseline features, including older age and kidney function impairment, which may influence patient prognosis, were not included in this analysis, potentially introducing mixed bias. The study was focused on the therapeutic efficacy of the treatment strategies and did not perform a cost-benefit assessment that could have helped to evaluate potential savings associated with the observed benefits.
Perspectives and clinical relevance
Based on our results, future studies should be conducted to evaluate the immunomodulatory benefits of high-intensity statin treatment to support broad utilization of this beneficial therapeutic approach for patients with ACS. GRADE analysis indicated that the quality of the Treg frequency data was moderate, suggesting that it would be unlikely that additional studies would significantly change the effect estimate. However, further studies could be conducted to identify which cohorts of patients might benefit most from high-intensity statin treatment. In future studies with a related framework, an estimated SMD for high-intensity statin therapy equal to 2.12 for Treg frequency would be of greater benefit to patients with ACS because it would contribute to the stabilization of atherosclerotic plaques. Based on our result we point out that high dose statin can be used earlier in ACS patients irrespective of risk factors-based guidelines, this reflects a new idea and more clinical trial are necessary to understand better the immunologic phenomenon and its application in the overall benefit in treatment of ACS patient in the future and may necessitate the need to update the guidelines.
Conclusions
Overall, these results have significant implications for patients with ACS who would benefit from statin therapy, in addition to its role in slowing the progression of atherosclerosis plaque through its pharmacological effect, plays a pivotal role in controlling the pathogenesis of ACS through Treg-induced immunomodulatory balance.
Authors contributions
E.G., S.K., S.P., A.W., T.R., contributed to study design, data verification and interpretation, literature search, writing, and editing of the manuscript. E.G., S.K., S.P., contributed to data analysis and data interpretation. G.M. was also responsible for data verification. E.G., S.K., and S.P. contributed to data collection and editing of the manuscript. E.G., S.P., G.M., contributed to data interpretation and editing of the manuscript. G.M., S.M., J.M., contributed to data interpretation and critical revision of the manuscript.
Acknowledgements
The authors would like to acknowledge Mr Pratik Devkota (Master's in Computer Science, University of North Carolina at Greensboro) for providing immense support in the graphical abstract formation and table formatting in accordance with the journal requirements. We would also like to thank Larkin Community Hospital Team 11 Global Research Collaboration program for creating a networkable organization for international medical graduates worldwide and providing a platform to teach and learn the foundation of clinical research skills from mentors and colleagues from all around the globe.
Funding
No financial support has been received for this project
Conflict of interest
The authors declare that no conflict of interest exists
Data availability
The data underlying this article are available in the article and in its online supplementary material.
References
Author notes
Secondary Affiliation: Post Graduate Program Cardiology, University of Plymouth, Plymouth, U
Secondary Affiliation: National Medical College, Tribhuvan University, Birgunj, Nepal
