


Abstract
Guideline-directed medical therapy (GDMT) is essential to prevent future cardiovascular events in chronic coronary syndrome (CCS) patients. However, whether achieving optimal GDMT could improve clinical outcomes in CCS patients with deferred lesions based on fraction flow reserve (FFR) remains thoroughly investigated. We sought to evaluate the association of GDMT adherence with long-term outcomes after FFR-based deferral of revascularization in a real-world registry.
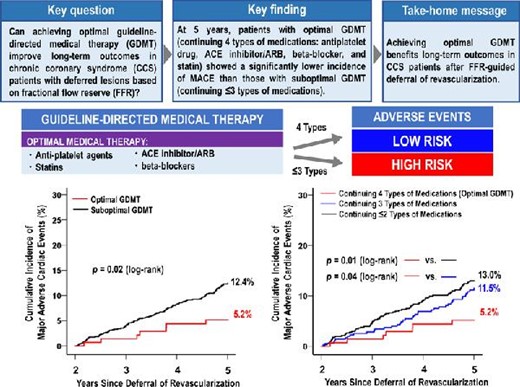
This is a post-hoc analysis of the J-CONFIRM registry (long-term outcomes of Japanese patients with deferral of coronary intervention based on fractional flow reserve in multicentre registry). Optimal GDMT was defined as combining four types of medications: antiplatelet drug, angiotensin-converting enzyme inhibitor/angiotensin II receptor blocker, beta-blocker, and statin. After stratifying patients by the number of individual GDMT agents at 2 years, landmark analysis was conducted to assess the relationship between GDMT adherence at 2 years and 5-year major adverse cardiac events (MACEs), defined as a composite of all-cause death, target vessel-related myocardial infarction, clinically driven target vessel revascularization. Compared with the suboptimal GDMT group (continuing ≤3 types of medications, n = 974), the optimal GDMT group (n = 139) showed a lower 5-year incidence of MACE (5.2% vs. 12.4%, P = 0.02). The optimal GDMT was associated with a lower risk of MACE (hazard ratio: 0.41; 95% confidence interval: 0.18 to 0.92; P = 0.03).
Patients with optimal GDMT were associated with better outcomes, suggesting the importance of achieving optimal GDMT on long-term prognosis in CCS patients after FFR-guided deferral of revascularization.
This sub-analysis of the J-CONFIRM registry demonstrated an impact of optimal guideline-directed medical therapy adherence on incidence of future cardiovascular events.
Introduction
Fractional flow reserve (FFR) is an invasive index of the physiological assessment of functional severity of coronary artery stenosis.1 The feasibility, effectivity, and safety of FFR-guided revascularization such as percutaneous coronary intervention (PCI) and coronary artery bypass grafting (CABG) have been elucidated in previous randomized trials and observational studies,2,3 although the use of FFR for CABG has been controversial due to the potential compromise of CABG protection against progression of FFR-negative moderate coronary stenosis, which may undermine the benefits of CABG for long-term survival.4 The FFR measurement can avoid unnecessary revascularization for intermediate coronary artery stenosis with unproven myocardial ischemia, resulting in saving medical resources and costs with an improved clinical outcome.5,6 Recently, the J-CONFIRM registry (long-term outcomes of Japanese patients with deferral of coronary intervention based on FFR in multicentre registry) reported that 2-year target vessel failure (TVF) was 5.5% in deferred lesions, mainly driven by clinically driven target vessel revascularization (CDTVR). Also, cardiac death and target vessel-related myocardial infarction (TVMI) rarely occurred during the 2-year follow-up (0.41 and 0.41%, respectively).7 These findings highlighted the safety of FFR-based deferral of revascularization in real-world practice.
The current guideline recommends the use of medications, such as antiplatelet agents, angiotensin-converting enzyme (ACE) inhibitor/angiotensin Ⅱ receptor blocker (ARB), beta-blockers, and statins for pharmacological treatment of chronic coronary syndrome (CCS), to prevent future cardiovascular events.8 However, little evidence is available regarding the relationship between guideline-directed medical therapy (GDMT) adherence and long-term prognosis in CCS patients after FFR-based deferral of revascularization. In this regard, the present study sought to evaluate whether optimal GDMT could improve long-term outcomes of CCS patients with deferred lesions based on FFR by analysing the J-CONFIRM registry.
Methods
Study design and study population
This study was a post-hoc analysis of the J-CONFIRM registry, a prospective, multicentre, observational study investigating clinical outcomes of patients with deferral of revascularization based on FFR measurement at 28 Japanese hospitals (Appendix in Supplemental Material) between September 2013 and June 2015, as previously described.7 Briefly, the J-CONFIRM registry prospectively enrolled 1263 patients with 1447 angiographically intermediate coronary artery narrowing with deferral of revascularization based on FFR measurement after exclusion of patients with acute myocardial infarction (MI), cardiogenic shock, a chronic total occlusion lesion, a graft lesion, or limited life expectancy due to comorbidity. In the present study, a 2-year landmark analysis was conducted to investigate the impact of GDMT adherence on long-term clinical outcomes. According to the number of individual GDMT agents, such as (1) antiplatelet drugs (aspirin, or thienopyridine [ticlopidine, clopidogrel, or prasugrel]), (2) statins, (3) beta-blockers, and (4) ACE inhibitors/ARBs during 2-year follow-up after FFR measurement, the patients were divided into two groups; the optimal (continuing four types of medications) and suboptimal GDMT (continuing ≤3 types of medications) groups, as previously defined.9 The exposure period for implementation adherence measurement was set to 2 years because we sought to confirm reliable continuing GDMT. Continuing medications was defined as the continuation of the medications during 2-year follow-up, which was confirmed at discharge, 1- and 2-year follow-up by each site investigator. The selection of medication was left to the discretion of the attending physician at each institution.
This study protocol was approved by the local ethics committee at all participating centres and was in accordance with the Declaration of Helsinki. All patients provided written informed consent for participation in this registry. The research was funded by an unrestricted grant from Abbott Vascular Japan, Phillips Japan, and Boston Scientific Japan, which had no oversight or input on data gathering, data interpretation, or the preparation of this manuscript. This study was registered with http://www.umin.ac.jp, unique identifier UMIN000014473.
Data collection and follow-up
All baseline and follow-up data were prospectively collected from the medical records or by telephone contacts with the patients, relatives, referring physicians at discharge, 1-, 2-, 3-, 4-, and 5-year follow-ups by each site investigator. All clinical events were judged by an independent clinical events committee.
Clinical outcomes and definitions
The primary endpoint was major adverse cardiac events (MACE) at 5 years. MACE was defined as a composite of all-cause death, TVMI, CDTVR during the follow-up period that began from the date of 2-year follow-up to the date of the first event or until 5-year follow-up. Cardiac death and TVF were also assessed. The TVF was defined as cardiac death, TVMI, and CDTVR. Death was regarded as cardiac death unless other non-cardiac causes could be identified. MI was defined according to the Academic Research Consortium definition.10 Target vessel revascularization (TVR) was defined as a repeated PCI or repeated coronary artery bypass graft on the target vessel. A TVR was considered clinically indicated (1) if the angiographic percentage diameter stenosis of the target lesion was ≥50% by qualitative coronary angiographic assessment, in the presence of ischemic signs or symptoms or (2) if the diameter stenosis was ≥70% by qualitative coronary angiographic assessment, irrespective of ischemic signs or symptoms.10
Statistical analysis
Data are expressed as the median and interquartile range (IQR) for continuous variables, and number (percentage) for categorical variables. Group comparisons were performed by Mann–Whitney U test for continuous variables, the Chi-squared test or Fisher's exact test for categorical variables, and the log-rank test for Kaplan–Meier curves, as appropriate. Logistic regression analysis was performed to investigate the clinical characteristics of patients who received many types of medications. For no reports regarding predictors related to those patients, variables of P < 0.20 in univariable logistic regression were used in multivariable logistic regression analysis. Event rates (per 100 person-years) and the 95% confidence intervals (CIs) for both optimal and suboptimal GDMT groups were calculated for quintiles of FFR value and presented as a plot with a natural cubic spline. Landmark analysis comparing treatments during the follow-up period between 2 and 5 years was conducted. Cox proportional hazard regression with mixed effects account for institutional variety was used to compute hazard ratios (HRs) and 95% CIs as estimates for the endpoint.11 The HRs were adjusted for covariates such as age, sex, body mass index, the lowest value of FFR, in-stent restenosis, left main coronary artery lesion, left anterior descending coronary artery, left circumflex coronary artery, right coronary artery, diabetes mellitus, hypertension, dyslipidemia, renal dysfunction category (estimated glomerular filtration rate ≥60 mL/min/m2; ≥45 to <60, ≥30 to <45, <30), current smoking, prior MI, prior PCI, prior CABG, prior atrial fibrillation, prior heart failure, prior peripheral artery disease, multivessel disease, and medications. To confirm the results’ robustness, inverse probability of treatment weighed (IPTW) Cox analysis was performed as sensitivity analysis for the same outcomes. The predicted probability of receiving optimal GDMT was calculated by applying a logistic regression model, using all clinically relevant variables as mentioned above and was used as weights for the IPTW models. The subgroup analysis and the interaction test were performed according to the baseline characteristics and the value of FFR measurement (FFR <0.80 or ≥0.80). To assess the robustness of the association between optimal GDMT adherence and outcomes, the sensitivity analyses were performed with respect to (1) the modified definition of the optimal GDMT as follows: the optimal GDMT was defined as (1) antiplatelet drugs, statins, beta-blockers, and ACE inhibitors/ARBs during 2-year follow-up for patients with left ventricular dysfunction, or (2) antiplatelet drugs, statins, and beta-blockers for patients without left ventricular dysfunction; (2) exclusion of FFR <0.75; and (3) exclusion of FFR ≤0.80. In addition, assuming the case of intolerant to beta-blockers, the suboptimal GDMT group was further divided into a group including patients who took calcium channel blockers (CCB) instead of beta-blockers (i.e. antiplatelet agents, statins, ACE inhibitors/ARB, and CCB) and the other suboptimal GDMT group. A two-sided P value of <0.05 indicated a statistically significance. All statistical analyses were conducted using SPSS version 23.0 (IBM Corp., Armonk, NY), and R software Version 4.0.5. (http://www.r-project.org).
Results
Study population and baseline clinical characteristics
Of 1263 patients, 150 were excluded due to following reasons: (1) all-cause death within 2-year follow-up (n = 40), (2) CDTVR within 2-year follow-up (n = 86), and (3) lost to follow-up (n = 24). Finally, 1113 patients were enrolled in the present study. Of these, 139 (12.5%) had continued four types of medications during the 2-year follow-up (optimal GDMT group), while 974 (87.5%) had continued ≤3 types of medications (suboptimal GDMT group) (Supplemental Figure 1).
The baseline characteristics are shown in Table 1. The optimal GDMT group was younger, obese and had a higher prevalence of hypertension, dyslipidemia, a prior history of MI, PCI, and heart failure than the suboptimal GDMT group. The levels of triglyceride were higher in the optimal GDMT group than the suboptimal GDMT group. In contrast, low-density lipoprotein cholesterol and high-density lipoprotein cholesterol were lower in the optimal GDMT group than the suboptimal GDMT group.
Baseline Clinical Characteristics
| Overall | Optimal GDMT group | Suboptimal GDMT group | P value | |
|---|---|---|---|---|
| Number of patients | 1113 | 139 | 974 | |
| Baseline characteristics | ||||
| Age, years | 71 (65, 77) | 68 (61, 75) | 71 (65, 77) | <0.01 |
| Male | 821 (73.8) | 107 (77.0) | 714 (73.4) | 0.37 |
| Body mass index, kg/m2 | 23.8 (21.8, 26.0) | 24.5 (22.3, 26.9) | 23.7 (21.7, 25.9) | <0.01 |
| Hypertension | 848 (76.2) | 117 (84.2) | 731 (75.1) | 0.02 |
| Dyslipidemia | 715 (64.2) | 112 (80.6) | 603 (61.9) | <0.01 |
| Diabetes mellitus | 420 (37.7) | 55 (39.6) | 365 (37.5) | 0.63 |
| Current smoking | 350 (31.4) | 50 (36.0) | 300 (30.8) | 0.22 |
| Hemodialysis | 47 (4.2) | 2 (1.4) | 45 (4.6) | 0.08 |
| Prior myocardial infarction | 319 (28.7) | 90 (64.7) | 229 (23.5) | <0.01 |
| Prior percutaneous coronary intervention | 648 (58.2) | 124 (89.2) | 524 (53.8) | <0.01 |
| Prior coronary artery bypass graft | 22 (2.0) | 2 (1.4) | 20 (2.1) | 0.63 |
| Prior heart failure | 90 (8.1) | 18 (12.9) | 72 (7.4) | 0.03 |
| Prior atrial fibrillation | 101 (9.1) | 10 (7.2) | 91 (9.3) | 0.41 |
| Prior peripheral artery disease | 134 (12.0) | 13 (9.4) | 121 (12.4) | 0.30 |
| Left ventricular ejection fraction, % | 64.2 (56.8, 70.0) | 60.5 (50.7, 68.0) | 64.7 (57.2, 70.3) | <0.01 |
| ≤40% | 42 (3.8) | 12 (8.6) | 30 (3.1) | <0.01 |
| Clinical Symptom | 0.69 | |||
| Asymptomatic | 578 (51.9) | 79 (56.8) | 499 (51.2) | |
| CCS I | 392 (35.2) | 45 (32.4) | 347 (35.6) | |
| CCS II | 103 (9.3) | 12 (8.6) | 91 (9.3) | |
| CCS III | 21 (1.9) | 2 (1.4) | 19 (2.0) | |
| CCS IV | 19 (1.7) | 1 (0.7) | 18 (1.8) | |
| Location of target lesion | ||||
| Left main coronary artery | 27 (2.4) | 7 (5.0) | 20 (2.1) | 0.07 |
| Left anterior descending coronary artery | 622 (55.9) | 68 (48.9) | 554 (56.9) | 0.08 |
| Left circumflex coronary artery | 285 (25.6) | 43 (30.9) | 242 (24.8) | 0.12 |
| Right coronary artery | 320 (28.8) | 40 (28.8) | 280 (28.7) | 0.99 |
| In-stent restenosis lesion | 74 (6.6) | (6.5) | 65 (6.7) | 0.93 |
| Number of target lesion | 0.57 | |||
| 1-vessel | 991 (89.0) | 121 (87.1) | 870 (89.3) | |
| 2-vessel | 102 (9.2) | 16 (11.5) | 86 (8.8) | |
| 3-vessel | 20 (1.8) | 2 (1.4) | 18 (1.8) | |
| Lowest FFR | 0.85 (0.82, 0.90) | 0.85 (0.82, 0.89) | 0.85 (0.82, 0.90) | 0.74 |
| Medication at discharge | ||||
| Antiplatelet agent | 899 (80.8) | 139 (100) | 797 (81.8) | <0.01 |
| Aspirin | 794 (71.3) | 132 (95.0) | 728 (74.7) | <0.01 |
| Thienopyridine | 541 (48.6) | 99 (71.2) | 516 (53.0) | <0.01 |
| Anticoagulation | 89 (8.0) | 14 (10.1) | 78 (8.0) | 0.41 |
| ACE inhibitor/ARB | 611 (54.9) | 139 (100) | 502 (51.5) | <0.01 |
| Beta-blockers | 342 (30.7) | 139 (100) | 222 (22.8) | <0.01 |
| Calcium channel blockers | 547 (49.1) | 60 (43.2) | 518 (53.2) | 0.03 |
| Statin | 681 (61.2) | 139 (100) | 582 (59.8) | <0.01 |
| Nitrates | 206 (18.5) | 26 (18.7) | 190 (19.5) | 0.82 |
Categorical variables are expressed as number and percentage. Continuous variables are indicated as median (interquartile range). GDMT indicates guideline-directed medical therapy; IQR, interquartile range; CCS, Canadian Cardiovascular Society functional classification; FFR, fractional flow reserve; ACE, angiotensin-converting enzyme; ARB, angiotensin Ⅱ receptor blocker.
Factors associated with optimal GDMT
The results of univariable and multivariable logistic regression analyses for associated factors of patients who achieved the optimal GDMT are shown in Table 2. Multivariable logistic regression analysis identified dyslipidemia, prior MI, prior PCI, left ventricular dysfunction, and left main coronary artery as significant associated factors of the patients who achieved the optimal GDMT.
Factors Associated with Optimal GDMT
| Univariable | Multivariable | |||||
|---|---|---|---|---|---|---|
| OR | 95% CI | P value | OR | 95% CI | P value | |
| Elderly (age ≥75 years) | 0.66 | 0.44, 0.99 | 0.04 | 0.63 | 0.38, 1.03 | 0.06 |
| Male | 1.21 | 0.80, 1.85 | 0.37 | |||
| Body mass index ≥25 kg/m2 | 1.51 | 1.05, 2.18 | 0.03 | 1.17 | 0.75, 1.81 | 0.49 |
| Hypertension | 1.77 | 1.10, 2.85 | 0.02 | 1.49 | 0.85, 2.61 | 0.16 |
| Dyslipidemia | 2.55 | 1.64, 3.96 | <0.01 | 2.33 | 1.37, 3.97 | <0.01 |
| Diabetes mellitus | 1.09 | 0.76, 1.57 | 0.63 | |||
| Current smoking | 1.26 | 0.87, 1.83 | 0.22 | |||
| estimated glomerular filtration rate <60 ml/min/m2 | 1.07 | 0.73, 1.58 | 0.73 | |||
| Hemodialysis | 0.30 | 0.07, 1.26 | 0.10 | 0.24 | 0.03, 1.88 | 0.18 |
| Prior myocardial infarction | 5.98 | 4.09, 8.72 | <0.01 | 2.51 | 1.57, 4.00 | <0.01 |
| Prior percutaneous coronary intervention | 7.10 | 4.09, 12.3 | <0.01 | 4.53 | 2.35, 8.73 | <0.01 |
| Prior coronary artery bypass graft | 0.70 | 0.16, 3.01 | 0.63 | |||
| Prior heart failure | 1.86 | 1.08, 3.23 | 0.03 | 1.46 | 0.72, 2.96 | 0.30 |
| Prior atrial fibrillation | 0.75 | 0.38, 1.48 | 0.41 | |||
| Prior peripheral artery disease | 0.73 | 0.40, 1.33 | 0.30 | |||
| Left ventricular ejection fraction ≤40% | 3.02 | 1.50, 6.08 | <0.01 | 2.62 | 1.10, 6.24 | 0.03 |
| Symptomatic (vs. asymptomatic) | 0.80 | 0.56, 1.14 | 0.22 | |||
| Left main coronary artery | 2.53 | 1.05, 6.10 | 0.04 | 3.50 | 1.11, 11.1 | 0.03 |
| Left anterior descending coronary artery | 0.73 | 0.51, 1.04 | 0.08 | 1.14 | 0.69, 1.87 | 0.61 |
| Left circumflex coronary artery | 1.36 | 0.92, 2.00 | 0.13 | 1.33 | 0.79, 2.22 | 0.28 |
| Right coronary artery | 1.00 | 0.68, 1.48 | 0.99 | |||
| In-stent restenosis lesion | 0.97 | 0.47, 1.99 | 0.93 | |||
| Multivessel disease | 1.24 | 0.73, 2.13 | 0.42 | |||
| FFR measurement | ||||||
| FFR 0.91–1.00 | Ref | Ref | Ref | Ref | Ref | Ref |
| FFR 0.81-0.90 | 1.12 | 0.72, 1.75 | 0.62 | 1.42 | 0.81, 2.50 | 0.23 |
| FFR 0.75-0.80 | 0.58 | 0.28, 1.21 | 0.15 | 0.46 | 0.18, 1.16 | 0.10 |
| FFR <0.75 | 0.92 | 0.30, 2.79 | 0.88 | 0.58 | 0.15, 2.35 | 0.45 |
OR indicates odds ratio; CI, confidence interval. Other abbreviations as in Table 1.
Impact of optimal GDMT on outcomes
Five-year clinical follow-up after FFR measurement was completed in 93.8% of patients. The optimal GDMT group showed a lower incidence rate of MACE than the suboptimal GDMT group (5-year incidence rate: 5.2% vs. 12.4%, p = 0.02) (Figure 1). As shown in Figure 2, in the optimal GDMT group, the MACE rate decreased as the FFR value increased, whereas this relationship was not observed in the suboptimal GDMT group. Multivariable Cox hazard regression with the mixed-effects model showed that optimal GDMT was significantly associated with a lower incidence of MACE (hazard ratio [HR]: 0.41; 95% CI: 0.18 to 0.92; p = 0.03) (Table 3). Consistently, IPTW analysis confirmed the robustness of the association between optimal GDMT and a low risk of MACE (HR: 0.35; 95% CI: 0.14 to 0.87; p = 0.02) (Table 3). In addition, IPTW analysis showed that optimal GDMT was significantly associated with a low risk of all-cause death (HR: 0.29; 95% CI: 0.09 to 0.89; p = 0.03) (Table 3).
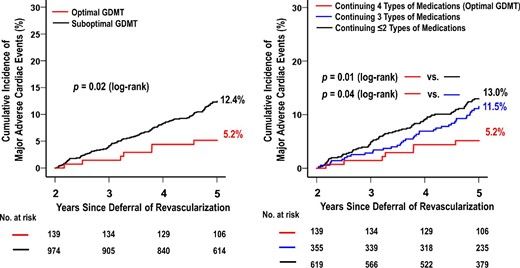
Kaplan–Meier Curves of major adverse cardiac events from 2 to 5 Years. Abbreviations as in Table 1.
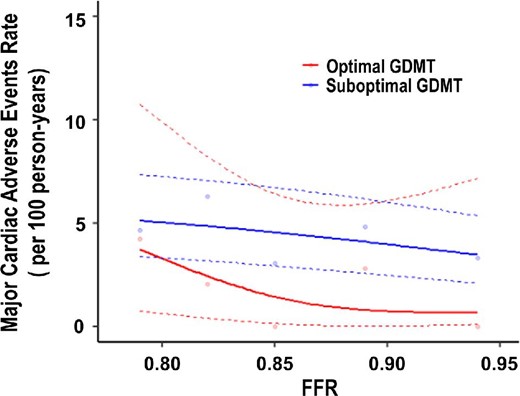
Rate of Major cardiac adverse events according to Fractional Flow Reserve. The lines show incidence rates of major adverse cardiac adverse events according to fractional flow reserve. Abbreviations as in Table 1.
Adjusted Risk of Outcomes in Patients with Optimal Versus Suboptimal GDMT
| MACE | Target vessel failure | All-cause death | Cardiac death | |||||||||
|---|---|---|---|---|---|---|---|---|---|---|---|---|
| HR | 95% CI | P value | HR | 95% CI | P value | HR | 95% CI | P value | HR | 95% CI | p value | |
| Multivariable analysis | 0.41 | 0.18, 0.92 | 0.03 | 0.50 | 0.19, 1.33 | 0.16 | 0.50 | 0.17, 1.50 | 0.21 | 1.82 | 0.25, 13.3 | 0.55 |
| IPTW analysis | 0.35 | 0.14, 0.87 | 0.02 | 0.51 | 0.18, 1.46 | 0.21 | 0.29 | 0.09, 0.89 | 0.03 | 0.75 | 0.15, 3.70 | 0.72 |
Subgroup analysis
Figure 3 shows the subgroup analysis of the impact of achieving the optimal GDMT on MACE. The optimal GDMT was associated with a lower risk of MACE in male patients compared to females, and tended to be associated with a lower risk of MACE in elderly patients than the non-elderly and tended to be associated with a lower risk of MACE in patients with prior MI than those without prior MI, but not with statistical significance for the interaction term.

Sensitivity analysis
The results of each sensitivity analysis were almost consistent with the primary analysis results (Supplemental Table 1 and Supplemental Figures 2 and 3). As shown in Supplemental Figure 4, Kaplan–Meier curves indicated a comparable incidence rate of MACE in the suboptimal GDMT with CCB instead of beta-blockers compared to the other suboptimal GDMT group (p = 0.56) and tended to be higher incidence rate of MACE in the suboptimal GDMT with CCB instead of beta-blockers than the optimal GDMT group (p = 0.09).
Impact of individual medical therapy on outcomes
There were no significant differences in Kaplan–Meier event-free survival in patients with and without continuing antiplatelet drugs (Supplemental Figure 5) and ACE inhibitor/ARBs (Supplemental Figure 6). In multivariable Cox hazard regression with the mixed-effects model, antiplatelet therapy, regardless of their type or dual antiplatelet therapy, did not impact clinical outcomes (Supplemental Table 2). Similarly, ACE inhibitor/ARB and statins did not (Supplemental Table 3). However, patients with continuing beta-blockers had better event-free survival in MACE and TVF than those without continuing beta-blockers (Supplemental Figure 7). Also, patients with continuing statins had better event-free survival in cardiac death than those without continuing statins (Supplemental Figure 8). Continuation of β-blockers had a low risk of MACE and TVF, almost consistent with the results of IPTW analysis but not with statistical significance (Supplemental Table 3).
Discussion
The main findings of this sub-analysis of the J-CONFIRM registry were as follows: (1) the optimal GDMT could be achieved only in 12.5% of patients 2 years after FFR-based deferral of revascularization; (2) dyslipidemia, prior MI, prior PCI, left ventricular dysfunction, and left main coronary artery were significant associated factors of the patients who achieved the optimal GDMT; (3) the 5-year rate of MACE was significantly lower in the optimal GDMT group than in the suboptimal GDMT group; and (4) the optimal GDMT showed a significant interaction in sex and marginal interaction in age and a history of MI
The guidelines aim to assist physicians in prescribing evidence-based drugs to improve patients’ symptoms and outcomes, whereas some gaps between recommendations and clinical practice exist for several reasons.12 In the present study, the optimal GDMT could be achieved only in 12.5% of patients 2 years after FFR measurement, regardless of the deferral of revascularization. Although it appeared lower than reported in previous randomized trials,2,3 our results should be considered more reflective of a real-world setting. The present study demonstrated that dyslipidemia, prior MI, prior PCI, left ventricular dysfunction, and left main coronary artery were significant associated factors of the patients who had achieved the optimal GDMT. Possible explanations for this include the following: (1) physicians are more likely to adhere to guideline recommendations when treating high-risk patients who have a history of MI or had undergone revascularization; and (2) high-risk patients more often may be followed up by cardiologists at the outpatient clinic of tertiary care hospitals, while low-risk patients not. Indeed, several factors (e.g. age, sex, disease severity, medical specialty of physician, and type of care centers) could affect physician's guideline adherence.12 Our findings highlight the difficulty in achieving optimal GDMT in real-world practice.
The pharmacological management of CCS patients plays a crucial role in reducing angina symptoms and exercise-induced ischemia and preventing future cardiovascular events. The current guideline recommends antithrombotic therapy, beta-blockers, ACE inhibitors (or ARBs), or statins for event prevention in CCS patients, especially at high risk of cardiovascular events.8 However, what regimen is optimal for CCS patients after FFR-based deferral of revascularization has not been thoroughly investigated. Furthermore, it remains unclear whether the optimal GDMT could lead to better outcomes in those patients. In the present study, the 5-year MACE was significantly lower in patients with the continuation of four types of medications than patients with the continuation of three and less than or equal to two types of medications. Consistently, the subanalysis of the SYNTAXES (Synergy Between PCI With Taxus and Cardiac Surgery Extended Survival) study showed that patients on four types of medications were associated with a better survival benefit than those on less than or equal to two types of medications.9 Thus, four types of medications would be regarded as the optimal GDMT regimen to improve long-term outcomes of CCS patients. Intriguingly, the spline analysis of the present study showed that the benefit of optimal GDMT appeared smaller as the FFR value decreased (Figure 2). In contrast, the slight impact of suboptimal GDMT on clinical outcome depended on the FFR value was observed. This difference in impact between optimal and suboptimal GDMT on clinical outcome depended on the FFR value is a novel finding. Furthermore, based on the individual medical therapy's impact on outcomes in the present study, the addition of beta-blockers to statins might play a crucial role in preventing future cardiovascular events in patients with intermediate coronary stenosis after FFR-based deferral of revascularization. A recent study has demonstrated that FFR represents a continuum risk in coronary stenosis (i.e. the lower the FFR value, the higher the incidence of cardiac events); lesions with lower FFR values receive larger absolute benefits from revascularization.13 Although these findings suggested the FFR threshold at which revascularization would be preferable to optimal GDMT in CCS patients with deferred lesions, the optimal cutoff value of FFR on selecting optimal GDMT or revascularization could not be identified since the present study did not include patients undergoing revascularization. Further studies should address this issue soon.
Polypharmacy has become a serious issue in medical care due to an increased risk of adverse drug reactions and interactions, decreased adherence to medications, and increased medical costs, especially in elderly patients.14,15 Conversely, the discontinuation of medications could potentially increase the risk of cardiovascular events. Indeed, Rea et al. reported that discontinuing statins was associated with a high risk of long-term cardiovascular outcomes in elderly patients with polypharmacy.16 Accordingly, careful consideration is mandatory to decide what drugs should be continued or not in elderly patients. In the current study, the optimal GDMT was associated with a lower risk of MACE in male patients than females and tended to be associated with a lower risk of MACE in elderly patients than the non-elderly. Given these findings, optimal GDMT could have a more significant prognostic effect on elderly male patients with CCS after FFR-based deferral of revascularization. Elderly patients with CCS have a high prevalence of comorbidities, commonly resulting in polypharmacy.8 Although polypharmacy might be indicated and beneficial for those patients, the risk of inappropriate prescribing exists there and could contribute to adverse clinical outcomes.15 Our results suggested that optimal GDMT could reduce cardiovascular events in elderly patients with CCS, while non-cardiovascular events (e.g. bleeding, renal failure, and neurological impairments) and adverse drug reaction could not be assessed in the present study. Additional studies are warranted to confirm the long-term efficacy and safety of optimal GDMT in elderly CCS patients with deferred lesions.
Study limitations
The present study has several limitations. First, unmeasured confounding factors might have biased the results of the present study due to the nature of the observational study. Second, while comparing the long-term clinical outcomes between patients with the continuation of 4 and ≤3 types of medications, confounding by indication might have affected the effect of continuing GDMT on the long-term clinical outcomes. In general, for the nature of observational study and confounding by indication, patients receiving many types of medications tend to have higher disease severity and higher risk of clinical outcomes. In the present study, patients with four types of medications were more likely to have dyslipidemia, prior MI, prior PCI, left ventricular dysfunction, and left main coronary artery, indicating that those patients had a high risk of cardiovascular events. Nonetheless, continuing four types of medications was associated with better long-term outcomes, which would be a remarkable result as an effect of GDMT. Third, improving symptoms and quality of life is the main goal for symptomatic patients with CCS. However, we could not assess them in the present study. Finally, although medications compliance was confirmed annually, we could not check the dosages of drugs and achievement of optimal management goals (e.g. controlled blood pressure, serum cholesterol level, glucose level, smoking cessation, and healthy weight management). These might have affected the conclusion in this study.
Conclusions
In a real-world registry, continuing four types of medications were associated with better outcomes of CCS patients after FFR-guided deferral of revascularization than those with less than or equal to three types of medications. Our findings highlight the importance of achieving optimal GDMT on long-term outcomes in those patients.
Acknowledgements
We appreciate the efforts of the investigators in the 28 participating centers in Japan.
Funding
Abbott Medical Japan; Boston Scientific Japan; and Philips Japan.
The funder of this study had no role in study design, data collection, data analysis, interpretation of data, writing of the report, and decision to submit the paper for publication. All authors had full access to all the data in the study and the corresponding author had final responsibility for the decision to submit for publication.
Conflict of interest: Dr. Kuramitsu receives lecture fees from Abbott Medical Japan, Boston Scientific Japan, and Philips Japan; Dr. Matsuo receives lecture fees from Abbott Medical Japan, Boston Scientific Japan, and Philips Japan; Dr. Kikuta receives lecture fees from Abbott Medical Japan and Philips Japan; Dr. Shiono receives lecture fees from Abbott Medical Japan and Philips Japan; Dr. Asano receives lecture fees from Abbott Medical Japan and Philips Japan; Dr. Tanaka serves as an advisory board member for Abbott Medical Japan and Boston Scientific Japan; and Dr. Yokoi receives lecture fees from Boston Scientific Japan. The other authors report no conflicts.
Data availability statements
The data, analytic methods, and study materials will not be made available to other researchers for purposes of reproducing the results or replicating the procedure.
