


Abstract
Although alirocumab and evolocumab have both been associated with improved outcomes in patients with dyslipidaemia or established atherosclerotic cardiovascular disease, data on their respective performances are scarce. This study aimed at providing an indirect comparison of the efficacy and safety of alirocumab vs. evolocumab.
We conducted a systematic review and network meta-analysis of randomized trials comparing alirocumab or evolocumab to placebo with consistent background lipid-lowering therapy up to November 2018. We estimated the relative risk (RR) and the 95% confidence intervals (CIs) using fixed-effect model in a frequentist pairwise and network meta-analytic approach. A total of 30 trials, enrolling 59 026 patients were included. Eligibility criteria varied significantly across trials evaluating alirocumab and evolocumab. Compared with evolocumab, alirocumab was associated with a significant reduction in all-cause death (RR 0.80, 95% CI 0.66–0.97) but not in cardiovascular death (RR 0.83, 95% CI 0.65–1.05). This study did not find any significant differences in myocardial infarction (RR 1.15, 95% CI 0.99–1.34), stroke (RR 0.96, 95% CI 0.71–1.28), or coronary revascularization (RR 1.13, 95% CI 0.99–1.29) between the two agents. Alirocumab was associated with a 27% increased risk of injection site reaction compared to evolocumab; however, no significant differences were found in terms of treatment discontinuations, systemic allergic reaction, neurocognitive events, ophthalmologic events, or new-onset of or worsening of pre-existing diabetes.
Alirocumab and evolocumab share a similar safety profile except for injection site reaction. No significant differences were observed across the efficacy endpoints, except for all-cause death, which may be related to the heterogeneity of the studied populations treated with the two drugs.
Introduction
Reduction of low-density lipoprotein cholesterol (LDL-C) is a cornerstone of the prevention of atherosclerotic cardiovascular disease (ASCVD), which remains a leading cause of death worldwide.1,2 Over the last 15 years, proprotein convertase subtilisin-kexin type 9 (PCSK9) receptors have emerged as a valid therapeutic target in high-risk patients with whom a sufficient LDL-C reduction is not achieved despite proper use of the maximally tolerated dose of statins.3–8 Circulating PCSK9 binds hepatic LDL-C receptor, leading to its lysosomal degradation within cells, thus increasing plasma levels of LDL-C.3 Several monoclonal antibody agents selectively targeting PCSK9 receptors have been developed, aiming at further reducing LDL-C levels and thus lowering the risk of cardiovascular events.9,10 In particular, the use of alirocumab and evolocumab, the two most extensively studied PCSK9 inhibiting agents, has proven to be safe, associated with a significant reduction in ASCVD events.11,12 This has led to an early approval of these PCSK9 inhibitors by the Food and Drug Agency (FDA), in patients with familial hypercholesterolaemia and/or clinical ASCVD, who are already on maximally tolerated doses of statins therapy.5,13,14
In a prior systematic review and a meta-analysis of randomized controlled trials (RCTs), we demonstrated that PCSK9 inhibition with alirocumab or evolocumab was associated with a lower risk of myocardial infarction (MI), stroke, and coronary revascularization compared with control (i.e. other lipid-lowering agents or placebo) in this high-risk population.15 However, significant statistical interactions between the overall impact of PCSK9 inhibition and the type of agent used were observed for some clinical endpoints, including mortality, suggesting discrepancies in the respective effect of alirocumab and evolocumab.15 Therefore, we decided to conduct a network meta-analysis investigating the efficacy and safety of alirocumab vs. evolocumab to better evaluate the differences, if any. As our aim was to only assess the benefit-to-risk ratio of the two agents, we solely included RCTs comparing alirocumab or evolocumab to at least one placebo arm, with consistent background treatment of optimized lipid-lowering therapy across all arms.
Methods
We conducted a systematic review of the literature according to the Preferred Reporting Items for Systematic Reviews and Meta-analyses (PRISMA) guidelines (Supplementary material online, Table S1).16
Data sources and study selection
We searched PubMed/Medline, Cochrane Central Register of Controlled trials (CENTRAL) and clinicaltrials.gov up to November 2018 with no restriction on language. The following keywords were used: PCSK9 inhibitors, alirocumab, evolocumab, SAR236553, REGN727, or AMG145.15 Compared to our previous PROSPERO registered meta-analysis (CDR42018090768), we only included relevant published Phase II or III RCTs specifically comparing alirocumab or evolocumab to at least one placebo arm, with consistent background lipid-lowering therapy, in patients with dyslipidaemia and/or established ASCVD, without any restriction on follow-up or study size. In case of RCTs comparing alirocumab or evolocumab to several controls treatment, including at least one placebo arm, we only included data from patients treated with alirocumab or evolocumab and patients treated with placebo. Randomized controlled trials where alirocumab or evolocumab were only compared to other lipid-lowering agents without any placebo arm were excluded.
Data extraction and quality assessment
Relevant data were independently extracted by two of the authors (P.G. and S.S.) using predefined standardized data collection form and confirmed by two other investigators (D.K. and B.V.) with discrepancies being resolved by consensus. For each clinical trial, the following data were extracted: study characteristics (author names, year of publication, number of randomized patients in each group, and inclusion and exclusion criteria), study design (double-blind or open), methodological quality of the study, patient characteristics, treatment regimens (name, dose, and duration), efficacy, and safety endpoints in each treatment group. The methodological quality of each trial was evaluated using the Cochrane Collaboration tool for assessing risk of bias in randomized trials.17 This tool considers random sequence generation, concealment of the allocation sequence, blinding of participants and personnel, blinding of outcome assessment, incomplete outcome data, and selective reporting.
Outcomes
Efficacy endpoints of interest included all-cause and cardiovascular (CV) death, MI, stroke, and ischaemia-driven coronary revascularization. Safety endpoints of interest were adverse events leading to treatment discontinuation, injection site reaction, systematic allergic reaction, neurocognitive events, ophthalmologic events, new-onset of diabetes mellitus (DM), or worsening of pre-existing DM. Efficacy and safety endpoints were collected at the longest available time of follow-up according to the intention-to-treat principle.
Statistical analysis
A frequentist network meta-analysis was conducted to compare the relative efficacy and safety between alirocumab and evolocumab. Relative risks (RRs) with 95% confidence intervals (CI) were calculated. The statistical heterogeneity within designs (heterogeneity between studies of the same designs) and between designs (inconsistency between studies of different designs, i.e., indirect evidence differ from the direct evidence) was evaluated using the Q statistic.18 A fixed-effect model was used in the absence of heterogeneity. A sensitivity analysis only including Phase III RCTs was also performed to compare the relative efficacy and safety between alirocumab and evolocumab. Analyses were conducted using R, version 3.5.1, with the Netmeta® package.
Results
A flow-chart of the study analysis is shown in Figure 1. Of the 40 Phase II or III RCTs evaluating alirocumab or evolocumab published during the period of interest, a total of 30 studies compared one of the two agents to at least one placebo arm with consistent background lipid-lowering therapy and were therefore included in the analysis. A total of 59 026 patients were included, of whom 13 607 were treated with alirocumab, and 17 931 were treated with evolocumab. Overall, the mean weighted follow-up was 2.5 years with a total exposure of 144 907 patient-years of observation. For alirocumab and evolocumab individually, mean weighted follow-up was 3.3 years and 1.9 years, respectively, with a total exposure of 81 968 patients-years of observation and 62 939 patients-years of observation, respectively. Main characteristics of the included trials and their populations are detailed in Table 1. Maximally tolerated statins were used in less than 20% of the study population in 4 (13.3%) studies, either because of documented statin intolerance or assessment of PCSK9 inhibition as single therapy.10,19–21 Overall inclusion and exclusion criteria significantly varied across the trials, as detailed in the Supplementary material online, Table S2. Internal bias assessment is reported in Supplementary material online, Table S3.
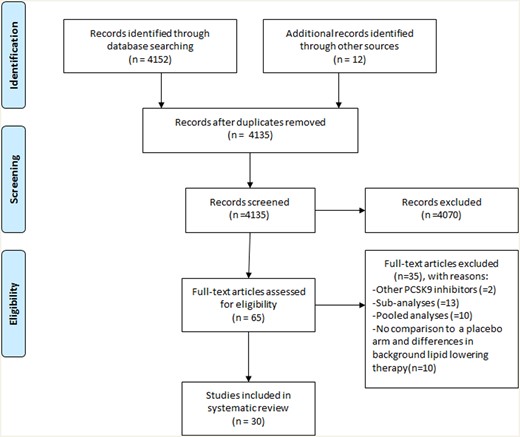
PRISMA study flow diagram. PCSK9, proprotein convertase subtilisin–kexin type 9; PRISMA, Preferred Reporting Items for Systematic Reviews and Meta-analysis.
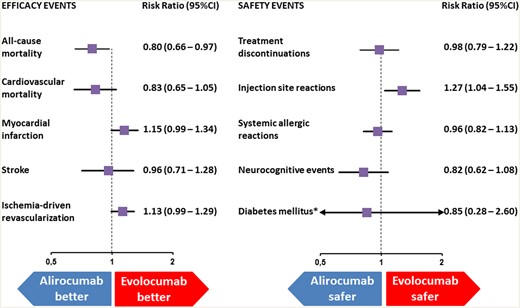
Indirect comparison of the safety and efficacy of evolocumab and alirocumab. *New-onset of diabetes mellitus or worsening of pre-existing diabetes mellitus; CI, confidence interval.
Main characteristics of the included trials
| Study Clinicaltrial.gov ID Year of publication | Investigational drug | Study design | Primary outcomes | Drug dosage | Follow-up/treatment duration (weeks) | Sample size (PCSK9/placebo) | Male sex (%) | Prior CAD (%) | Diabetes mellitus (%) | Patients on statin (%) | Patients on ezetimibe (%) |
|---|---|---|---|---|---|---|---|---|---|---|---|
| Alirocumab | Phase II, multicentre, randomized, double-blind, placebo-controlled | % change in LDL-C from baseline | 50, 100, or 150 mg Q2W, or 200 or 300 mg Q4W | 12 | 182 (151/31) | 48 | 6 | 12 | 100 | NP |
| Alirocumab | Phase II, multicentre, randomized, double-blind, placebo-controlled | % change in LDL-C from baseline | 150 mg Q2W | 8 | 92 (61/31) | 40 | 3 | 14 | 100 | 0 |
| Alirocumab | Phase II, multicentre, randomized, double-blind, placebo-controlled | % change in LDL-C from baseline | 150mg Q2W; or 150, 200 or 300 mg Q4W | 12 | 77 (62/15) | 61 | 42 | 4 | 100 | 71 |
| Alirocumab | Phase II, multicentre, randomized, double-blind, placebo-controlled | % change in LDL-C from baseline | 50, 75, or 150 mg Q2W | 12 | 100 (75/25) | 45 | 1 | 16 | 100 | NP |
| Alirocumab | Phase III, multicentre, randomized, double-blind, placebo-controlled | % change in LDL-C from baseline | 75 mg Q2W or 300 mg Q4W w/o statin, or 75 mg Q2W or 300 mg Q4W w/ statin | 48 | 802 (573/229) | 58 | 52 | 27 | 68 | 12 |
| Alirocumab | Phase III, multicentre, randomized, double-blind, placebo-controlled | % change in LDL-C from baseline | 150 mg Q4W or 75 mg Q2W | 24 | 231 (173/58) | 56 | 50 | 16 | 0 | 60 |
| Alirocumab | Phase III, multicentre, randomized, double-blind, placebo-controlled | % change in LDL-C from baseline | 75 or 150 mg Q2W | 52 | 314 (207/107) | 66 | 78 | 43 | 100 | 8 |
| Alirocumab | Phase IIIb, multicentre, randomized, double-blind, parallel-group | % change in LDL-C from baseline | 75 or 150 mg Q2W | 24 | 514 (344/170) | 55 | 32 | 100 | 75 | 12 |
| Alirocumab | Phase III, multicentre, randomized, double-blind, placebo-controlled | Rate of apheresis treatment | 150 mg Q2W | 18 | 62 (41/21) | 58 | 79 | 16 | 52 | NP |
| Alirocumab | Phase III, multicentre, randomized, double-blind, placebo-controlled | % change in LDL-C from baseline | 75 or 150 mg Q2W | 78 | 485 (322/163) | 56 | 46 | 12 | 100 | 57 |
| Alirocumab | Phase III, multicentre, randomized, double-blind, placebo-controlled | % change in LDL-C from baseline | 75 or 150 mg Q2W | 78 | 248 (167/81) | 53 | 36 | 4 | 100 | 66 |
| Alirocumab | Phase III, multicentre, randomized, double-blind, placebo-controlled | % change in LDL-C from baseline | 150 mg Q2W | 78 | 107 (72/35) | 53 | 50 | 14 | 100 | 24 |
| Alirocumab | Phase III, multicentre, randomized, double-blind, placebo-controlled | % change in LDL-C from baseline | 75 or 150 mg Q2W | 52 | 215 (143/72) | 61 | 19 | 69 | 100 | NP |
| Alirocumab | Phase III, multicentre, randomized, double-blind, placebo-controlled | % change in LDL-C from baseline | 150 mg Q4W or 150 mg Q2W | 12 | 163 (107/56) | 63 | 28.2 | 55 | 34 | 20 |
| Alirocumab | Phase III, multicentre, randomized, double-blind, placebo-controlled | % change in LDL-C from baseline | 75 or 150 mg Q2W | 24 | 199 (97/102) | 82 | 96 | 35 | 100 | 13 |
| Alirocumab | Phase III, multicentre, randomized, double-blind, placebo-controlled | % change in LDL-C from baseline | 150 mg Q2W | 78 | 2338 (1550/788) | 62 | 69 | 35 | 100 | 14 |
| Alirocumab | Phase III, multicentre, randomized, double-blind, placebo-controlled | Composite of death from CHD; non-fatal MI, fatal or non-fatal ischaemic stroke, or unstable angina requiring hospitalization | 75 or 150 mg Q2W | 208 | 18924 (9462/9462) | 75 | 100 | 29 | 98 | 3 |
| Evolocumab | Phase II, multicentre, randomized, double-blind, placebo and ezetimibe-controlled | % change in LDL-C from baseline | 280 vs. 250 vs. 420 mg Q4W; or 420 mg Q4W + Ezetimibe 10 mg daily | 12 | 157 (125/32) | 36 | 17 | 13 | 16 | 39 |
| Evolocumab | Phase II, multicentre, randomized, double-blind, placebo-controlled | % change in LDL-C from baseline | Q2W: 70 vs. 105 vs. 140 mg; Q4W: 280 vs. 350 vs. 420 mg | 12 | 631 (474/155) | 49 | 30 | 16 | 99 | 9 |
| Evolocumab | Phase II, multicentre, randomized, double-blind, placebo and ezetimib-controlled | % change in LDL-C from baseline | Q2W: 70 vs. 105 vs. 140 mg; or Q4W: 280 vs. 350 vs. 420 mg; or Ezetimibe 10 mg/day | 12 | 361 (271/45) | 34 | 0 | 0.2 | 0 | 0 |
| Evolocumab | Phase II, multicentre, randomized double-blind, placebo-controlled | % change in LDL-C from baseline | 350 mg or 420 mg Q4W | 12 | 167 (111/56) | 53 | 21 | NP | 90 | 65 |
| Evolocumab | Phase II, multicentre, randomized, double-blind, placebo-controlled | % change in LDL-C from baseline | 420 mg Q4W or 140 mg Q2W | 12 | 307 (205/102) | 63 | 25 | 38 | 100 | NP |
| Evolocumab | Phase III, multicentre, randomized, double-blind, placebo-controlled | % change in LDL-C from baseline | 420 mg Q4W | 52 | 901 (599/302) | 48 | 15 | 12 | 88 | 21 |
| Evolocumab | Phase III, multicentre, randomized, double-blind, placebo-controlled | Composite of cardiovascular death, MI, stroke, hospitalization for unstable angina, or coronary revascularization | 420 mg Q4W or 140 mg Q2W | 113 | 27 564 (13 784/13 780) | 75 | 81 | 37 | 100 | 5 |
| Evolocumab | Phase III, multicentre, randomized, double-blind, placebo-controlled | Nominal change in percent atheroma volume | 420 mg Q4W | 76 | 968 (484/484) | 72 | 100 | 21 | 99 | 2 |
| Evolocumab | Phase III, multicentre, randomized, double-blind, placebo- and ezetimib-controlled | % change in LDL-C from baseline | 420 mg Q4W or 140 mg Q2W | 12 | 1675 (1117/558) | 54 | 22 | 15 | 100 | 12 |
| Evolocumab | Phase III, multicentre, randomized, double-blind, placebo- and ezetimib-controlled | % change in LDL-C from baseline | 420 mg Q4W or 140 mg Q2W | 12 | 460 (306/154) | 31 | NP | 0.2 | 0 | 12 |
| Evolocumab | Phase III, multicentre, randomized, double-blind, placebo-controlled | % change in LDL-C from baseline | 420 mg Q4W or 140 mg Q2W | 12 | 329 (220/109) | 58 | 31 | NP | 100 | 62 |
| Evolocumab | Phase III, multicentre, randomized, double-blind, placebo-controlled | % change in LDL-C from baseline | 420 mg Q4W | 12 | 49 (33/16) | 51 | 43 | 6 | 100 | 92 |
| Evolocumab | Phase III, multicentre, randomized, double-blind, placebo-controlled | % change in LDL-C from baseline | 420 mg Q4W or 140mg Q2W | 12 | 404 (202/202) | 60 | 13 | 49 | 100 | NP |
NP, not provided; PCSK9, proprotein convertase subtilisin-kexin type 9 receptors inhibitors; Q2W, delivered every 2 weeks; Q4W, delivered every 4 weeks.
Data are only provided for the groups randomized to evolocumab/alirocumab and placebo.
Efficacy endpoints
Total number of events and event rates are detailed in Table 2. Indirect comparisons of alirocumab vs. evolocumab with respect to the clinical efficacy endpoints are depicted in Figure 1 and Supplementary material online, Figure S1. Compared with evolocumab, the present study found alirocumab to be associated with a lower relative risk of all-cause mortality (RR 0.80, 95% CI 0.66–0.97; P = 0.02). Conversely, this study found no significant differences between the two agents in terms of risk of CV death (RR 0.83, 95% CI 0.65–1.05, P = 0.12), MI (RR 1.15, 95% CI 0.99–1.34, P = 0.07), stroke (RR 0.96, 95% CI 0.71–1.28; P = 0.77) or ischaemia-driven coronary revascularization (RR 1.13, 95% CI 0.99–1.29; P = 0.06). Of note, when compared to placebo, each agent was associated with a lower risk of MI, stroke, or ischaemia-driven coronary revascularization, according to our results. There was no significant heterogeneity among the comparisons of efficacy outcomes.
Incidence rates of adverse events
| Alirocumab vs. placebo | Evolocumab vs. placebo | |||||||
|---|---|---|---|---|---|---|---|---|
| Alirocumab | Placebo | Evolocumab | Placebo | |||||
| No. events/ no. patients | Incidence rates (per 100 patient-year) | No. events/ no. patients | Incidence rates (per 100 patient-year) | No. events/ no. patients | Incidence rates (per 100 patient-year) | No. events/ no. patients | Incidence rates (per 100 patient-year) | |
| Efficacy events | ||||||||
| All-cause death | 354/13 607 | 0.84 | 407/11 446 | 1.02 | 450/17 931 | 1.41 | 431/16 040 | 1.38 |
| Cardiovascular death | 248/13 034 | 0.59 | 280/11 217 | 0.70 | 254/17 447 | 0.82 | 241/15 556 | 0.79 |
| Myocardial infarction | 649/12 873 | 1.55 | 748/11 153 | 1.88 | 482/16 248 | 1.53 | 653/15 099 | 2.11 |
| Stroke | 123/12 300 | 0.30 | 155/10 924 | 0.39 | 210/15 521 | 0.68 | 266/14 865 | 0.87 |
| Ischaemia-driven coronary revascularization | 797/12 300 | 1.92 | 862/10 924 | 2.17 | 814/15 649 | 2.64 | 1034/14 797 | 3.38 |
| Safety events | ||||||||
| Adverse events leading to treatment discontinuation | 570/13 565 | 1.36 | 424/11 427 | 1.06 | 276/17 432 | 0.89 | 228/15 532 | 0.73 |
| Injection site reactions | 688/13 414 | 1.64 | 302/11 396 | 0.76 | 415/17 791 | 1.31 | 269/15 984 | 0.86 |
| Systemic allergic reactions | 1056/12 956 | 2.53 | 874/11 176 | 2.20 | 420/13 769 | 1.41 | 393/13 756 | 1.32 |
| Neurocognitive events | 177/12 956 | 0.42 | 179/11 176 | 0.45 | 225/16 131 | 0.73 | 208/15 279 | 0.68 |
| Ophthalmologic events | 207/12 589 | 0.50 | 176/10 992 | 0.44 | 242/14 514 | 0.81 | 244/14 001 | 0.82 |
| New-onset or worsening of diabetes mellitus | 1272/12 232 | 3.08 | 1319/10 841 | 3.33 | 7/862 | 4.08 | 4/429 | 1.12 |
no., number of.
Safety endpoints
As detailed in the Figure 1 and Supplementary material online, Figure S2, this study found no significant difference regarding the risk of adverse events leading to treatment discontinuation between alirocumab and evolocumab (RR 0.98, 95% CI 0.79–1.22; P = 0.89). Similarly, no differences were observed in the risk of systemic allergic reaction (RR 0.96; 95% CI 0.82–1.13; P = 0.65), neurocognitive events (RR 0.82, 95% CI 0.62–1.08: P = 0.16), ophthalmologic events (RR 0.94, 95% CI 0.71–1.22; P = 0.62), or new-onset of DM or worsening of pre-existing DM (RR 0.85, 95% CI 0.28–2.60; P = 0.78). Our results support that each agent was associated with a higher relative risk of injection site reaction when compared to placebo. When compared to evolocumab, this study found alirocumab to be associated with a significant increase in the relative risk of injection site reactions (RR 1.27, 95% CI 1.04–1.55; P = 0.02). There was no significant heterogeneity among the comparisons of safety outcomes.
A sensitivity analysis, only including phase III RCTS, provided consistent results with respect to efficacy and efficacy endpoints (Supplementary material online, Figure S3).
Discussion
The main findings of this indirect comparison of alirocumab and evolocumab are as follows: (i) overall, alirocumab and evolocumab had a comparable efficacy profile in terms of stroke, MI, ischaemia-driven coronary revascularization, and CV death. (ii) Alirocumab was associated with an increased risk of injection site reaction, and no differences were observed between the two agents regarding other safety endpoints including the risk of adverse events leading to treatment discontinuation, systemic allergic reaction, neurocognitive events, ophthalmologic events, or new-onset of DM or worsening of DM.
Proprotein convertase subtilisin-kexin type 9 inhibitors have been established as adjunctive therapies to lower LDL-C cholesterol and reduce residual ASCVD risk.5,13 Their beneficial impact may not be limited to the LDL-C level reduction but could also include an inhibitory effect of the chronic inflammatory process of atherosclerosis, including the reduction of oxidized LDL-C uptake in smooth muscle cells or monocyte recruitment.3 The two FDA-approved agents alirocumab and evolocumab have been evaluated with various types of controls and background lipid-lowering therapies, and have resulted, in adequately powered RCTs, in lower risk of the composite of cardiovascular death, MI, stroke or unstable angina.11,12 However, their comparative safety and efficacy profiles remain unclear. To better clarify the benefit-to-risk ratio of the two agents, we solely included data from trials where the two PCSK9 inhibitors were compared to at least one placebo arm, on top of consistent and maximally tolerated background lipid-lowering therapy in order to reduce heterogeneity of treatment.
Overall, the use of a monoclonal antibody may be associated with several types of complications, first of which may stem from the interaction between the agent and the antigen in the targeted tissues (i.e. LDL-C level reduction via hepatic PCSK9 receptor inhibition). In this regard, the FOURIER trial did not report any adverse safety effect of reaching very low levels of LDL-C (e.g. <0.5 mmol/L), while major cardiovascular outcomes were further reduced.22 Of note, the achievement of very low levels of LDL-C via other lipid-lowering therapies was also found to be safe and protective against ischaemic events.23,24 Some studies have reported a link between PCSK9 inhibition and metabolic dysfunction, such as DM, via the modulation of very low-density lipoprotein receptor and triglyceride metabolism.25 Some loss of function variants of the PCSK9 gene have been associated with an increased prevalence of diabetes or prediabetes.26 Nonetheless, no significant increase in the incidence of new-onset of DM or worsening of pre-existing DM with alirocumab or evolocumab were reported in the RCTs and in the present study.11,12,27 Due to post-marketing safety concern of mild cognitive impairment associated with statins, PCSK9 inhibitors have also been investigated for neurocognitive impairment.28 Two recent pooled analyses of trials evaluating alirocumab and evolocumab separately did not report any significant increase in the risk of neurocognitive event with either agent.29,30 A dedicated sub-study of the FOURIER trial, using well-validated testing platforms, did not find any neurocognitive detriment following treatment with evolocumab, even when very low LDL-C level were reached.31 The immunogenicity of monoclonal antibodies may also cause unspecific hypersensitivity reactions which may result in reduced efficacy or injection site reactions. In this regard, bococizumab, a partially humanized monoclonal antibody, has been associated with the frequent development of neutralizing antibodies and injection site reactions.32 Conversely, alirocumab and evolocumab are both fully humanized monoclonal antibodies, without any reported cases of neutralizing antibodies. Even so, in the present analysis, alirocumab was associated with a higher rate of injection site reactions compared to evolocumab. Interestingly enough, this difference was not present in the broader meta-analysis comparing alirocumab and evolocumab as a therapeutic class to control, which may be partly explained by a more straightforward comparison in the present meta-analysis, only including double-blinded and placebo-controlled.15 Furthermore, both PCSK9 inhibitors and placebo were administered in a similar fashion across the trials (i.e. once or twice a month with consistent treatment periods) thus rendering unlikely that this finding would solely be explained by differences in study drug administration. It is of importance to note, however, that most injection site reactions reported across trials were of very mild intensity, and no differences between the two agents were found regarding treatment discontinuation because of adverse events.5,29
Across the included RCTs, as well as in the initial meta-analysis, alirocumab or evolocumab, on top of maximally tolerated lipid-lowering therapy were associated with a significant reduction of the risk of MI, stroke, and coronary revascularization, compared to control.15 However, a significant interaction between the two agents was present with respect to coronary revascularization suggesting that the risk reduction associated with evolocumab compared to control may be more important than with alirocumab. Using an indirect comparison meta-analysis method, we observed a trend toward higher risk ratio of coronary revascularization associated with evolocumab vs. alirocumab although it did not reach statistical significance. Conversely, in the present study, alirocumab was associated with a 20% risk reduction of all-cause mortality, as well as a 17% relative reduction, albeit not statistically significant, of CV mortality. Further studies are warranted to determine whether these differences in risk reduction are subsequent to a more efficient pharmacological effect of one agent compared to the other or to differences of the ischaemic risks at baseline between the two populations.
Limitations
Our findings should be interpreted in light of several limitations.33 First, differences between inclusion and exclusion criteria exist across the included trials, particularly in the two largest studies, the FOURIER and ODYSSEY OUTCOMES trials for evolocumab and alirocumab, respectively.11,12 Although all patients enrolled in these trials initially presented with uncontrolled LDL-C levels (i.e. >70 mg/dL) or non-HDL-C levels (i.e. >100 mg/dL) despite optimized statins therapy, FOURIER included patients with stable cardiovascular disease while ODYSSEY OUTCOMES enrolled patients with recent acute coronary syndromes who are inherently at higher risk of adverse ischaemic events.11,12 In fact, rates of major adverse cardiovascular events were higher in the control group of ODYSSEY OUTCOMES compared to FOURIER.11,12 Second, the mortality reduction with alirocumab was mainly driven by the ODYSSEY OUTCOMES trial, in which the results of key secondary endpoints were tested in a hierarchical fashion, and where the effect of alirocumab on all-cause death was not tested.12,34 Third, the mean weighted follow-up, as well as the total exposure were longer with alirocumab compared to evolocumab which may have impacted the probability of detecting a significant effect on mortality with evolocumab. Fourth, as we did not have access to patient-level data, we were not able to evaluate whether the respective impact of both agents differs according to baseline and follow-up LDL-C levels, or across age and gender.35 Finally, most of the trials included in the present study were already part of a prior systematic review and meta-analysis of RCTs comparing alirocumab or evolocumab to control, thus limiting the novelty of the presented data. However, our previous meta-analysis was centred on the combined evaluation of alirocumab or evolocumab, as a therapeutic class, while the present network meta-analysis, only including double-blinded and placebo-controlled, was the first study, to the knowledge of the authors, to compare the respective performance of each agent, in term of safety and efficacy endpoints. Thus, the main results of the present study, namely the similar safety profile except for injection site reaction, more frequent with alirocumab, and the consistent efficacy profile with respect to CV death, MI, stroke, or coronary revascularization, may shed some light on these two respective agents for the treatment of patients with familial hypercholesterolaemia and/or clinical ASCVD. Nonetheless, owing to the indirect nature of the comparison and the aforementioned limitations, our results should be considered as indicative and not robust. Adequately powered RCTs with head to head comparison of both agents are warranted to confirm these early results.
Conclusion
In this first network meta-analysis of the two FDA-approved PCSK9 inhibitors, alirocumab and evolocumab shared a similar safety profile. No significant differences were observed across the efficacy endpoints, except for all-cause death, which may be related to heterogeneity of the studied population and follow-up duration between the two drugs. Future studies with direct comparison of the two agents are warranted to confirm these early results.
Supplementary material
Supplementary material is available at European Heart Journal – Cardiovascular Pharmacotherapy online.
Conflict of interest: G.M. reports the following disclosures during the past 2 years research Grants to the Institution or Consulting/Lecture Fees from ADIR, Amgen, AstraZeneca, Bayer, Berlin Chimie AG, Boehringer Ingelheim, Bristol-Myers Squibb, Beth Israel Deaconess Medical, Brigham Women’s Hospital, Cardiovascular Research Foundation, Celladon, CME Resources, Daiichi-Sankyo, Eli-Lilly, Europa, Elsevier, Fédération Française de Cardiologie, Fondazione Anna Maria Sechi per il Cuore, Gilead, ICAN, Janssen, Lead-Up, Menarini, Medtronic, MSD, Pfizer, Sanofi-Aventis, The Medicines Company, TIMI Study Group, WebMD. R.M. reports Institutional Grant Support (funding to the institution)—AstraZeneca, Bayer, Beth Israel Deaconess, BMS, CSL Behring, Eli Lilly/DSI, Medtronic, Novartis Pharmaceuticals, OrbusNeich; Consulting Fees—Boston Scientific, Cardiovascular Systems Inc, Medscape, Regeneron Pharmaceuticals (no fee), Roivant Sciences, Siemens Medical Solutions, Sanofi, Abbott Laboratories (personal fees for speaking engagements; consultant (paid to the institution), Abiomed and The Medicines Company (consultant – spouse); Scientific Advisory Board/Advisory Board - PLx Opco Inc./PLx Pharma Inc. (scientific advisory board), Bristol Myers Squibb (advisory board; funding to the institution); Equity <1%—Claret Medical, Elixir Medical; Executive Committee (paid to the institution)—Janssen Pharmaceuticals, Osprey Medical; DSMB Membership (paid to the institution)—Watermark Research Partners. J.-P.C. has received research grants or honoraria from AstraZeneca, Bayer, Bristol-Myers Squibb, Daiichi-Sankyo, Eli Lilly, Fédération Française de Cardiologie, Lead-Up, Medtronic, Merck Sharp & Dohme, Sanofi, Servier, and WebMD. J.S. reports research grants, honoraria, and/or travel support from Amgen, Algorythm, AstraZeneca, Bayer, Daiichi-Sankyo, Gilead Science, Sanofi, and WebMD. M.K. reports research grants from Fédération Française de Cardiologie, Institut Servier, consultant or lecture fees from Bayer, Sanofi, Servier. B.L. reports research grants from Biotronik, Boston-scientific, Daiichi-Sankyo, Fédération Française de Cardiologie and Institute of Cardiometabolism and Nutrition; consultant fees from Daiichi-Sankyo and Eli Lilly; and lecture fees from AstraZeneca, Daiichi-Sankyo, and Novartis. M.Z. reports research grant from Institut Servier, Federation Francaise de Cardiologie and Bristol Myers Squibb. All other authors have no conflict of interest to disclose.
References
Research Centre for DE and Drug Safety and Availability - FDA Drug Safety Communication: Important safety label changes to cholesterol-lowering statin drugs. https://www.fda.gov/Drugs/DrugSafety/ucm293101.htm (15 February 2019).
Author notes
Paul Guedeney and Sabato Sorrentino authors contributed equally to the study.
