


To investigate the relationship between visit-to-visit blood pressure variability (BPV) and the progression of both carotid and coronary artery disease (CAD).
Data from two cardiovascular endpoint studies [Norvasc for Regression of Manifest Atherosclerotic Lesions by Intravascular Sonographic Evaluation (NORMALISE) and Prospective Randomized Evaluation of the Vascular Effects of Norvasc Trial (PREVENT)] were analysed separately. Systolic BPV was assessed as within-subject standard deviation of systolic BP across visits from 12-weeks onwards. Follow-up was 24 months (NORMALISE) or 36 months (PREVENT). Any association between BPV and progression of atherosclerosis was assessed using quantitative coronary angiography (QCA), intravascular ultrasound (IVUS), or B-mode ultrasound (depending on study). Patients from NORMALISE (n = 261) and PREVENT (n = 688 for QCA; n = 364 for ultrasound) were stratified within study according to median systolic BPV. No significant difference in change of minimal luminal diameter (by QCA in PREVENT) or change in percent atheroma volume or normalized total atheroma volume (by IVUS in NORMALISE) was detected for subjects with low BPV (BPV < median) compared with high BPV (BPV ≥ median), regardless of treatment. In PREVENT, a significantly greater reduction in maximum carotid intima-media thickness (IMT) (left and right common carotid artery far wall) was observed for patients with BPV < median compared with those with BPV ≥ median [least squares mean difference 0.06 (95% confidence interval 0.01, 0.11); P = 0.0271], after adjusting for treatment, carotid artery segment (left or right), baseline maximum carotid IMT, and other baseline and cardiovascular risk factors/covariates.
In patients with existing CAD and well-controlled BP, visit-to-visit BPV was not associated with progression of coronary atherosclerosis; however, a significantly greater reduction in maximum carotid IMT was observed for patients with low BPV.
Introduction
Hypertension is a major predictor of future cardiovascular events,1 and there is increasing evidence to suggest that long-term variability in visit-to-visit blood pressure (BP) may itself have prognostic significance in predicting cardiovascular outcomes, independent of elevated BP.2–5 With collective evidence indicating that BP variability (BPV) may be a useful method for predicting cardiovascular outcomes in an easily accessible, non-invasive, and cost-competitive manner, any link between underlying cardiovascular pathology and BPV needs clarification.
Many factors contribute to ongoing pathology in hypertension, including abnormalities in the vasculature and decreased arterial compliance.6 Long-term exposure of the arterial wall to increased pulsatile stresses may itself be associated with progression of atherosclerosis7 and furthermore may contribute to the increased risk of cardiovascular disease.8 Studies have also indicated that BPV correlates with carotid artery atherosclerosis and with level of arterial stiffness.9–11 More specifically, short-term variability in systolic BP (SBP), recorded during a single clinic visit, may be better correlated with underlying arterial stiffness and risk factors for atherosclerosis than traditional measures of average BP.12 Conversely, in patients with mild–moderate hypertensive and without coronary artery disease (CAD), although carotid intima-media thickness (IMT) was related to mean clinic/ambulatory SBP, no relationship to 24-h BPV was noted.12 Indeed, whether a significant relationship exists between long-term visit-to-visit BPV, and how cardiovascular outcomes are related to atherosclerosis progression, needs clarification.
To further investigate the link between BPV and atherosclerotic progression, we performed a post hoc analysis of the Prospective Randomized Evaluation of the Vascular Effects of Norvasc Trial (PREVENT) and the Norvasc for Regression of Manifest Atherosclerotic Lesions by Intravascular Sonographic Evaluation (NORMALISE).13,14 More specifically, any link between visit-to-visit BPV on the progression of both coronary atherosclerosis was assessed by both quantitative coronary angiography (QCA) and intravascular ultrasound (IVUS), and any link between BPV and progression of carotid IMT was assessed by B-mode ultrasound.
Methods
Study design and subjects
The study designs and methodology of NORMALISE and the PREVENT studies have been described in detail elsewhere.13,15 Both studies were approved by institutional review boards of participating centres, and all patients provided written informed consent prior to taking enrolment.
Briefly, NORMALISE was a sub-study of the randomized, double-blinded, placebo-controlled Comparison of Amlodipine vs. Enalapril to Limit Occurrences of Thrombosis (CAMELOT) study comparing amlodipine, enalapril, and placebo in 1991 patients (aged 30–79 years) with documented CAD and diastolic BP < 100 mmHg.15 From patients enrolled into CAMELOT, 431 patients (from 38 centres) participated in the NORMALISE sub-study, involving baseline and 2-year IVUS follow-up of a coronary artery with 20–50% stenosis by visual estimation, as described previously.14 PREVENT was a randomized, placebo-controlled, double-masked clinical trial that investigated whether amlodipine treatment slowed progression of coronary atherosclerosis, in 825 patients (aged 30–80 years) with angiographically documented CAD: defined as ≥30% diameter stenosis (non-intervened and non-infarcted) with at least one lesion of 5–20% stenosis that was not in a vessel with a ≥60% stenosis lesion. Diastolic BP was <95 mmHg.13 In both NORMALISE and PREVENT, sitting brachial BP was measured at baseline, at Month 1, and every 3 months thereafter using the same sphygmomanometer and same arm throughout. After 3 min of rest, seated BP was measured twice in 2-min intervals.
IVUS from the NORMALISE study
The average atheroma volume was calculated as: ∑(MCSV − LCSV)/number of cross-sections.
Normalized total atheroma volume (TAV) was used in the analyses, calculated as: average atheroma volume*average number of cross-sections (overall subjects in the study with valid IVUS measurements).
The endpoint in this analysis was defined as the change in PAV from baseline to 24 months and the change in normalized TAV from baseline to 24 months.
QCA and carotid ultrasound from the PREVENT study
The QCA was analysed as described previously.13 The endpoint in this analysis was defined as 3-year change in minimal luminal diameter (MLD). QCA data used MLD from left main, proximal left anterior descending (LAD), mid LAD, distal LAD, 1st diagonal, 2nd diagonal, proximal left circumflex, distal left circumflex, obtuse marginal, proximal right coronary artery (RCA), mid RCA, and distal RCA.
The progression of atherosclerosis in the carotid arteries was assessed using a B-mode ultrasonography as described previously.13 The endpoint for the progression of atherosclerosis in our analysis was defined as the 3-year change in the maximum IMT in the left and right common carotid artery far wall (LCF and RCF). A total of 377 participants were enrolled in the carotid ultrasound substudy with two examinations performed at baseline and every 6 months thereafter, for 36 months. Certified central readers blinded to the treatment assignment read the videotapes offline.13
Study treatments
In CAMELOT (and therefore NORMALISE), after a 2-week placebo run-in period, patients were randomized to amlodipine 5 mg (+ 1 placebo capsule), enalapril 10 mg (+ 1 placebo tablet) or one placebo tablet, and one placebo capsule, at the end of the second week of follow-up. In patients who tolerated the initial dose, the dose of amlodipine or enalapril was doubled. Participants taking the higher doses of medication and experiencing adverse effects were instructed to return to the lower dose (1 tablet and 1 capsule). The total follow-up duration for CAMELOT was 24 months.15
In PREVENT, patients initiated placebo or amlodipine (5 mg) once daily with up-titration to amlodipine 10 mg at the end of the second week, if tolerated. The follow-up duration of PREVENT was 36 months.13
Data analyses
BPV was defined as within-subject standard deviation (SD) of SBP measurements across visits from 12 weeks [or 3 months (84 days)] onwards. BPV was treated as a categorical variable, by BPV strata (<median, ≥median).
The BPV evaluable population was defined as patients who received at least one dose of study medication and had at least two post-baseline SBP measurements from 12 weeks [or 3 months (84 days)] onwards. The BPV median was calculated based on the BPV evaluable population.
For the CAMELOT (NORMALISE) study, BPV evaluable subjects who had baseline and final IVUS measurements (including early discontinuation) (BPV and IVUS evaluable population) were used for the analysis of PAV and normalized TAV. For the PREVENT study, BPV evaluable subjects who had baseline and final QCA measurements (including early discontinuation) were used for the analysis of coronary artery MLD (BPV and QCA evaluable population). BPV evaluable subjects who had baseline and final ultrasound measurements (including early discontinuation) were used for analysis of maximum carotid IMT (BPV and ultrasound evaluable population).
Baseline characteristics and/or cardiovascular risk variables (in addition to BPV) considered in these analyses were gender, age, body weight, study stratification factor [CAMELOT: percutaneous coronary intervention without stent placement, or stent placement, or no percutaneous coronary intervention; PREVENT: percutaneous transluminal coronary angioplasty (PTCA) or no PTCA], smoking status, alcohol consumption, family history of heart attack or sudden death, use of statin medications, baseline SBP, and mean SBP (mean of SBP values used to calculate the BPV). Baseline characteristics and/or cardiovascular risk variables were summarized descriptively by BPV strata and any association between these variables and BPV was evaluated using the analysis of variance model for continuous variables or Cochran–Mantel–Haenszel test for categorical variables.
Analysis of the effect of BPV on atheroma volume in the NORMALISE study
For analysis of PAV, if the systolic PAV measurement at 24 months was missing, the PAV measurements at 24 months were imputed using the last post-baseline PAV measurement. The change in PAV from baseline to 24 months and baseline PAV was summarized according to BPV strata within each treatment and with all treatment groups combined. The difference in PAV change between BPV strata was evaluated using a set of analysis of covariance (ANCOVA) models including (i) BPV strata and treatment as factors, and baseline PAV as a covariate; (ii) adding mean SBP as a covariate; and (iii) adding all baseline characteristics variables and/or cardiovascular risk variables as covariates. The least squares (LS) mean difference of PAV change for BPV ≥ median vs. BPV < median and the associated 95% confidence interval (CI) and P value are reported. The analyses for the effects of BPV on normalized TAV were similar to PAV.
Analysis of the effect of BPV on maximum carotid IMT in the PREVENT study
For each patient, if the ultrasound measurement at 3 years was missing, the ultrasound measurement at 3 years was imputed using the last post-baseline ultrasound measurement. The change in maximum carotid IMT from baseline to Year 3 is summarized by BPV strata for each segment within each treatment and with all treatment groups combined. The average values of change in IMT across segments were also summarized similarly. ANCOVA models including the factor of BPV strata and treatment group (for the overall analysis) and covariates of baseline maximum carotid IMT, mean SBP, and baseline SBP were fitted to the data for each segment and to the average values of segments.
The difference in the change in maximum IMT between BPV strata was also evaluated using a set of mixed-effects models including (i) BPV strata, segment, and treatment as factors and baseline maximum IMT as a covariate; (ii) adding mean SBP as a covariate; and (iii) adding all baseline characteristics variables and/or cardiovascular risk variables as covariates. Subject was treated as a random effect with a compound symmetry structure. The difference in change of maximum IMT for BPV ≥ median vs. BPV < median and the associated 95% CI and P value are reported. In addition, a set of ANCOVA models using the same factors and covariates as the mixed-effects models, except the factor of segment and the random effect, were fitted to the average values of segments.
Analysis of the effect of BPV on coronary artery MLD in the PREVENT study
For each patient, if the QCA outcome measurement at 3 years was missing, the measurement at Year 3 was imputed by the last post-baseline measurement. The change in MLD from baseline to Year 3 was summarized by BPV strata for each segment, within each treatment, and with all treatment groups combined. ANCOVA models including BPV strata as a factor and treatment group (for overall analysis) and covariates of baseline MLD, mean SBP, and baseline SBP were fitted to the data for each segment.
The difference in the change of the MLD between BPV strata was also evaluated using a set of mixed-effects models including (i) BPV strata, segment, and treatment as factors, and baseline MLD as a covariate; (ii) adding mean SBP as a covariate; and (iii) adding all baseline characteristics variables and/or cardiovascular risk variables as covariates. Subject was treated as a random effect with a compound symmetry structure. The difference of the change in MLD for BPV ≥ median vs. BPV < median and the associated 95% CI and P value are reported.
Results
Study populations
From NORMALISE, 261 patients were analysed and stratified according to systolic BPV≥(n = 148) or <(n = 113) the median (Table1). For NORMALISE, the average number of post-baseline BP readings were 7.6, 7.5, and 7.7 for the amlodipine, enalapril, and placebo arms, respectively. Patients with systolic BPV ≥ median had significantly higher mean SBP and baseline SBP compared with patients with BPV < median (Table1).
characteristics of the NORMALISE and PREVENT populations, stratified by median systolic BPV
| NORMALISE | PREVENT | |||||
|---|---|---|---|---|---|---|
| BPV and IVUS evaluable population (N = 261) | BPV and QCA evaluable population (N = 688) | BPV and ultrasound evaluable population (N = 364) | ||||
| BPV | <Median (N = 113) | ≥Median (N = 148) | <Median (N = 342) | ≥Median (N = 346) | <Median (N = 175) | ≥Median (N = 189) |
| Amlodipine | 38 (6.5 ± 1.8) | 47 (12.1 ± 3.3)*** | 215 (7.4 ± 1.7) | 140 (13.4 ± 3.3)*** | 108 (7.3 ± 1.7) | 75 (13.8 ± 3.6)*** |
| Enalapril | 38 (6.8 ± 1.7) | 48 (12.9 ± 3.7)*** | NA | NA | NA | NA |
| Placebo | 37 (7.1 ± 1.3) | 53 (14.2 ± 4.6)*** | 127 (7.8 ± 1.8) | 206 (14.1 ± 4.9)*** | 67 (7.5 ± 2.0) | 114 (15.0 ± 4.6)*** |
| Gender, M:F (% male) | 89:24 (78.8) | 118:30 (79.7) | 279:63 (81.6) | 278:68 (80.3) | 143:32 (81.7) | 153:36 (81.0) |
| Age, years | 55.5 ± 9.6 | 58.0 ± 9.6* | 56.8 ± 9.4 | 58.0 ± 9.6 | 55.0 ± 9.3 | 57.9 ± 8.8** |
| Weight, kg | 90.6 ± 16.0 | 90.7 ± 16.7 | 84.1 ± 16.1 | 82.9 ± 15.3 | 85.3 ± 15.2 | 84.5 ± 16.9 |
| Mean of SBP to calculate BPV | 122.2 ± 10.4 | 130.5 ± 11.9*** | 125.1 ± 12.0 | 133.9 ± 13.4*** | 124.2 ± 11.7 | 135.4 ± 14.0*** |
| BP variability | 6.8 ± 1.6 | 13.1 ± 4.0*** | 7.5 ± 1.7 | 13.8 ± 4.3*** | 7.4 ± 1.8 | 14.5 ± 4.3*** |
| Baseline SBP | 127.3 ± 15.2 | 132.4 ± 15.6** | 126.9 ± 16.6 | 133.7 ± 19.1*** | 126.1 ± 16.2 | 133.7 ± 20.5*** |
| Medical history and risk factors, n (%) | ||||||
| PTCA | NA | NA | 160 (46.8) | 140 (40.5) | 74 (42.3) | 67 (35.4) |
| No PCI at QCA | 46 (40.7) | 58 (39.2) | NA | NA | NA | NA |
| PCI with no stent at QCA | 6 (5.3) | 12 (8.1) | NA | NA | NA | NA |
| PCI with stent at QCA | 61 (54.0) | 78 (52.7) | NA | NA | NA | NA |
| Ever smoked (regularly) | 79 (71.2) | 109 (74.1) | 273 (79.8) | 268 (77.5) | 139 (79.4) | 144 (76.2) |
| Consumed alcohol | 58 (52.3) | 75 (51.0) | 157 (45.9) | 144 (41.6) | 75 (42.9) | 59 (31.2) |
| Family history of heart attack | 50 (45.5) | 62 (42.8) | 109 (31.9) | 106 (30.6) | 52 (29.7) | 59 (31.2) |
| Family history of sudden death | 12 (10.9) | 17 (11.8) | 53 (15.5) | 48 (13.9) | 19 (10.9) | 22 (11.6) |
| Statin use | 86 (76.1) | 99 (66.9) | 97 (28.4) | 91 (26.3) | 55 (31.4) | 63 (33.3) |
Data are shown as mean ± SD or n (%) unless otherwise specified. BPV is defined as the within-subject SD of SBP measurements across visits from 12 weeks (or 3 months or 84 days) onwards.
BPV, blood pressure variability; SD, standard deviation; SBP, systolic blood pressure; PCI, percutaneous coronary intervention; PTCA; percutaneous transluminal coronary angioplasty; PREVENT, Prospective Randomized Evaluation of the Vascular Effects of Norvasc Trial; NORMALISE, Norvasc for Regression of Manifest Atherosclerotic Lesions by Intravascular Sonographic Evaluation; IVUS, intravascular ultrasound; QCA, quantitative coronary angiography.
P < 0.05;
P < 0.01;
P < 0.0001.
For PREVENT, 688 patients comprised the BPV and QCA evaluable population for the change in coronary MLD analysis (n = 342, BPV <median n = 346, BPV ≥median), and 364 patients comprised the BPV and ultrasound evaluable population used for maximum carotid IMT analysis (n = 175, BPV <median; n = 189, BPV ≥median) (Table1). The average number of post-baseline BP readings for the PREVENT BPV and QCA evaluable population were 9.5 and 9.4 for the amlodipine and placebo arms, respectively. For the PREVENT BPV and ultrasound evaluable population, the average post-baseline BP readings were 9.1 (amlodipine) and 8.8 (placebo). As for PREVENT, patients (both QCA and ultrasound populations) with high systolic BPV (≥median) had significantly higher mean SBP and baseline SBP compared with patients with low BPV (<median) (Table1).
Analysis of PAV and normalized TAV (NORMALISE study; BPV and IVUS evaluable population)
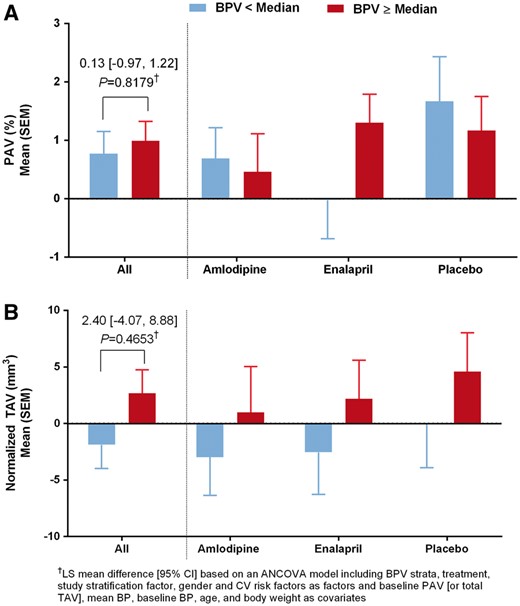
Change in PAV and normalized TAV by BPV strata overall and by treatment arm (NORMALISE, BPV, and IVUS evaluable population). PAV, percent atheroma volume; TAV, total atheroma volume; BPV, blood pressure variability; IVUS, intravascular ultrasound; NORMALISE, Norvasc for Regression of Manifest Atherosclerotic Lesions by Intravascular Sonographic Evaluation.
Analysis of BPV effect on MLD (PREVENT study; BPV and QCA evaluable population)
No significant differences in change in MLD from baseline to follow-up for BPV ≥ median vs. BPV < median were noted, regardless of segment (left main, proximal LAD, mid LAD, distal LAD, 1st diagonal, 2nd diagonal, proximal left circumflex, distal left circumflex, obtuse marginal, proximal RCA, mid RCA, or distal RCA) for each treatment or for all treatment groups combined (data not shown). When analysed overall, there was no significant difference for BPV ≥ median vs. BPV < median, even after adjustment for treatment, segment, and other factors and covariates (Table2).
Analysis of the BPV effect on MLD (PREVENT, BPV, and QCA evaluable population)
| MLD (mm) | PREVENT (BPV and QCA evaluable | |
|---|---|---|
| population) (N = 688) | ||
| <Median (N = 342) | ≥Median (N = 346) | |
| Model 1a | ||
| LS mean (SE) | –0.06 (0.01) | –0.07 (0.01) |
| LS mean difference (SE) | –0.00 (0.01) | |
| [95% CI] | [–0.03, 0.02] | |
| P value | 0.7401 | |
| Model 2a | ||
| LS mean (SE) | –0.06 (0.01) | –0.07 (0.01) |
| LS mean difference (SE) | –0.01 (0.01) | |
| [95% CI] | [−0.03, 0.01] | |
| P value | 0.4237 | |
| Model 3a | ||
| LS mean (SE) | –0.06 (0.01) | –0.07 (0.01) |
| LS mean difference (SE) | –0.01 (0.01) | |
| [95% CI] | [–0.04, 0.01] | |
| P value | 0.3671 | |
BPV and QCA evaluable population: patients received ≥1 dose of study medication and had ≥2 post-baseline SBP measurements from 12 weeks [or 3 months (84 days)] onwards and had baseline and final QCA measurements (including early discontinuation). Subject is included as a random effect in the mixed-effects model.
BPV, blood pressure variability; PREVENT, Prospective Randomized Evaluation of the Vascular Effects of Norvasc Trial; QCA, quantitative coronary angiography; MLD, minimal luminal diameter; SE, standard error; CI, confidence interval.
aModel 1: based on mixed-effects model including BPV strata, segment, and treatment as factors and baseline MLD as a covariate. Model 2: As per Model 1 additionally including mean BP as a covariate. Model 3: As per Model 2 additionally including study stratification factor, gender, and CV risk factors as factors, and baseline BP, age, and body weight as covariates.
Analysis of BPV effect on carotid IMT (PREVENT study; BPV and ultrasound evaluable population)
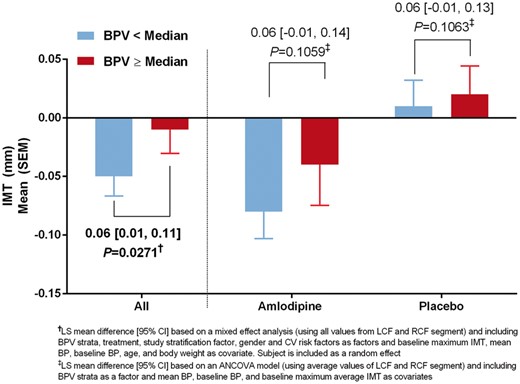
Change in maximum carotid IMT by BPV strata, overall and by treatment arm (PREVENT, BPV, and ultrasound evaluable population). IMT, intima-media thickness; BPV, blood pressure variability; PREVENT, Prospective Randomized Evaluation of the Vascular Effects of Norvasc Trial.
Analysis of the BPV effect on change in maximum carotid IMT
| IMT (mm) | Average of LCF and RCF (mm) ANCOVA modela | All of LCF and RCF (mm) mixed-effect analysisb | ||
|---|---|---|---|---|
| BPV < median (N = 175) | BPV ≥ median (N = 189) | BPV < median (N = 175) | BPV ≥ median (N = 189) | |
| Model 1 | ||||
| LS mean (SE) | –0.06 (0.02) | 0.00 (0.02) | –0.06 (0.02) | 0.01 (0.02) |
| LS mean difference (SE) | 0.06 (0.02) | 0.07 (0.02) | ||
| [95% CI] | [0.01, 0.11] | [0.02, 0.11] | ||
| P value | 0.0126 | 0.0061 | ||
| Model 2 | ||||
| LS mean (SE) | –0.06 (0.02) | 0.00 (0.02) | –0.06 (0.02) | 0.00 (0.02) |
| LS mean difference (SE) | 0.06 (0.03) | 0.06 (0.03) | ||
| [95% CI] | [0.01, 0.11] | [0.01, 0.11] | ||
| P value | 0.0234 | 0.0188 | ||
| Model 3 | ||||
| LS mean (SE) | –0.07 (0.03) | –0.01 (0.03) | –0.07 (0.03) | –0.02 (0.03) |
| LS mean difference (SE) | 0.06 (0.03) | 0.06 (0.03) | ||
| [95% CI] | [0.01, 0.11] | [0.01, 0.11] | ||
| P value | 0.0302 | 0.0271 | ||
BPV and ultrasound evaluable population: patients received ≥1 dose of study medication and had ≥2 post-baseline SBP measurements from 12 weeks [or 3 months (84 days)] onwards and had baseline and final ultrasound measurements (including early discontinuation).
BPV, blood pressure variability; IMT, intima-media thickness; PREVENT, Prospective Randomized Evaluation of the Vascular Effects of Norvasc Trial; ANCOVA, analysis of covariance; LCF, left common carotid artery far wall; RCF, right common carotid artery far wall; SE, standard error; CI, confidence interval; LS, least squares.
aUsing average values of LCF and RCF segments. Model 1: based on ANCOVA model including BPV strata and treatment as factors and baseline maximum average IMT as a covariate. Model 2: as Model 1 additionally including mean BP as a covariate. Model 3: as Model 2 additionally including study stratification factor, gender, and cardiovascular risk factors as factors and baseline BP, age, and body weight as covariates.
bUsing all values from LCF and RCF segments. Model 1: based on mixed-effects model including BPV strata, segment, and treatment as factors and baseline maximum IMT as a covariate. Model 2: as per Model 1 additionally including mean BP as covariate. Model 3: as per Model 2 additionally including study stratification factor, gender, and cardiovascular risk factors as factors, and baseline BP, age, and body weight as covariates. Subject is included as a random effect in the mixed-effects model.
Discussion
This post hoc analysis assessed the relationship between long-term BPV and atherosclerosis progression, via change of MLD (by QCA), change in atheroma volume, and change in carotid IMT over at least 24-month follow-up. Our key finding suggests that on-treatment visit-to-visit systolic BPV was significantly associated with maximum carotid IMT in patients with documented CAD and well-controlled BP, as a significantly greater reduction in maximum carotid IMT was observed for patients with low BPV. We did not, however, observe any significant association between progression of coronary atherosclerosis and BPV for either patient population analysed.
Previous studies have investigated the predictive value of visit-to-visit BPV with cardiovascular outcomes, via post hoc analyses of hypertension outcomes trials,2,16 or using data from observation cohort studies.3,8 A 2014 meta-analysis of 37 studies, representing 41 separate cohorts, demonstrated a modest, albeit significant association between visit-to-visit BPV and cardiovascular disease and all-cause mortality.17 However, the pathophysiology underlying any association between BPV and cardiovascular outcomes has not been well defined, for example using surrogate markers for underlying subclinical atherosclerosis, such as carotid IMT. Carotid IMT is itself predictive of future cardiovascular outcomes,18–20 and therefore the association with BPV in patients with well-controlled BP warranted further investigation.
Our analyses demonstrate that long-term BPV was significantly associated with change in maximum carotid IMT after 3-year follow-up, although systolic BPV was not significantly associated with progression of coronary atherosclerosis (change in atheroma volume and MLD), determined using ultrasound or QCA. Factors behind why we found no association between progression of coronary atherosclerosis based on PAV/normalized TAV, despite the significant relationship between systolic BPV and carotid IMT progression, are unclear. An association between within-visit variability of SBP and internal carotid plaque has been suggested by other studies of hypertensive patients on antihypertensive therapy,18,21,22 including a cohort of 201 high-risk elderly patients.11 It is important to point out that not all studies have found any association. For example, a post hoc analysis of the European Lacidipine Study on Atherosclerosis reported that despite carotid IMT being related with mean clinical or ambulatory SBP, there was no significant association between visit-to-visit SBP variability and carotid IMT.12 Although there are no clear reasons why these observations differ from those of this study, the effect of BPV on plaque progression may differ according to the cardiovascular risk status of the study population. For example, patients in the European Lacidipine Study on Atherosclerosis only had mild–moderate hypertension and were therefore relatively low cardiovascular risk,12 compared with PREVENT patients with known CAD,13 used in this study, or the elderly population studied by Nagai et al.11 Also, the different effect of oscillating shear stress on atherosclerosis progression may exist for the carotid arteries and the coronary arteries. Studies have shown that large arteries are more susceptible to intermittent oscillatory stress with the oscillatory stress causing increased oxidative stress as well as stimulation of cell adhesion expression.23 Furthermore, a study by Ku et al.24 has demonstrated that oscillating shear stress is associated with enhancement of carotid atherosclerosis. Our data suggest BPV may be an independent determinant of maximum IMT progression. However, differences within the literature highlight that further study is needed to clarify whether systolic BPV correlates with mild atherosclerosis progression in all patient populations.
Despite the benefits of antihypertensive agents, such as amlodipine, for reducing BPV and major adverse cardiovascular events,16,25–27 no clear relationship between systolic BPV and underlying atherosclerosis progression was detected with amlodipine or other antihypertensive treatment in this study. A consistent trend towards reduction in maximum IMT progression could be numerically seen by treatment arm and by segment for patients with low compared with high BPV; however, this reached significance for the amlodipine treatment arm for RCF only. Small sample size when analysed by treatment and by segment might be a factor in the data not reaching significance, even though when analysed overall a significant reduction in carotid IMT progression was noted. Cardiovascular events result from the composition and vulnerability of plaques; a relatively short-term follow-up of atherosclerotic plaque progression may not correlate well with future cardiovascular events. Indeed, it is not yet clear whether athero sclerotic plaque progression is associated with future increase in cardiovascular events. Although speculative, the increased variation of BP and the mechanical stresses that BPV exerts on plaques may increase the risk of plaque rupture and subsequent cardiovascular events.28 Therefore, further investigations are needed to determine whether the decrease in cardiovascular risk associated with reducing BPV with antihypertensive treatment is independent of underlying pathology.
There are some limitations of this study that needs to be highlighted. First, because of our study being a post hoc analysis of two clinical trials, we cannot account for unmeasured confounders that may have influenced the association between BPV and measures of atherosclerosis. Second, the relatively small number of patients as well as the relatively short follow-up period may be a source of some bias. Although the difference was statistically non-significant, subjects with BPV < median showed a numerical mean decrease in the normalized TAV, whereas subjects with BPV ≥ median showed a numerical mean increase in the normalized TAV. When observing this tendency, a larger study population with a longer follow-up period may have observed a significant association between coronary atherosclerosis progression and BPV. Finally, use of different antihypertensive agents may have confounded the effect of BPV on indices of atherosclerosis. However, a subgroup analysis according to the medications did not show an association between BPV and coronary atherosclerosis progression (data not shown).
Conclusion
Visit-to-visit systolic BPV was not significantly associated with progression of coronary atherosclerosis, but long-term BPV was an independent predictor for change in maximum IMT, in patients with well-controlled BP and documented CAD.
Supplementary material
Supplementary material is available at European Heart Journal - Cardiovascular Pharmacotherapy online.
Acknowledgements
Medical writing support was provided by Karen Burrows, MPhil, CMPP, of Engage Scientific Solutions (Horsham, UK).
Funding
This study was supported by Pfizer.
Conflict of interest: Drs Park and Kim act as paid consultants to Pfizer. Drs Yan, Jeffers, and Cerezo are employees of Pfizer.
