


Abstract
Short-term treatment with calcium channel blockers lowers levels of N-terminal pro B-type natriuretic peptide (NT-proBNP) and reduces rhythm-related symptoms compared to treatment with beta-blockers. The aim of this study was to compare the effects of metoprolol and diltiazem for rate control in patients with permanent atrial fibrillation (AF) after 6 months.
Men and women with permanent AF and preserved left ventricular systolic function were randomized to receive either diltiazem 360 mg or metoprolol 100 mg once daily. The primary endpoint was the level of NT-proBNP after a 6-month treatment period. Secondary endpoints included heart rate, rhythm-related symptoms and exercise capacity. A total of 93 patients (mean age 71 ± 7 years, 28 women) were randomized. After 6-months’ treatment, mean levels of NT-proBNP decreased in the diltiazem group and increased in the metoprolol group, with a significant between-group difference (409.8 pg/mL, 95% CI: 230.6–589.1, P < 0.001). Treatment with diltiazem significantly reduced rhythm-related symptoms compared to baseline, but no change was observed in the metoprolol group. Diltiazem and metoprolol had similar effects on heart rate and exercise capacity.
Diltiazem reduced NT-proBNP levels and improved rhythm-related symptoms. Metoprolol increased peptide levels but had no impact on symptoms despite similar heart rate reduction. Non-dihydropyridine calcium channel blockers should be considered more often for rate control in permanent AF.
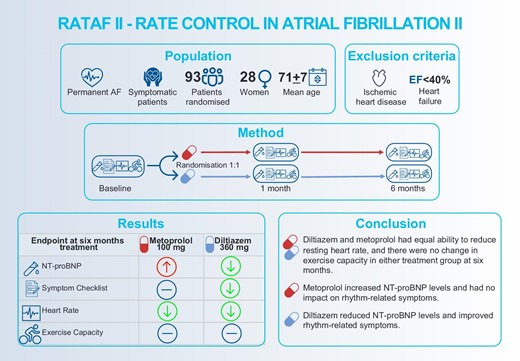
Figure developed by the authors with venngage.com with licence to use, reproduce and distribute. AF, atrial fibrillation; EF, ejection fraction; and NT-proBNP, N-terminal pro-B-type natriuretic peptide.
Introduction
The 2020 ESC Guidelines recommend following the Atrial fibrillation Better Care (ABC) pathway for comprehensive and optimal care for patients with atrial fibrillation (AF).1 The ABC pathway addresses stroke prevention (A), better symptom control (B), and associated cardiovascular risk factors and comorbidities (C). Adequate heart rate control plays a key role in achieving better symptom control, even for patients who eventually need rhythm control. It is cost-effective, easier to achieve and manage, and related to a lower hospitalization rate.2,3
In permanent AF without systolic heart failure, beta-blockers are often first-line choice of drug, even though non-dihydropyridine calcium channel blockers and beta-blockers are equally recommended in the current guidelines. However, there is a lack of robust evidence to support clinical decision-making regarding the choice of drug and dosage for rate control.1,2,4 Previous studies have compared various rate control regimens in diverse populations, with varying follow-up periods, and the results have been inconsistent.5–7
In the first RATe control in Atrial Fibrillation (RATAF) study conducted by our group, we compared the efficacy of three weeks’ treatment with diltiazem, verapamil, metoprolol, and carvedilol in a randomized crossover study in 60 patients with permanent AF and preserved left ventricular function. Despite all drug regimens having similar efficacy in reducing heart rate, the calcium channel blockers improved exercise capacity, reduced rhythm-related symptoms, and lowered levels of N-terminal pro B-type natriuretic peptide (NT-proBNP) compared to the beta-blockers.8,9 However, given the short treatment periods, it is not known whether these effects are sustained over time.
The aim of the present study was to compare the effects of 6 months’ treatment with the calcium channel blocker diltiazem and the beta-blocker metoprolol on levels of NT-proBNP, heart rate, rhythm-related symptoms and exercise capacity in patients with permanent AF without systolic heart failure in a randomized controlled trial.
Methods
Study design and population
The RATe control in Atrial Fibrillation II (RATAF II) study was designed as a prospective, randomized and investigator-blinded parallel-group study. The study included patients ≥18 years of age who had permanent, symptomatic AF of at least 3 months duration and a resting heart rate of ≥80 beats per minute (bpm) without ongoing rate-controlling treatment. The main exclusion criteria were heart failure with reduced ejection fraction (HFrEF) with an EF <40% and ischaemic heart disease. For the remaining exclusion criteria, see the Supplementary. Patients were recruited from four hospitals in south-eastern Norway.
Randomization and treatment
After enrolment and a 14-day washout period free from any rate-reducing drugs, the baseline visit was conducted by examinations over two consecutive days. Eligible participants were then randomized to receive either metoprolol slow-release tablets 100 mg once daily (AstraZeneca/Recordati) or diltiazem sustained release capsules 360 mg once daily (Pfizer). The study drug was administered in the morning, with half dose for the first 3 days, followed by full dose for the remainder of the follow-up period.
All examinations were conducted at the Department of Medical Research, Bærum Hospital, Gjettum, Norway to ensure standardized procedures. Each patient underwent examinations at the same time of day throughout the study to maintain consistency. The investigators and study personnel responsible for assessing outcomes were blinded to the study drug, while the participants were aware of their allocated drug.
Baseline examinations were repeated after 1 and 6 months. An experienced study nurse maintained monthly telephone contact with the participants to address any side effects or symptoms and promote treatment compliance. The hospital pharmacy assessed each patient`s compliance through pill count after 3 and 6 months of treatment.
Ethical considerations
The RATAF II study was approved by the Regional Ethics Committee (2015/1302) and the Norwegian Medicines Agency. The study was registered at www.clinicaltrials.gov (NCT02695992). Prior to any study-related procedures, each patient provided informed consent in accordance with the Helsinki Declaration.
Examinations
Heart rate recording
Resting heart rate was recorded by a standard 12-lead ECG in the supine position after 10 min of rest.
Blood samples, Biomarkers
Fasting venous blood samples were collected for routine blood tests. Non-fasting venous blood samples for assessment of NT-proBNP were drawn after 30 min of rest in the supine position before the exercise test, and immediately after peak exercise. Blood samples for serum analyses were prepared within 2 h by centrifugation at 2000 G for 15 min at room temperature, then pipetted into aliquots and frozen at −80°C to allow for later batch analyses. NT-proBNP levels were determined using a fully automated two-sided sandwich immunoassay with Atellica®IM NT-proBNP on an Atellica®IM 1600 Analyser (Siemens). The calculated coefficient of variation during the study period was 4.5% for 210 ng/L, 5.2% for 1470 ng/L, and 8.5% for 2280 ng/L.
Cardiopulmonary exercise test
The cardiopulmonary exercise test was conducted using a bicycle ergometer (Schiller Cardiovit AT-104 ergospiro) in accordance with the guidelines.10 Each patient underwent exercise testing using the same protocol at all visits. The choice of protocol was based on the expected peak oxygen uptake (VO2),11,12 aiming for a test duration of 8–12 min.
Rhythm-related symptoms
Symptoms associated with arrhythmia were assessed using the validated self-administered questionnaire called The Symptom Checklist—Frequency and Severity13 translated to Norwegian. It evaluates the frequency (scored 0–4) and severity (scored 1–3) of 16 symptoms possibly related to AF. This generates frequency scores ranging from 0 to 64 and severity scores ranging from 0 to 48, with higher scores indicating more frequent or more severe symptoms.
Echocardiography
Transthoracic echocardiography was performed at rest according to the recommendations for cardiac chamber quantification by echocardiography in adults,14 using a Vivid E 9 scanner (GE HealthCare, Horten, Norway).
Endpoints
The primary endpoint was NT-proBNP levels at rest and peak exercise at 6 months treatment. The main secondary endpoints were heart rate, rhythm-related symptoms and exercise capacity.
Sample size and power calculation
The sample size was determined based on the NT-proBNP outcome previously observed in the RATAF study,8 to obtain a power of 80% with a significance level of 5%, two-tailed tests. For the primary endpoint, NT-proBNP, 31 patients in each group would be sufficient to detect a difference similar to that found in the RATAF study between diltiazem and metoprolol. The first protocol had a target number of 120 patients in each group also to be able to detect a difference in the secondary endpoint peak oxygen uptake of 10%, and account for a drop-out rate of 20%. However, due to slow recruitment and in particular the impact of the COVID-19 pandemic, the Steering committee December 2020 decided to reduce the sample size to 100 patients and finally to end the study prematurely June 2021 because of the slow recruitment.
Statistical analyses
Data are presented as mean ± standard deviation (SD) for normally distributed continuous variables, and median (25th and 75th percentiles) for continuous variables that are not normally distributed. Categorical variables are reported as frequencies (%). For blood sample values that fall below the lower detection limit or above the cutoff level, the assay's respective minimum or maximum value was used for all relevant analyses. Comparison of continuous variables was done by Student's t-test or the Mann–Whitney U-test, depending on data distribution. Categorical data were compared using the Chi-square test or Fisher's exact test, as appropriate. The relationship between continuous clinical variables and outcomes was analysed using bivariate parametric or non-parametric correlations, depending on the distribution. Parametric or non-parametric matched pairs tests were used to compare baseline and follow-up data.
The difference in effect between the two treatment groups was analysed using a linear mixed model using maximum likelihood estimation with the outcome variable (baseline value) as a covariate. The baseline value was adjusted for by including it as an independent variable. The fixed effects consist of treatment group (two categories) and time (two points) as well as interaction between group and time. Dependency of observations within subjects was accounted for by including an individual-specific random intercept. Variables not normally distributed were logarithmically transformed. A two-tailed P-value of <0.05 was considered statistically significant. All principal analyses were conducted in the intention-to-treat population, which includes all randomized patients. The statistical analyses were performed using Stata version 17 (StataCorp, College Station, TX, USA).
Results
Between April 2016 and April 2021, 93 patients with permanent AF (28 women and 65 men) were randomized to receive diltiazem (n = 49) or metoprolol (n = 44). Figure 1 shows a flow chart of the inclusion process. Among the 80 patients that completed the entire follow-up period of 6 months, the overall compliance with the study drugs was 99.2%. Baseline characteristics for the randomized patients are shown in Table 1.
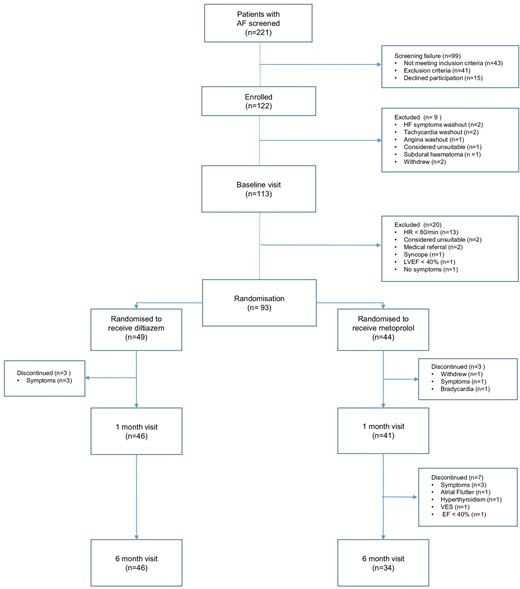
Flow chart of the study. n = number of patients.
Baseline characteristics for randomized patients, by drug.
| Variable | Total n = 93 | Diltiazem n = 49 | Metoprolol n = 44 |
|---|---|---|---|
| Age (years) | 71.1 (6.7) | 70.7 (6.0) | 71.5 (7.4) |
| Sex (women) | 30.1% (28) | 24.5% (12) | 36.4% (16) |
| CHA2DS2-VASc score | 2.5 (1.4) | 2.1 (1.2) | 2.9 (1.5) |
| Low Density Lipoprotein (mmol/L) | 3.0 (0.8) | 3.2 (0.9) | 2.8 (0.7) |
| Estimated GFR (mL/min) | 77.2 (12.3) | 76.9 (12.3) | 77.6 (12.5) |
| Haemoglobin (g/dL) | 15.1 (1.2) | 15.2 (1.2) | 14.9 (1.2) |
| Diabetes type 2 | 12.9% (12) | 4.1% (2) | 22.7% (10) |
| Hypertension | 65.6% (61) | 57.1% (28) | 75.0% (33) |
| Hypercholesterolaemia | 39.1% (36) | 35.4% (17) | 43.2% (19) |
| Previous stroke, TIA | 17.2% (16) | 14.3% (7) | 20.5% (9) |
| Chronic obstructive pulmonary disease | 4.3% (4) | 2.0% (1) | 6.8% (3) |
| Asthma | 10.8% (10) | 10.2% (5) | 11.4% (5) |
| Cigarette smoking status | |||
| Current | 5.4% (5) | 4.1% (2) | 6.8% (3) |
| Former | 51.6% (48) | 53.1% (26) | 50.0% (22) |
| Never | 43.0% (40) | 42.9% (21) | 43.2% (19) |
| Body Mass Index (kg/m2) | 28.9 (4.3) | 29.2 (4.2) | 28.4 (4.5) |
| LVEF (%) | 57.6 (9.3) | 57.2 (8.2) | 58.1 (10.5) |
| FEV1 (L) | 2.8 (0.8) | 2.9 (0.8) | 2.7 (0.8) |
| FEV1% predicted | 93.8 (15.9) | 96.2 (15.7) | 90.8 (15.8) |
| FEV1/FVC (%) | 74.2 (7.2) | 74.9 (7.0) | 73.2 (7.5) |
| DLCO % predicted | 96.2 (18.4) | 96.4 (20.0) | 95.9 (16.6) |
| Systolic blood pressure (mmHg) | 132.8 (14.5) | 133.2 (14.0) | 132.4 (15.2) |
| Diastolic blood pressure (mmHg) | 88.8 (11.7) | 89.2 (12.6) | 88.2 (10.7) |
| Heart rate at rest day 1 (bpm) | 92.8 (13.8) | 91.4 (12.7) | 94.3 (14.9) |
| Heart rate at rest day 2 (bpm) | 95.3 (16.0) | 94.8 (16.5) | 95.9 (15.6) |
| SCL Frequency | 12.7 (7.2) | 13.3 (7.4) | 12.1 (7.0) |
| SCL Severity | 11.2 (6.4) | 11.6 (6.6) | 10.8 (6.2) |
| SCL Frequency and Severity combined score | 23.9 (13.4) | 24.9 (13.8) | 22.9 (13.0) |
| mEHRA | |||
| 2a Mild Symptoms, daily activity not affected, not troubled | 17.2% (16) | 20.4% (10) | 13.6% (6) |
| 2b Moderate Symptoms, daily activity not affected, troubled | 66.7% (62) | 67.3% (33) | 65.9% (29) |
| 3 Severe Symptoms, daily activity affected | 16.1% (15) | 12.2% (6) | 20.5% (9) |
| Oral Anticoagulants | |||
| Apixaban | 38.7% (36) | 32.7% (16) | 45.5% (20) |
| Dabigatran | 18.3% (17) | 22.4% (11) | 13.6% (6) |
| Edoxaban | 1.1% (1) | 2.0% (1) | 0.0% (0) |
| Rivaroxaban | 19.4% (18) | 22.4% (11) | 15.9% (7) |
| Warfarin | 21.5% (20) | 18.4% (9) | 25.0% (11) |
| None | 1.1% (1) | 2.0% (1) | 0.0% (0) |
| Rate-or blood pressure controlling drugs at inclusion, before washout | |||
| Beta-Blockers | |||
| Bisoprolol | 3.2% (3) | 2.0% (1) | 4.5% (2) |
| Metoprolol | 65.6% (61) | 73.5% (36) | 56.8% (25) |
| Calcium Channel Blockers | |||
| Diltiazem | 6.5% (6) | 2.0% (1) | 11.4% (5) |
| Verapamil | 10.8% (10) | 6.1% (3) | 15.9% (7) |
| Amlodipine | 9.7% (9) | 8.2% (4) | 11.4% (5) |
| Lerkanidipine | 4.3% (4) | 6.1% (3) | 2.3% (1) |
| Nifedipine | 2.2% (2) | 4.1% (2) | 0.0% (0) |
| Digoxin | 11.8% (11) | 4.1% (2) | 20.5% (9) |
Values expressed as means ± SD (standard deviation), median (range) or n (%).
CHA2DS2-VASc score = a score of stroke risk assessment in AF patients, higher score indicating greater risk; TIA, transient ischaemic attack; Estimated GFR, estimated glomerular filtration rate, based on levels of creatinine, age and gender; LVEF, left ventricular ejection fraction; FEV1, forced expiratory volume in 1 second; FEV1/FVC, FEV1/Forced vital capacity; DLCO, diffusion capacity of the lung for carbon monoxide; SCL, symptom checklist; and mEHRA, Modified European Heart Rhythm Association class.
N-terminal pro-B-type natriuretic peptide levels
The diltiazem group exhibited a decrease in NT-proBNP levels from baseline, while the metoprolol group showed an increase in NT-proBNP levels (Table 2 and Figure 2). The difference in resting NT-proBNP levels between the two treatment groups was significant at both 1 month (470.4 pg/mL, 95% CI: 295.9–644.8, P < 0.001) and 6 months (409.8 pg/mL, 95% CI: 230.6–589.1, P < 0.001), with higher levels observed in the metoprolol group (Table 3). In the diltiazem group, the reduction in resting NT-proBNP levels compared with baseline reached statistical significance at 6 months (P = 0.011). Conversely, the increase in resting NT-proBNP levels in the metoprolol group was significant at both 1 month (P < 0.01) and 6 months (P = 0.014), compared with baseline.
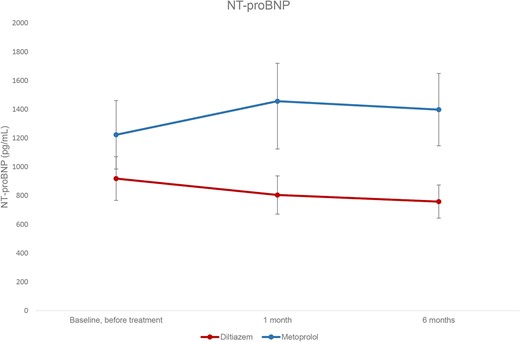
Resting levels of NT-proBNP at baseline and after one and six months’ treatment. Values expressed as means, with 95% CI error bars.
Mean heart rate at rest day 1, rest day 2 and at max exercise, NT-proBNP levels at rest and peak exercise, and peak oxygen uptake (VO2) according to allocated treatment group.
| Study visit | Baseline | One month | Six months | |||
|---|---|---|---|---|---|---|
| Variable | Diltiazem | Metoprolol | Diltiazem | Metoprolol | Diltiazem | Metoprolol |
| HR rest day 1 (beats/min) | 91 ± 13 | 94 ± 15 | 74 ± 12ƚ | 79 ± 15ǂ | 75 ± 13ƚ | 79 ± 12ǂ |
| HR rest day 2 (beats/min) | 95 ± 17 | 96 ± 16 | 78 ± 14ƚ | 80 ± 13ǂ | 78 ± 11ƚ | 80 ± 12ǂ |
| HR max (beats/min) | 194 ± 25 | 187 ± 23 | 162 ± 25ƚ | 158 ± 28ǂ | 158 ± 26ƚ | 155 ± 24ǂ |
| NT-proBNP rest (pg/mL) | 919 ± 529 | 1224 ± 784 | 804 ± 442§ | 1456 ± 883 | 759 ± 388§ | 1398 ± 721 |
| NT-proBNP peak (pg/mL) | 1069 ± 629 | 1489 ± 1006 | 930 ± 516§ | 1824 ± 1108 | 886 ± 454§ | 1602 ± 791 |
| NT-proBNP increase in response to exercise (pg/mL) | 174 ± 125 | 250 ± 231 | 141 ± 111§ | 332 ± 221 | 131 ± 83§ | 255 ± 143 |
| Peak VO2 (mL/kg/min) | 19.3 ± 4.9 | 18.7 ± 4.7 | 19.6 ± 4.8* | 18.5 ± 4.7 | 19.2 ± 5.2 | 18.3 ± 4.6 |
Values are presented as means ± SD.
P < 0.05 compared with baseline and treatment with metoprolol by linear mixed model.
P < 0.001 compared with baseline and treatment with metoprolol by linear mixed model.
P < 0.01 compared with baseline in the diltiazem group by t-test.
P < 0.01 compared with baseline in the metoprolol group by t-test.
Results from linear mixed model analyses of treatment with metoprolol compared to diltiazem
| Group difference at one month | Group difference at six months | |
|---|---|---|
| Metoprolol vs. Diltiazem | Metoprolol vs. Diltiazem | |
| NT-proBNP rest (pg/mL) | 470.4 | 409.8 |
| (295.9–644.8) | (230.6–589.1) | |
| P < 0.001 | P < 0.001 | |
| NT-proBNP peak (pg/mL) | 637.9 | 444.9 |
| (428.9–846.9) | (229.3–660.6) | |
| P < 0.001 | P < 0.001 | |
| NT-proBNP increase in response to exercise (pg/mL) | 159.6 | 93.2 |
| (109.1–210.2) | (41.2–145.2) | |
| P < 0.001 | P < 0.001 | |
| VO2 peak (mL/kg/min) | −0.92 | −0.69 |
| (−1.77–−0.07) | (−1.56–0.19) | |
| P = 0.034 | P = 0.126 |
Values are presented as the between-group difference, with 95% CIs and corresponding P-value.
Heart rate and blood pressure
Diltiazem and metoprolol had similar efficacy on resting heart rate at 1 and 6 months, with no significant differences between the treatment groups (Table 2). Systolic resting blood pressures were also similar between the two groups.
Rhythm-related symptoms
Treatment with diltiazem significantly reduced rhythm-related symptoms at 1 and 6 months, compared to metoprolol (Figure 3).
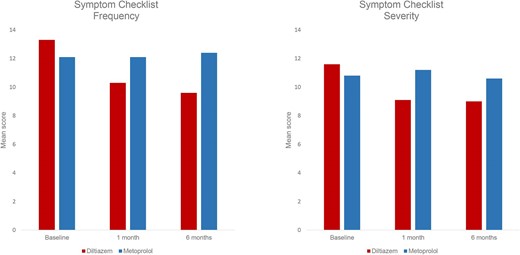
The Symptom Checklist mean score for frequency (left) and severity (right) by treatment group at baseline, at 1 and 6 months’ treatment. Symptom frequency (0–64). Symptom severity (0–48).
The mean score of symptom frequency showed a significant reduction in the diltiazem group, decreasing from 13.3 (±7.4) at baseline to 10.3 (±6.8) at 1 month and 9.6 (±6.8) at 6 months (P < 0.001 for both). Similarly, the mean score of symptom severity was significantly reduced from 11.6 (±6.6) at baseline to 9.1 (±6.1) at 1 month (<0.001) and 9.0 (±6.4) at 6 months (P = 0.005). In contrast, in the metoprolol group, there were no significant changes in the mean scores of symptom frequency or severity from baseline to 1 and 6 months. (Figure 3 and 4). See the Supplementary for figures depicting the mean score for each specific questions in each treatment group.
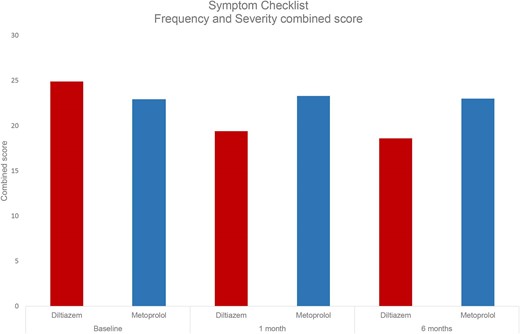
The Symptom Checklist mean combined score of frequency and severity by treatment group at baseline, at one and six month's treatment.
No significant correlations were detected between the mean scores of symptom frequency or symptom severity and levels of NT-proBNP, at any visit.
Exercise capacity
Patients on diltiazem had higher peak VO2 at 1 month, but this difference was no longer present at 6 months follow-up (Table 2, Table 3, and Figure 5).
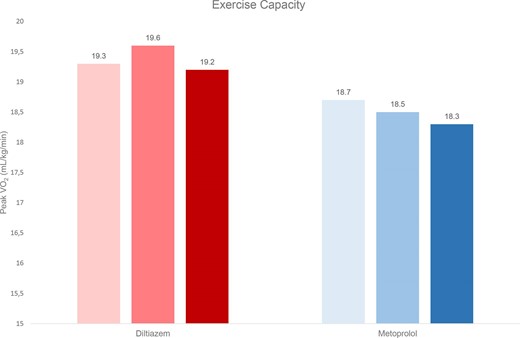
Exercise capacity by mean peak oxygen uptake at baseline (light bars), one (darker bars) and six (darkest bars) months by treatment group. Values expressed as means.
Discontinuations and adverse events
Out of the randomized patients, 10 patients were discontinued in the metoprolol group, versus three patients in the diltiazem group. Details on adverse events and serious adverse events are found in the Supplementary.
Discussion
Diltiazem for a duration of 6 months decreased levels of NT-proBNP and improved rhythm-related symptoms in patients with permanent AF. In contrast, metoprolol increased NT-proBNP levels and had no effect on symptoms, despite similar effects on heart rate. There were no significant between-group differences in exercise capacity after 6 months.
The observed effects on NT-proBNP confirm the findings of the first RATAF study, which demonstrated that the NT-proBNP levels were decreased by the use of calcium channel blockers, but increased by beta-blockers.8 However, the first RATAF study had a shorter treatment duration, leaving uncertainty regarding the long-term efficacy. The current study confirms that these changes in NT-proBNP persist after 6 months of treatment. The RATE-AF trial7 showed that the beta-blocker bisoprolol increased NT-proBNP levels, and these levels remained stable after 12 months of treatment, also suggesting a long-term effect.
Patients with persistent AF experience a lower quality of life compared with healthy individuals of the same age.15 This disparity is even more pronounced in females.15 Consistent with our previous findings16 the female participants in our study reported significantly more frequent and severe rhythm-related symptoms than male participants, regardless of treatment group.
The results of our study indicate that diltiazem 360 mg o.d. and metoprolol 100 mg o.d. exhibit comparable efficacy in reducing heart rate, both during resting conditions and at peak exercise. It is worth noting that a majority of the participants had resting heart rates below the lenient threshold of 110 bpm even without receiving rate-reducing treatment at baseline. However, as per the study’s inclusion criteria, all participants exhibited some degree of rhythm-related symptoms. According to ESC guidelines, strict rate control is primarily indicated to alleviate symptoms in patients with AF.1 We observed a significant reduction of rhythm-related symptoms only in the group receiving diltiazem, whereas no such improvement was observed in the metoprolol group. These findings are consistent with the results obtained in the initial RATAF study.8,16 However, in the RATE-AF study, no improvement in quality of life was seen in patients treated with bisoprolol or digoxin for rate control.7 The study did not include direct assessments of rhythm-related symptoms, which might be more readily influenced than overall quality of life. It did find better symptom control with digoxin, consistent with both lower NT-proBNP levels and fewer adverse events. Interestingly, despite observing consistent reductions in both symptoms and NT-proBNP levels in the diltiazem group, no significant correlation was found between these two endpoints.
Elevated NT-proBNP levels are observed in patients with AF, regardless of the presence of heart failure,17 suggesting the arrhythmia itself causes release of NT-proBNP by myocyte stretch.18 Furthermore, NT-proBNP levels are generally higher in permanent or persistent compared to paroxysmal AF.19 In addition, levels of NT-proBNP are higher in patients with diastolic dysfunction than with normal diastolic function.20 Elevated natriuretic peptide levels in patients with symptomatic cardiac disease usually indicates increased atrial and/or ventricular strain, reflecting pressure or volume overload. In patients with AF, the irregular ventricular rate, enlarged left atrium and absence of atrial contractions can lead to increased wedge pressures and wall tensions.21 After initiation of beta-blocker treatment in heart failure, there is often an initial increase in NT-proBNP levels, followed by a decline over time. We did not see such a decline over time on beta-blockers in this study. In AF, a larger proportion of the NT-proBNP release originates from the atria and it is possible that atrial myocardium has less benefit from beta blocker treatment over time than ventricular myocardium.22
Increased natriuretic peptide levels have been associated with a greater risk of progression to more persistent forms of arrhythmia and to other cardiovascular outcomes in patients with AF.23 Also, NT-proBNP levels are associated with increased risk of stroke, systemic embolism24 and mortality in AF patients.19,25 Although transient or no elevation of NT-proBNP in AF indicates a better prognosis compared with persistent elevation,26 it is unclear whether there is a correlation between NT-proBNP lowered by treatment and a favourable prognosis. The use of NT-proBNP levels to guide treatment of HFrEF has been shown to reduce mortality27 and improve clinical outcomes,28 and a similar approach has been proposed for managing AF.18
Many patients with AF experience decreased exercise tolerance.29,30 In line with what we observed in the first RATAF study,8 our data showed a significant between-group difference favouring diltiazem in peak VO2 after 1 month. However, with the longer follow-up of the present study, this difference did not remain statistically significant at 6 months.
The relationship between heart rate and exercise capacity in AF is complex.30,31 Beta-blockers lower heart rate, slow atrioventricular (AV) node conduction, and reduce contractility and relaxation, reducing cardiac output.4,32 Beta-blocker's ability to induce, aggravate or reveal chronotropic incompetence, may decrease exercise tolerance and oxygen uptake.30,32
The effect of non-dihydropyridine calcium channel blockers on heart rate is use-dependent, having minimal impact on sinus rate, filling pressures and wall stress. Calcium channel blockers can maintain or improve exercise capacity via less negative inotropic effect and prolonged AV node conduction time, improving diastolic filling and cardiac output.16,31 This may explain why they are better tolerated than beta-blockers.4,33 Growing evidence suggests that calcium influx during rapid atrial rates plays an important role in electrical remodelling, and calcium channel blockers may prevent or delay this process.33–35 Verapamil reduced the progression to persistent AF in RACE4, suggesting beneficial effects of choosing calcium channel blockers for rate control in non-permanent AF.33 In a prospective observational registry of AF patients on rate control, a subgroup of patients with HF on a personalized regimen of diltiazem, either alone or combined with beta-blockers, was found to experience clinical benefit. However, further research is needed to confirm these findings and identify patient groups who might benefit from these drugs.36
A recent review on the use of beta-blockers as the preferred rate-controlling agent in AF suggests that they are overused, and clinicians should consider alternative options.4 When deciding which rate-reducing agent to prescribe, clinicians should consider the agent’s rate-reducing properties, ability to control symptoms, potential adverse effects, and possible prognostic benefits. Our findings contribute to the evidence that diltiazem provides comparable rate-reducing effects and better symptom control compared with metoprolol.
Limitations
The generalizability of the results may be limited by a ‘healthy recruitment bias’ in that patients had to be able to participate in several repeated visits for an extended follow-up period. In addition, the patients were mainly recruited from a limited area in eastern Norway, there was a higher proportion of men, and our patients are of European ancestry. The study was not powered in order to be able to prove a difference in effect on peak VO2. Our findings may not be valid for patients with left ventricular ejection fraction (LVEF) <40% or ischaemic heart disease as these were excluded from the study. This might make our population healthier or with fewer symptoms than AF patients with these comorbidities. As the design was single-blinded and the patients were aware of their allocated treatment, potential expectations regarding the outcome may have affected the symptom scoring, resulting in overstated results in either direction.
Conclusion
Six months’ treatment with diltiazem effectively lowers levels of NT-proBNP, reduces heart rate, and significantly improves symptoms related to AF. In contrast, treatment with metoprolol leads to increased levels of NT-proBNP, and has no effect on symptoms, despite achieving a comparable reduction in heart rate. Non-dihydropyridine calcium channel blockers should be considered more often for rate control in permanentAF.
Acknowledgements
The authors thank all patients participating in the RATAF II study, for dedicating their time and effort. We would also like to thank our colleagues and study staff at the Department of Medical Research, Bærum Hospital as well as colleagues aiding the recruitment phase at the other participating hospitals.
Funding
This work was supported by a grant from the South-Eastern Norway Regional Health Authority, and by the Vestre Viken Hospital Trust.
Conflict of interest: The authors have nothing to declare.
Data availability
The dataset used in this study is not publicly available, as the Data Protection Authority approval and patient consent do not allow for this.
Author's contribution
Substantial contributions to the conception and design: A.T., S.R.U. Acquisition of data: K.E., S.O., S.E., P.S.R., M.G.S., T.S., A.H., K.A., H.A.A., A.H.P., C.H., A.T., and S.R.U. Analysis and interpretation of data: K.E., A.H.P., A.R., A.T., and S.R.U. Drafted the article: K.E., A.T., and S.R.U. Revised it critically and given finally approval: All authors. Agreed to be accountable for all aspects of the work: All authors.
