


Abstract
Contemporary guidelines differ in their recommendations regarding initiating non-vitamin K antagonist oral anticoagulants (NOACs) in patients with atrial fibrillation (AF) at low risk of stroke. This study aimed to examine the effectiveness and safety of NOACs for low-risk AF in a Japanese cohort.
In this retrospective cohort study based on the JMDC Claims Database extracted between April 2011 and November 2022, we identified 13 291 patients with AF at low risk of stroke. We performed inverse probability of treatment weighting Cox regression analyses to compare the embolization and bleeding risks between the nontreatment and NOAC groups. Net clinical benefit was defined as the annual incidence of ischaemic stroke events prevented by NOACs after subtracting intracranial haemorrhage (ICH) events attributable to NOACs, multiplied by a weighting factor. The incidences of stroke and ICH in the nontreatment group were 0.47 and 0.15 per 100 person-years, respectively. The NOAC group had higher incidences of ICH (hazard ratio [HR]: 1.73, 95% confidence interval [CI]: 0.75–4.00) and stroke (HR: 1.41, 95% CI: 0.84–2.36). The net clinical benefit of NOAC treatment was −0.35% per year (95% CI: −0.99–0.29%).
Non-vitamin K antagonist oral anticoagulants treatment may be associated with a slightly high risk of ICH, and it yielded a neutral clinical benefit in the present Japanese population, which provides reassurance concerning the role of ethnicity in NOAC treatment for patients with AF and suggests a need to assess comprehensive weighting of the respective risk factors.
Introduction
Oral anticoagulation decreases the risks of stroke and mortality in patients with atrial fibrillation (AF) and a higher stroke risk.1,2 Contemporary guidelines endorse the employment of the risk-factor-based CHA2DS2-VASc (Congestive heart failure, Hypertension, Age >75 years, Diabetes mellitus, Stroke, Vascular disease, Age 65–74 years, and Sex category [female]) score to estimate the risk of stroke.3 If the score exceeds a certain level, the advantages of oral anticoagulation on stroke prevention are estimated to outweigh the drawbacks of bleeding complications concomitant with the treatment. The European Society of Cardiology recommends that anticoagulation therapy should be considered at CHA2DS2-VASc scores of 1 in men and 2 in women.4 By contrast, the American College of Cardiology/American Heart Association recommends oral anticoagulation for patients with CHA2DS2-VASc scores ≥2 in men or ≥3 in women.5 These discordant recommendations underscore the substantial clinical need for studies to investigate whether to initiate non-vitamin K antagonist oral anticoagulants (NOACs) in patients with AF and a single, nonsex CHA2DS2-VASc risk factor.
Based on the threshold of the stroke risk, previous studies have determined whether NOACs should be initiated in these patients6,7; however, this threshold does not account for the increased risk of intracranial haemorrhage (ICH). A clinical benefit of NOACs defined by the balance between a decrease in stroke and an increase in ICH would be more favourable. To date, only one observational study has examined the clinical benefit of NOACs.8 Moreover, the incidence rates of stroke and ICH differ among racial and ethnic groups.9–11 Particularly, the rate of ICH was higher in Asians than non-Asians in large randomized controlled clinical trials comparing NOACs with warfarin.12–14 Additionally, ICH experienced by patients with AF accounts for approximately 90% of deaths by vitamin K antagonist-associated haemorrhage as well as most disabilities.15
Regardless of these ethnic differences in the rates of stroke and ICH, only studies that have methodological limitations in Western European databases have demonstrated positive clinical benefits.8 Thus, there is still considerable uncertainty regarding NOAC initiation in the low-risk AF population. Our objective was to investigate the clinical benefit of NOACs among Japanese patients with low-risk AF, who are considered to have lower stroke and higher ICH risks than non-Asians.
Methods
The Institutional Review Board of the University of Tokyo approved this study, and the requirement for informed consent was waived due to the anonymous nature of the data.
Data source and study cohort
This retrospective observational study used the JMDC Claims Database (JMDC Inc., Tokyo, Japan), which comprises insurance claims and health checkup databases from January 2005 to December 2021 (mainly for employees aged <75 years). Data were extracted from the database for patients newly diagnosed with AF between April 2011 and November 2022. We defined patients with AF by the disease name and excluded those with valvular AF, atrial flutter, and other supraventricular tachycardia (Supplementary material online, Table S1). We excluded patients with International Classification of Diseases, Tenth Revision (ICD-10) codes for mechanical valves or mitral stenosis within 365 days prior to AF diagnosis. We excluded patients with a diagnosis of major bleeding and ICD-10 codes other than AF indicating the use of oral anticoagulation within 182 days prior to AF diagnosis. Additionally, we excluded patients who received both vitamin K antagonist and NOAC prescriptions in the exposure window. We excluded patients who received antiplatelet prescriptions within 90 days prior to the diagnosis of AF. We set a 1-year look-back period to identify new NOAC users. Following a 14-day quarantine period after the initial date of AF diagnosis, the 15th day was defined as the cohort entry date.16 We restricted the follow-up period to 2 years as patients with AF may develop new CHA2DS2-VASc risk factors over time (Figure 1).17,18
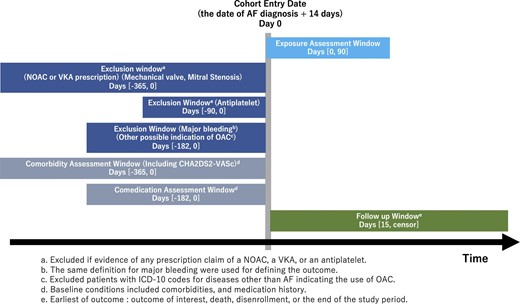
Cohort study design. There was a 14-day quarantine period following AF diagnosis. The exclusion criteria were: a diagnosis code other than AF indicating the use of oral coagulation, or a diagnosis code for mechanical valves or mitral stenosis within 365 days prior to AF diagnosis; a diagnosis code for major bleeding within 182 days prior to AF diagnosis; receiving both vitamin K antagonist and NOAC prescriptions within the exposure window; receiving antiplatelet treatment within 90 days prior to AF diagnosis; receiving a NOAC prescription within 365 days prior to AF diagnosis. AF, atrial fibrillation; NOAC, non-vitamin K antagonist oral anticoagulant.
Antithrombotic treatment
We extracted all NOAC prescriptions administered to patients within 90 days following AF diagnosis. Patients were allocated to the NOAC group when NOACs were prescribed at least once. The person-time between the cohort entry date and the first NOAC prescription date was classified as the nontreatment group, and the subsequent follow-up time was classified as the NOAC group (Supplementary material online, Figure S1).19 A patient experiencing stroke prior to NOAC initiation only contributed to the person-time in the nontreatment group and not in the NOAC group. We defined the daily dose of NOAC as the initial dose mentioned in the NOAC prescriptions. We classified the daily dose as a reduced dose if the daily dose was 220 mg/day for dabigatran, 10 mg/day for rivaroxaban, 5 mg/day for apixaban, and 30 mg/day for edoxaban. We defined under-dose as a dose less than the reduced dose and over-dose as a dose more than the standard dose. We controlled the data in concordance with the intention-to-treat analysis and did not consider adherence to NOAC therapy and antiplatelet therapy after the AF diagnosis.
Outcome definition and net clinical benefit
We evaluated outcomes for effectiveness and safety. The main outcome for treatment effectiveness was hospital admission due to ischaemic stroke or systemic embolism; the main outcome for safety was hospital admission due to ICH or gastrointestinal bleeding. We defined each outcome event as the first admission with ICD-10 codes for the outcome events, followed by outcome-specific treatment (Supplementary material online, Table S2).
We defined clinical benefit as the annual rate of stroke events prevented by NOACs minus ICH events which could be attributable to NOACs, multiplied by a weighting factor.20–22 The formula of clinical benefit: (stroke rate in nontreatment group—stroke rate in NOAC group)—weight (ICH rate in NOAC group—ICH rate in nontreatment group). The weighting factor embodies the relative impact of an ICH while undergoing NOAC treatment vs. experiencing a stroke in the absence of NOAC treatment. We assigned a base case weighting factor of 1.5 following previous studies,8,20 and provided additional sensitivity analyses by employing weighting factors of 1.0 and 2.0.
Variables
We only included patients with a single, nonsex CHA2DS2-VASc risk factor. We defined the risk factors for the CHA2DS2-VASc score using the ICD-10 codes and treatments listed in Supplementary material online, Table S3.23 Prescription within 180 days prior to AF diagnosis was defined as the baseline medication. Baseline medications of interest included aspirin, P2Y12 inhibitors, beta-blockers, calcium channel blockers, corticosteroids, digoxin, diuretics, heparin, insulin, nonsteroidal anti-inflammatory drugs, oral diabetic drugs, proton pump inhibitors, thyroid replacements, and renin-angiotensin-aldosterone system inhibitors. We defined baseline comorbidities as diagnoses within 1 year prior to AF diagnosis. Baseline comorbidities of interest—besides the components of the CHA2DS2-VASc score—were diagnoses of alcohol abuse, anaemia, atherosclerosis, bleeding predisposition, cancer, duodenitis/gastritis, dyslipidaemia, fracture, liver disease, peptic ulcer, pulmonary disease, and renal disease one year prior to AF diagnosis; the ICD-10 codes used are listed in Supplementary material online, Table S4. We defined the risk factors for the HAS-BLED score using the ICD-10 codes and treatments listed in Supplementary material online, Table S5.23
Statistical analyses
Descriptive statistics are reported as counts (percentages). We employed propensity-score inverse probability of treatment weighting (IPTW) Cox regression analyses with a robust variance estimator to contrast the risks for each outcome event. We used a logistic regression model to calculate propensity scores, and the model was based on the following potential confounding variables: age, sex, and the aforementioned baseline medications and comorbidities. We calculated standardized differences to compare patients’ confounders between the nontreatment and NOAC groups; a standardized mean difference of <0.10 denoted a negligible difference between the two groups.24 We used a bootstrap sample of 1000 replications to obtain the 95% confidence intervals (CIs) for clinical benefit between the nontreatment and NOAC groups. All statistical analyses were conducted using Stata/MP 16.0 (StataCorp, College Station, TX, USA).
Additional analysis
Following the previous study, we modified patients’ baseline medication period (90 days prior to AF diagnosis in the main analysis).8 Accordingly, we altered the exclusion window for NOACs to between 90 and 455 days prior to the diagnosis of AF.
Sensitivity analyses
Three sensitivity analyses were performed; first, we used narrower and wider exposure windows (30, 180, and 365 days) to evaluate the impact of immortal time bias on our main analysis. If immortal time bias remained, the hazard ratio (HR) would attenuate or inflate.19 Second, we used the landmark method to investigate whether we could account for immortal time bias and selected 60 and 120 days after cohort entry as alternative landmark times.25,26 Exposure windows were defined between the index and landmark dates, and all patients were followed up from the landmark date, rather than the cohort entry date. Patients who died, or for whom data were censored before the landmark date were excluded from the analysis (Supplementary material online, Figure S2). Third, we used exclusion methods wherein we excluded the person-time year before the date of prescription from the analysis. For patients prescribed NOACs, follow-up began from the date of prescription. Fourth, we censored the observation when the patient started antiplatelet therapy.
Subgroup analysis
We performed subgroup analyses and stratified patients with a score of 1 given by age and by another variable.
Results
We identified 13 291 patients with newly diagnosed AF with a single, nonsex CHA2DS2-VASc risk factor. Baseline characteristics are provided in Table 1. In total, 3573 (27%) patients were treated with NOACs, and 9718 (73%) were untreated throughout the follow-up period (Table 1; untreated patients switching to NOACs were included in both cohorts). Among patients treated with NOACs, 31% were treated with rivaroxaban, 29% with edoxaban, 26% with apixaban, and 14% with dabigatran. The proportions of reduced-dose users were 14% for rivaroxaban, 41% for edoxaban, 15% for apixaban, and 47% for dabigatran. The proportions of under-dose and over-dose users were 1.5 and 0.25% of the NOAC users, respectively. One patient with under-dose NOAC encountered SAH, and another patient with under-dose encountered systemic embolism. The mean ages were 61.1 and 61.9 years in the NOAC and nontreatment groups, respectively. No significant differences were found in the variables included in the propensity score calculation between the NOAC and nontreatment groups in the weighted population (Table 1). The mean HAS-BLED scores were 1.04 and 1.07 in the NOAC and nontreatment groups, respectively (Supplementary material online, Table S6).
Demographic and clinical characteristics of all patients, and propensity-score inverse probability of treatment weighted patients
| Unmatched | Propensity-score inverse probability of treatment weighting | |||||
|---|---|---|---|---|---|---|
| Nontreatment (n = 9718) | NOAC (n = 3573) | SMD | Nontreatment (n = 10 002) | NOAC (n = 3406) | SMD | |
| Age, yr | 61.9 | 61.1 | 0.081 | 61.4 | 61.2 | −0.023 |
| Male sex | 6411 (66) | 2812 (79) | -0.25 | 7003 (69) | 2364 (70) | −0.014 |
| Comorbidity | ||||||
| Hypertension | 2721 (28) | 1458 (42) | −0.31 | 3311 (33) | 1181 (35) | 0.033 |
| Heart Failure | 165 (1.7) | 179 (5.0) | −0.18 | 332 (3.4) | 111 (3.1) | −0.003 |
| Diabetes Mellitus | 223 (2.3) | 104 (2.9) | −0.039 | 273 (2.8) | 110 (3.1) | 0.032 |
| Vascular disease | 534 (5.5) | 165 (3.9) | 0.077 | 513 (5.3) | 181 (5.1) | 0.009 |
| Abnormal liver function | 1749 (18) | 751 (19) | −0.034 | 1828 (18) | 722 (21) | 0.076 |
| Alcohol abuse | 78 (0.80) | 29 (0.81) | −0.001 | 98 (1.0) | 35 (0.97) | 0.004 |
| Anaemia | 1001 (10) | 375 (7.7) | 0.067 | 931 (9.6) | 397 (12) | 0.084 |
| Atherosclerosis | 758 (7.8) | 200 (5.6) | 0.11 | 778 (8.01) | 317 (8.9) | 0.060 |
| Bleed predisposition | 632 (6.5) | 193 (5.4) | 0.043 | 646 (6.6) | 291 (8.2) | 0.089 |
| Cancer | 1874 (19) | 750 (21) | −0.052 | 2082 (21) | 829 (24) | 0.008 |
| Duodenitis/Gastritis | 1688 (17) | 659 (19) | −0.057 | 1739 (17) | 676 (20) | 0.064 |
| Dyslipidaemia | 2474 (25) | 635 (18) | 0.16 | 2346 (26) | 883 (23) | 0.060 |
| Fracture | 272 (2.8) | 118 (2.9) | −0.003 | 292 (3.00) | 121 (3.4) | 0.039 |
| Peptic ulcer | 700 (7.2) | 261 (7.2) | −0.000 | 770 (7.9) | 295 (8.3) | 0.038 |
| Pulmonary disease | 1165 (11) | 459 (13) | −0.036 | 1248 (12) | 470 (14) | 0.040 |
| Renal disease | 418 (4.3) | 171 (4.2) | 0.016 | 458 (4.7) | 213 (5.001) | 0.082 |
| Baseline medication | ||||||
| Aspirin | 10 (0.10) | 21 (1.5) | −0.15 | 72 (0.74) | 17 (0.48) | −0.024 |
| P2Y12 inhibitor | 4 (0.041) | 24 (0.67) | −0.11 | 26 (0.27) | 8 (0.22) | −0.005 |
| Beta-blocker | 1587 (17) | 1615 (44) | −0.63 | 2610 (26) | 891 (26) | 0.001 |
| Ca channel blocker | 2254 (23) | 1664 (47) | −0.53 | 3199 (32) | 1156 (34) | 0.042 |
| Diuretic | 350 (3.6) | 429 (12) | −0.30 | 699 (7.2) | 233 (6.5) | −0.005 |
| RAAS inhibitor | 1842 (19) | 1543 (43) | −0.52 | 2813 (28) | 891 (30) | 0.032 |
| Corticosteroid | 583 (6.0) | 344 (10) | −0.13 | 804 (8.3) | 340 (10) | 0.071 |
| Digoxin | 126 (1.3) | 204 (5.7) | −0.24 | 299 (3.1) | 94 (2.6) | −0.013 |
| Heparin | 340 (3.5) | 307 (8.6) | −0.21 | 606 (6.2) | 212 (5.9) | 0.007 |
| Insulin | 127 (1.3) | 89 (2.5) | −0.085 | 205 (2.1) | 86 (2.4) | 0.035 |
| NSAIDs | 1165 (12) | 713 (20) | −0.21 | 1491 (15) | 581 (17) | 0.060 |
| Oral antidiabetics | 428 (4.4) | 394 (11) | −0.23 | 751 (7.7) | 259 (7.2) | 0.003 |
| Proton pump inhibitor | 865 (8.9) | 856 (24) | −0.41 | 1492 (15) | 544 (16) | 0.029 |
| Thyroid replacement | 155 (1.6) | 57 (1.6) | −0.002 | 180 (1.9) | 77 (2.1) | 0.035 |
Characteristics of the included patients at the cohort entry date. Patients with initiated NOAC status are included in this table twice.
Data are presented as n (%) or median (interquartile range).
Abbreviations: SMD, standardized mean difference; NOAC, non-vitamin K antagonist oral anticoagulant; NSAID, nonsteroidal anti-inflammatory drug; RAAS, renin-angiotensin-aldosterone system.
Within 716 days following the index date, there were 102, 60, 40, and 62 hospitalizations for stroke, systemic embolism, ICH, and gastrointestinal bleeding, respectively (Table 2). The incidence rates in the nontreatment group were 0.47, 0.34, 0.15, and 0.30 events per 100 person-years for stroke, systemic embolism, ICH, and gastrointestinal bleeding, respectively (Table 2). Although insignificant, the NOAC group exhibited a higher rate of stroke (HR: 1.41, 95% CI: 0.84–2.36) and ICH (HR: 1.73, 95% CI: 0.75–4.00) (Table 3). When the net clinical benefit weights were 1.0, 1.5, and 2.0, NOACs did not yield statistically significant clinical benefits (Table 4).
Unadjusted frequency of events and incidence rates per 100 person-years per treatment group
| Nontreatment (n = 10 002) | NOAC (n = 3406) | |||
|---|---|---|---|---|
| Number of events | Incidence rates (per 100 person-years) | Number of events | Incidence rates (per 100 person-years) | |
| Embolization | 105 | 0.78 | 54 | 0.91 |
| Ischaemic stroke | 68 | 0.47 | 34 | 0.65 |
| Systemic embolization | 39 | 0.34 | 21 | 0.26 |
| Bleeding | 63 | 0.44 | 36 | 0.59 |
| Intracranial haemorrhage | 24 | 0.15 | 16 | 0.26 |
| Gastrointestinal bleeding | 40 | 0.30 | 22 | 0.35 |
Abbreviations: NOAC, non-vitamin K antagonist oral anticoagulant.
Propensity-score inverse probability of treatment weighted Cox regression analyses estimating hazard ratios for NOAC treatment vs. nontreatment from the main analysis
| Hazard ratio (95% confidence interval) | P-value | |
|---|---|---|
| Embolization | 1.16 (0.77–1.77) | 0.48 |
| Ischaemic stroke | 1.41 (0.84–2.36) | 0.36 |
| Systemic embolization | 0.76 (0.40–1.45) | 0.41 |
| Bleeding | 1.34 (0.76–2.36) | 0.31 |
| Intracranial haemorrhage | 1.73 (0.75–4.00) | 0.20 |
| Gastrointestinal bleeding | 1.18 (0.57–2.46) | 0.65 |
Abbreviations: NOAC, non-vitamin K antagonist oral anticoagulant.
Estimated net clinical benefit of NOAC treatment vs. nontreatment with varied weighting factors
| Weighting factor | Net clinical benefit | P-value |
|---|---|---|
| ICH × 1 | −0.30 (−0.85–0.26) | 0.30 |
| ICH × 1.5 | −0.35 (−0.99–0.29) | 0.29 |
| ICH × 2 | −0.40 (−1.17–0.36) | 0.31 |
| Weighting factor | Net clinical benefit | P-value |
|---|---|---|
| ICH × 1 | −0.30 (−0.85–0.26) | 0.30 |
| ICH × 1.5 | −0.35 (−0.99–0.29) | 0.29 |
| ICH × 2 | −0.40 (−1.17–0.36) | 0.31 |
The estimated net clinical benefit, computed using the formula provided in the text, reveals the number of strokes prevented without causing excess ICHs per 100 treatment-years.
Abbreviations: NOAC, non-vitamin K antagonist oral anticoagulant; ICH, intracranial haemorrhage.
Analysis using the 90-day exposure period prior to AF diagnosis presented results similar to those in the main analysis; however, although not significant, the point estimate of the rate of ICH between the NOAC and nontreatment groups (HR: 0.95, 95% CI: 0.39–2.32) was lower than in the main analysis (Table 5).
Propensity-score inverse probability of treatment weighted Cox regression analyses estimating the hazard ratios for NOAC treatment vs. nontreatment from additional analysis (prior exposure method)
| Hazard ratio (95% confidence interval) | P-value | |
|---|---|---|
| Embolization | 1.36 (0.86–2.16) | 0.19 |
| Ischaemic Stroke | 1.54 (0.87–2.70) | 0.14 |
| Systemic embolization | 0.98 (0.35–2.09) | 0.95 |
| Bleeding | 1.15 (0.69–1.93) | 0.60 |
| Intracranial haemorrhage | 0.95 (0.39–2.32) | 0.91 |
| Gastrointestinal bleeding | 1.26 (0.67–2.37) | 0.48 |
Abbreviations: NOAC, non-vitamin K antagonist oral anticoagulant.
When the exposure windows were 30, 90, and 365 days, all HRs for each outcome event were attenuated according to longer windows (Supplementary material online, Table S7). In both analyses using the landmark and exclusion methods—wherein person-time year before the date of prescription was excluded—the results were consistent with those from the main method (Supplementary material online, Table S8).
Another sensitivity analysis showed similar results where the observation was censored for patients who started antiplatelet therapy during follow-up (Supplementary material online, Table S9).
In the subgroup analysis, the result was consistent with those from the main analysis (Supplementary material online, Table S10). The results were similar for patients in the 65–74 years age group and for patients aged ≤65 years with another variable of the CHA2DS2-VASc score.
Discussion
Although not statistically significant, this population-based observational study of Japanese patients with AF demonstrates that NOAC treatment following AF diagnosis exhibits a trend towards an increased risk of ICH without reducing the risk of stroke, resulting in a neutral clinical benefit. The impact of immortal time bias on our results was modest when judged by the sensitivity analysis using the landmark method; accounting for immoral time bias, the other sensitivity analysis supported our results in the main analysis. Additional analysis using methods in accordance with the previous study did not indicate an increase in ICH risk in the NOAC group.
The reported risk of stroke in patients with AF and a single, nonsex CHA2DS2-VASc risk factor was inconsistent (0.1–1.55 events/100 person-years).16,27,28 This variability in the reported risk of stroke may be explained by the difference in study periods (lower risk in recent cohorts), geography, ethnicity, follow-up duration (increased risk with longer follow-up), and prevalence of specific risk factors of stroke in the study population.7,10,17,29 Accounting for these differences, the risk of stroke in the present study was consistent with previous observational studies and was below the threshold (0.9 events/100 person-years). Consequently, NOAC treatment was not associated with a lower risk of stroke.
Regarding ICH, large randomized controlled clinical trials have indicated that Asian patients are more susceptible to NOAC-related ICH than other ethnic groups.12–14 Several factors may be attributed to this higher risk of ICH among Asians, such as the higher prevalence of CKD and differences in pharmacokinetic profiles. Reportedly, Taiwanese patients have a high prevalence of CKD, which may result in increased plasma concentrations of NOACs, and a higher risk of ICH.30 Additionally, a post hoc secondary analysis of the ENGAGE AF-TIMI 48 trial revealed that the ICH risk surpassed the risk of ischaemic stroke with an elevation of the trough concentration of edoxaban in Asians.31 Ethnicity should thus be considered in risk-benefit assessments for patients with AF, as Asians are more prone to harm than non-Asians. In fact, the present study in Japanese patients with AF suggests that NOAC treatment may be associated with a higher risk of ICH in the Asian population.
When considering the risk of ICH, a net clinical benefit is preferred to the threshold. A study of Western European databases reported that NOAC treatment was associated with reduced stroke risk without increasing the rate of ICH development, resulting in positive clinical benefits.8 The discrepancy between the previous and present studies may be attributed to the differences in ethnicity, methodology, and HAS-BLED scores. That is, Asians are known to have a lower stroke risk and higher ICH risk than other ethnicities.9,12,32,33 These ethnic characteristics would lead to the neutral clinical benefit observed in this study. Regarding methodology, participants taking oral anticoagulation prior to study enrollment were assigned to oral anticoagulation groups in some trials.16,28 However, these settings likely underestimate the bleeding risk in the oral anticoagulation group, as patients who were prescribed NOACs and subsequently encountered bleeding events may have discontinued treatment or been excluded from the cohort study. Conversely, when the exposure window was set after patient entry, as in the present study, immortal time bias would remain.34 Although the studies using Western European databases accounted for immortal time bias, the methods used in these studies are thought to underestimate the bleeding rate.27,35,36 In fact, additional analysis in the present study demonstrated that if the exposure window was set before cohort entry, the risk of ICH may be underestimated. Finally, the HAS-BLED score of the NOAC group in this study was 1.04; this may have been underestimated due to the lack of data on certain risk factors, including blood pressure and laboratory data. It was previously suggested that annual bleeding rates in patients with a HAS-BLED score of 2 would outweigh the risk of stroke associated with a CHA2DS2-VASc score of 1.37 Differences in ethnicity, methodology, and HAS-BLED scores may therefore have contributed to the higher risk of ICH observed in this study.
Some studies reported heterogeneity in individuals with AF and a CHA2DS2-VASc score of 1; in particular, age appeared to be the most important risk factor. Patients in the present study were approximately 5 years younger than those in the previous study.8 Moreover, a study using Canadian databases reported that the risk of stroke more than doubled with increasing age in patients with AF aged 66–74 years.38 A study of patients with AF in Taiwan reported age thresholds for NOAC initiation with a different single risk factor (age more than 35 years for HF, 50 years for hypertension or diabetes, and 55 years for vascular disease).7 We performed subgroup analyses to evaluate the heterogeneity of the constituents of the CHA2DS2-VASc score since the risks of stroke and bleeding steadily increase with every passing year.38 Although the stratified results between age and another component were almost similar, further study is needed to assess personalized decision-making and comprehensive weighting of the respective risk factors.
Our study has several limitations; first, the HR for each outcome in this main analysis is influenced by immortal time bias, which tends to underestimate the HR. However, we confirmed that the effect of immortal time bias was trivial, as the results of our sensitivity analyses were consistent with those of the main analysis. Second, the definition of AF employed in the current study has not been validated. The specificity of the diagnosis for AF may be higher in the NOAC than nontreatment group. This misclassification may result in an overestimation of the HR for each outcome, contributing to a numerically higher risk of stroke in the NOAC group. Third, although we used IPTW to adjust for measured confounders, residual confounding cannot be excluded, particularly regarding socioeconomic status, echocardiography data, and blood pressure control. Finally, we could not identify whether the appropriate dose was prescribed because data on creatinine clearance was unavailable in the database.
In conclusion, this population-based observational study of Japanese patients with AF at low risk of stroke found that NOAC treatment may be associated with slightly higher ICH risk, without lowering the risk of stroke. Our data suggest that NOAC treatment was associated with a neutral clinical benefit in the studied population, and provides reassurance concerning ethnicity in NOAC treatment to prevent stroke in patients with AF early in their disease course due to the prevalence of CKD and the pharmacokinetic profile in particular populations.30,31 This neutral clinical benefit implies a need to explore further evidence for personalized decision-making and comprehensive weighting of the respective risk factors.
Acknowledgement
This work was supported by grants from the Ministry of Health, Labour, and Welfare, Japan (21AA2007) and the Ministry of Education, Culture, Sports, Science, and Technology, Japan (20H03907).
Funding
This work was supported by a grant from the Ministry of Health, Labour, and Welfare, Japan (23AA2003).
Conflict of interest: All authors declare that they do not have any conflicts of interest.
Data availability
The data that support the findings of this study are available from JMDC. Inc but restrictions apply to the availability of these data, which were used under license for the current study, and so are not publicly available. Data are however available from the authors upon reasonable request and with permission of JMDC. Inc.
Disclosures
I certify that all my affiliations or financial involvement with any organization or financial conflict with the subject matter discussed in the manuscript are completely disclosed in the acknowledgement section of the manuscript.
