


Abstract
Although impaired left ventricular (LV) global longitudinal strain (GLS) with apical sparing is a feature of cardiac amyloidosis (CA), its diagnostic accuracy has varied across studies. We aimed to determine the ability of apical sparing ratio (ASR) and most common echocardiographic parameters to differentiate patients with confirmed CA from those with clinical and/or echocardiographic suspicion of CA but with this diagnosis ruled out.
We identified 544 patients with confirmed CA and 200 controls (CTRLs) as defined above (CTRL patients). Measurements from transthoracic echocardiograms were performed using artificial intelligence software (Us2.AI, Singapore) and audited by an experienced echocardiographer. Receiver operating characteristic curve analysis was used to evaluate the diagnostic performance and optimal cut-offs for the differentiation of CA patients from CTRL patients. Additionally, a group of 174 healthy subjects (healthy CTRL) was included to provide insight on how patients and healthy CTRLs differed echocardiographically. LV GLS was more impaired (−13.9 ± 4.6% vs. −15.9 ± 2.7%, P < 0.0005), and ASR was higher (2.4 ± 1.2 vs. 1.7 ± 0.9, P < 0.0005) in the CA group vs. CTRL patients. Relative wall thickness and ASR were the most accurate parameters for differentiating CA from CTRL patients [area under the curve (AUC): 0.77 and 0.74, respectively]. However, even with the optimal cut-off of 1.67, ASR was only 72% sensitive and 66% specific for CA, indicating the presence of apical sparing in 32% of CTRL patients and even in 6% healthy subjects.
Apical sparing did not prove to be a CA-specific biomarker for accurate identification of CA, when compared with clinically similar CTRLs with no CA.
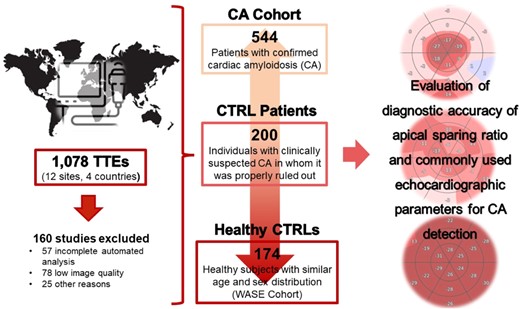
Schematic workflow used for data collection and analysis.
Introduction
Amyloidosis is a disease characterized by the presence of structurally unstable proteins that misfold, accumulate, and ultimately deposit in tissues as amyloid fibrils. When these abnormal proteins aggregate in the interstitial extracellular space of the heart, cardiac amyloidosis (CA) sets in, mainly involving either misfolded monoclonal immunoglobulin light chains that leads to light chain amyloidosis (AL) or a liver-synthesized protein leading to transthyretin amyloidosis (ATTR).1 Despite specific differences in prevalence, prognosis, clinical presentation, and treatment options in these two predominant types of amyloidosis, cardiac involvement is significantly more common than previously thought, having clear prognostic and therapeutic implications.1
Echocardiography remains the first-line imaging modality for patients presenting with symptoms of heart failure (HF), most often serving as a gatekeeper for further testing with serum and urine light chain assessment, cardiac magnetic resonance (CMR), technetium pyrophosphate bone scintigraphy (Tc99-PYP), or invasive endomyocardial biopsy (EMB). Among the echocardiographic features that differentiate CA from other aetiologies within the left ventricular hypertrophy (LVH) spectrum, the apical sparing pattern in longitudinal strain (LS) has been considered a hallmark of CA, given its proven incremental diagnostic2–4 and prognostic value.5 Nevertheless, the presence of similar echocardiographic findings and myocardial deformation patterns in non-CA scenarios, such as end-stage renal disease and severe aortic stenosis, raised concerns about the limitations of apical sparing ratio (ASR) and other echocardiographic parameters as screening tools for CA.6–8
Most studies reporting on the diagnostic accuracy of echocardiography and ASR for the detection of CA were conducted in relatively small, single-centre cohorts, mainly limited to highly selected populations.2,3,9,10 Moreover, due to the frequent similarities in clinical presentations between patients with and without CA, particularly at early stages of disease, better understanding of the accuracy and limitations of echocardiographic parameters used for CA evaluation is of paramount importance. Given the frontline role of echocardiography in this context, overreliance on the presence of ASR may result in delayed diagnosis and access to lifesaving therapies in CA patients who do not show this pattern.11,12
Advances in CMR and Tc99-PYP bone scintigraphy have led to substantial changes in the diagnostic approach of CA,13 aiding not only in confirming the non-invasive diagnosis but also in clearly excluding it in other conditions with similar clinical presentations. Accordingly, we conducted an international, multicentre study aimed at evaluating the diagnostic accuracy of ASR and other commonly used echocardiographic parameters for CA diagnosis in a large population of patients with confirmed CA against a control (CTRL) group of patients with initial clinical concern for CA, in whom it was appropriately ruled out using the latest guidelines.13
Methods
Study population
A total of 544 patients with confirmed CA (375 ATTR, 169 AL) in the period May 2001–January 2023 from 12 centres in 4 countries were retrospectively included. The study received approval from the ethics committee at each participating centre. Cardiac involvement in patients with AL amyloidosis was defined according to guidelines by either EMB containing AL amyloid on mass spectrometry or, if a cardiac biopsy was not available, by the combination of typical features on CMR and the presence of histologically proven systemic AL amyloidosis in a non-cardiac biopsy.13 Cardiac ATTR amyloidosis was defined either by the presence of ATTR fibrils on EMB with mass spectrometry or Grade 2 or 3 cardiac uptake on Tc99-PYP in the absence of a monoclonal gammopathy.14,15
A CTRL group of 200 patients with clinical and/or echocardiographic suspicion for CA, who were found to be negative for CA in accordance with guideline-directed screening using either EMB or the combination of negative Tc99-PYP and light chains, were included (CTRL patients).13 Patients with insufficient or inconclusive information to rule out CA were excluded.
Basic demographic data and relevant clinical information for both the CA and CTRL patient groups were obtained from medical records. HF was clinically defined by the presence of symptoms [New York Heart Association (NYHA) class > 1], and its severity was assessed by elevated N-terminal pro-brain natriuretic peptide (NT-proBNP) plasma levels according to current guidelines.16 The closest-to-echo serum kappa and lambda chains plasma levels were analysed as continuous variables. The presence of serum and urine monoclonal proteins on immunofixation or electrophoresis was defined as a dichotomous variable.
In addition, a second CTRL group (healthy CTRL) was used, consisting of 174 healthy subjects with similar age, sex, and race distributions, enrolled in the World Alliance Societies of Echocardiography (WASE) Study.17 The purpose of having a healthy CTRL group was to provide insight into how far from normal the CA and CTRL patient groups were from the echocardiography perspective and thus facilitate the interpretation of the results of this study.
Echocardiographic analysis
2D transthoracic echocardiograms (TTEs) were obtained by trained sonographers using commercial ultrasound systems (Philips or GE). Index TTEs were retrospectively identified at each site and used as reference for concurrent selection of baseline patient data. For patients in the CA group, the index TTE was defined as the latest study available prior to the diagnosis of CA. For subjects in the CTRL patient group, the index TTE was defined as the latest available study acquired before specific CA studies were initiated. All collected studies were deidentified at each site prior to being submitted to a centralized core-lab (University of Chicago, Chicago, Illinois). Images were analysed using validated software approved by the Food and Drug Administration for fully automated classification, annotation, and measurement of echocardiographic images (Us2.AI, Singapore).18,19
A rigorous confidence check process was utilized to ensure accuracy of the automated measurements, which were corrected as deemed necessary by a Level 3 echocardiographer (J.C.). The Us2.AI’s convolutional neural network follows decision rules based on the highest-quality data found across all image files and all frames within each file, discarding or not performing any measurements in those images where quality rules were not fulfilled.
For each TTE data set, a human expert (J.C.) chose the best image for analysis according to current American Society of Echocardiography (ASE)/European Association of Cardiovascular Imaging (EACVI) guidelines.20 Among the multiple automated measurements that the software provides for each parameter, a single value was selected based on the judgement of the expert. In cases of atrial fibrillation or significant beat-to-beat variability, the final measurement was obtained by averaging five representative beats.
The LV relative wall thickness (RWT) and LV mass index (LVMi) were automatically provided by the software using standard methods [RWT = 2 × left ventricular posterior wall thickness at end-diastole (LVPWd)/left ventricular internal diameter at end-diastole (LVIDd); LVMi by the cube function formula, as recommended by Devereux et al.21]. The ASR value was manually calculated as the ratio of LS in apical to non-apical (basal and mid) LV segments, based on a 16-segment LV model. The LVEF to LV GLS ratio and the LVMi to GLS ratio were calculated as previously described.21,22 The AMYLoidosis Index (AMYLI) score was defined as the product of RWT and E/e′ ratio.22–24 Myocardial contraction fraction (MCF) was calculated as the ratio between biplane LV stroke volume and myocardial volume (LV mass/1.05 g/cm2).25,26
Studies with incomplete automated analysis of biplane LV and/or left atrial (LA) volumes, inadequate tracking of the endocardium for strain analysis, or low-quality criteria according to expert reader’s determination (defined as lack of endocardial visualization in ≥2 segments or clearly foreshortened images) were excluded. Patients with significant valvular disease (≥ moderate valvular regurgitation, severe mitral annular calcification, severe mitral stenosis, or prior history of valve surgery) and/or LV assist devices were excluded. Three-dimensional data sets and images with ultrasound enhancing agents were not used in this study.
Statistical analysis
All measurements are expressed as mean ± SD. Inter-group differences were evaluated using the unpaired two-tailed Student’s t-tests. In cases of three-group comparisons, analysis of variance (ANOVA) was first used to identify significant differences. Statistical significance was defined as P < 0.05. Diagnostic accuracy was evaluated by receiver operating curve (ROC) analysis using the area under the curve (AUC or C-statistic). In addition, these curves were used to derive optimal cut-offs of each parameter for the differentiation of CA patients from CTRL patients and from healthy CTRL subjects by optimizing the overall accuracy.
Results
Demographic and clinical data
The Graphical Abstract shows a brief representation of the workflow used for data collection and analysis in our study. A total of 1078 2D TTEs (664 CA, 240 CTRL patients, and 174 healthy CTRL) were initially uploaded for automated analysis. After expert review, 160 studies (15%) were excluded. Of these, 57 studies were incompletely interpreted by the software, 78 were manually excluded due to low quality of the images and 25 for other reasons defined in the Methods above, resulting in 544 CA, 200 CTRL patients, and 174 healthy CTRL. Table 1 shows basic demographics in the CA and CTRL patients and expected differences in clinical data. Within the CTRL patient group, 51% had more than one clinical indication that prompted CA diagnostic workup. These underlying conditions included HF with reduced left ventricular ejection fraction (LVEF) (41%), HF with preserved LVEF (28%), unexplained LVH (15%), end-stage renal disease (12%), and other reasons (4%). Of note, 16 patients in the CA group (3%) and 31 patients in the CTRL patient group (15%) had mean aortic valve gradients > 40 mmHg and aortic valve area < 1.5 cm2. In the CA cohort, 49 patients (9%) were in atrial fibrillation and 18 (3%) had intracardiac devices (i.e. pacemaker or defibrillator) at the time of TTE.
Basic demographic and clinical data in the cardiac amyloid (CA) and control patient groups. All values are expressed as mean ± SD
| CTRL patients | CA patients | P-value | |
|---|---|---|---|
| n | 200 | 544 | |
| Demographics | |||
| Male sex (n, %) | 114, 57.0 | 418, 76.7 | 0.050 |
| Age (years) | 74 ± 12 | 73 ± 11 | 0.188 |
| Height (cm) | 169 ± 11 | 172 ± 11 | 0.002 |
| Weight (kg) | 82 ± 21 | 81 ± 18 | 0.360 |
| Body surface area (m2) | 1.94 ± 0.31 | 1.95 ± 0.24 | 0.615 |
| Clinical data | |||
| Heart rate (bpm) | 72 ± 9 | 74 ± 12 | 0.243 |
| Heart failure (%) | 70 | 65 | 0.734 |
| Serum kappa (mg/L) | 6 ± 14 | 37 ± 103 | 0.000 |
| Serum lambda (mg/L) | 4 ± 5 | 67 ± 254 | 0.002 |
| Serum monoclonal protein present (SPIE/SPEP) (%) | 20 | 37 | 0.092 |
| Urine monoclonal protein present (UPIE/UPEP) (%) | 3 | 33 | 0.001 |
| Creatinine (mg/dL) | 1.8 ± 1.8 | 1.7 ± 1.4 | 0.311 |
| eGFR (mL/min/1.73m2) | 55 ± 28 | 53 ± 26 | 0.587 |
| NT-proBNP | 6328 ± 15 263 | 6321 ± 11 451 | 0.995 |
P-values < 0.05 are shown in bold.
LV anatomical and functional assessment
Table 2 shows the echocardiographic measurements for all three groups. Not surprisingly, significant differences were observed for all these parameters when comparing the healthy CTRL group and both the CA and CTRL patient cohorts. This is with the exception of the LV internal diameter and indexed volume at end-diastole (LVIDd and LVEDVi, respectively), which showed small, non-significant differences between the CA and healthy CTRL groups. The LV anatomical parameters between the CA cohort and the CTRL patient group showed that the latter had significantly larger LVIDd and LVEDVi and less thick left ventricles, as evidenced by a smaller LV posterior wall and interventricular septal thickness at end-diastole (LVPWd and IVSd, respectively) and smaller RWT values. However, differences in LVMi were not statistically significant. From a functional perspective, LVEF was significantly higher in the CTRL patients than in the CA group (52.5 ± 19.2% vs. 49.3 ± 13.4%, P = 0.008), while parameters of diastolic function (E/A ratio, E/e′, e′, and deceleration time) were significantly worse in the latter (P < 0.05 for all).
Observed differences in the echocardiographic parameters between cardiac amyloid (CA) patients, control (CTRL) patients, and healthy control groups. All values are expressed as mean ± SD
| CTRL patients | CA patients | Healthy CTRL | P: CA vs. CTRL patients | P: CA vs. healthy CTRL | P: CTRL patients vs. healthy CTRL | |
|---|---|---|---|---|---|---|
| LVIDd (mm) | 45.6 ± 8.5 | 40.7 ± 7.1 | 41.8 ± 5.2 | 0.000 | 0.054 | 0.000 |
| LVPWd (mm) | 11.4 ± 2.4 | 14.1 ± 3.0 | 8.6 ± 1.1 | 0.000 | 0.000 | 0.000 |
| IVSd (mm) | 11.8 ± 2.4 | 13.2 ± 2.6 | 8.7 ± 1.4 | 0.000 | 0.000 | 0.000 |
| LVMi (gm/m2) | 104 ± 34 | 108 ± 33 | 64 ± 12 | 0.403 | 0.000 | 0.000 |
| RWT | 0.52 ± 0.16 | 0.71 ± 0.21 | 0.42 ± 0.08 | 0.000 | 0.000 | 0.000 |
| LVEDVi (mL/m2) | 57.2 ± 19.2 | 44.3 ± 16.4 | 44.6 ± 11.0 | 0.000 | 0.803 | 0.000 |
| LVEF (%) | 52.5 ± 14.6 | 49.3 ± 13.4 | 65.1 ± 6.1 | 0.008 | 0.000 | 0.000 |
| E/A ratio | 1.12 ± 0.54 | 1.51 ± 0.64 | 1.00 ± 0.35 | 0.000 | 0.000 | 0.017 |
| E/e′ | 15.1 ± 6.4 | 17.8 ± 7.0 | 8.3 ± 2.4 | 0.000 | 0.000 | 0.000 |
| e′ (cm/s) | 6.50 ± 2.15 | 5.33 ± 1.86 | 8.82 ± 2.19 | 0.000 | 0.000 | 0.000 |
| DT (ms) | 197 ± 40 | 187 ± 37 | 212 ± 36 | 0.007 | 0.000 | 0.000 |
| LV GLS (%) | −15.6 ± 5.1 | −13.9 ± 4.6 | −20.6 ± 2.7 | 0.000 | 0.000 | 0.000 |
| Apical LS (%) | −20.3 ± 8.1 | −21.9 ± 8.3 | −24.4 ± 4.6 | 0.024 | 0.017 | 0.000 |
| Non-apical LS (%) | −13.6 ± 4.3 | −10.2 ± 4.0 | −19.7 ± 2.3 | 0.000 | 0.000 | 0.000 |
| Apical sparing ratio | 1.6 ± 0.7 | 2.4 ± 1.2 | 1.2 ± 0.2 | 0.000 | 0.000 | 0.000 |
| EF to LS ratio | 3.5 ± 0.8 | 3.8 ± 1.0 | 3.2 ± 0.3 | 0.000 | 0.000 | 0.000 |
| LVMi to LS ratio | 8.3 ± 5.2 | 9.0 ± 4.9 | 2.9 ± 0.6 | 0.266 | 0.000 | 0.000 |
| AMYLI | 7.6 ± 3.8 | 13.0 ± 7.3 | 3.5 ± 1.5 | 0.000 | 0.000 | 0.000 |
| MCF (%) | 30 ± 11 | 23 ± 10 | 48 ± 12 | 0.000 | 0.000 | 0.000 |
| RVIDd basal (mm) | 38.9 ± 8.6 | 39.3 ± 7.8 | 33.9 ± 6.0 | 0.551 | 0.000 | 0.000 |
| RVIDd mid (mm) | 32.2 ± 7.5 | 31.4 ± 7.2 | 27.8 ± 5.2 | 0.293 | 0.000 | 0.000 |
| TAPSE (mm) | 20.2 ± 5.0 | 16.9 ± 4.3 | 22.5 ± 4.0 | 0.000 | 0.000 | 0.000 |
| RV s′ (cm/s) | 10.8 ± 3.0 | 9.3 ± 3.3 | 12.0 ± 2.4 | 0.000 | 0.000 | 0.001 |
| RV FAC (%) | 38.6 ± 12.5 | 31.2 ± 11.0 | 42.4 ± 9.5 | 0.000 | 0.000 | 0.009 |
| TR Vmax (m/s) | 2.66 ± 0.64 | 2.55 ± 0.55 | 2.26 ± 0.48 | 0.031 | 0.000 | 0.000 |
| PASP (mmHg) | 37.9 ± 15.7 | 35.8 ± 13.8 | 26.6 ± 8.3 | 0.117 | 0.000 | 0.000 |
| LAESVi (mL/m2) | 41.5 ± 14.9 | 39.4 ± 12.7 | 23.6 ± 7.0 | 0.213 | 0.000 | 0.000 |
| LA reservoir strain (%) | 18.1 ± 9.8 | 13.3 ± 7.9 | 34.3 ± 8.8 | 0.000 | 0.000 | 0.000 |
P-values < 0.05 are shown in bold.
FAC, fractional area change; LVIDd, left ventricular internal diastolic diameter at end-diastole; LVPWd, left ventricular posterior wall thickness at end-diastole; IVSd, interventricular septum thickness at end-diastole; LVMi, left ventricular mass indexed; PASP, pulmonary artery systolic pressure; RVIDd, right ventricular internal diameter at end-diastole; TAPSE, tricuspid annular peak-systolic excursion; TR Vmax, maximum velocity of tricuspid regurgitation jet; LVEDVi, left ventricular end-diastolic volume indexed; LVEF, left ventricular ejection fraction; DT, deceleration time; LV GLS, left ventricular global longitudinal strain; LS, longitudinal strain; AMYLI, AMYLoidosis Index score; LA, left atrium; LAESVi, left atrial end-systolic volume indexed; MCF, myocardial contraction fraction.
LA volume and strain analysis
While differences in LA end-systolic volume index between CA patients and the CTRL patient group were not significant (P = 0.213), statistically significant differences were noted in LA reservoir strain (P < 0.05), with absolute values up to 25% lower in the CA group when compared with the CTRL patient cohort.
LV strain analysis
Significant differences were noted in LV GLS between all three groups. LV GLS was significantly more impaired in CA as compared with both CTRL patients and healthy CTRL (P < 0.05). Although LS of apical segments was significantly better in the CA group (P = 0.024), the differences in LV GLS were mostly driven by a worse (i.e. less negative) non-apical LS in the CA group (P < 0.05). Consequently, ASR was significantly higher in CA group when compared with the CTRL patients (2.4 ± 1.2 vs. 1.6 ± 0.7, P < 0.05). Of note, there was no significant difference in ASR between the two types of CA: 2.5 ± 1.4 in AL vs. 2.3 ± 1.2 in AL (P = 0.23). While the EF to LS ratio and the AMYLI score were significantly higher in the CA cohort, the differences in the LVMi to LS ratio between these patients and the CTRL patients were not statistically significant (P = 0.266).
Optimization of ASR cutoff
Table 3 shows the percentage of patients with apical sparing using different ASR cut-off values from 1.0 to ≥2.0 in the three cohorts. As expected, higher ASR cut-offs resulted in lower percentages of individuals with apical sparing in all three groups. Importantly, no ASR cut-off in the above range resulted in zero patients with apical sparing in the CTRL patient group, and even in the healthy CTRL group, a cut-off value as high as 1.8 was necessary to have zero patients with apical sparing. Of note, an ASR ≥ 2.0, previously suggested as the optimal cut-off to identify patients with CA,27 indicated apical sparing in only 55% of subjects with CA but also in 18% of the CTRL patient group, in whom CA had been ruled out.
Percentage of patients with apical sparing of longitudinal strain using different cut-offs of apical to non-apical strain ratio in the different groups of patients
| Apical to non-apical strain ratio cut-off | ||||||||||||
|---|---|---|---|---|---|---|---|---|---|---|---|---|
| n | ≥1.0 | ≥1.1 | ≥1.2 | ≥1.3 | ≥1.4 | ≥1.5 | ≥1.6 | ≥1.7 | ≥1.8 | ≥1.9 | ≥2.0 | |
| Control patients | 200 | 85 | 79 | 71 | 62 | 56 | 44 | 38 | 32 | 26 | 21 | 18 |
| Healthy controls | 174 | 95 | 76 | 50 | 35 | 18 | 12 | 10 | 6 | 0 | 0 | 0 |
| CA patients | 544 | 96 | 95 | 92 | 88 | 86 | 82 | 78 | 72 | 64 | 59 | 55 |
Evaluation of potential confounders
In addition, to account for the potential confounding effects of including patients with aortic stenosis in our study, we repeated our analysis after excluding all patients with mean aortic gradient > 40 mmHg and/or aortic valve area < 1.5 cm2 from both the CA and CTRL patient groups (n = 61 and n = 25, respectively) but found that aortic stenosis did not play a significant role in our findings. Similarly, excluding patients with significant coronary artery disease had no meaningful effect on the results. Finally, neither sex nor age was found to play a significant role in the reported findings.
Accuracy of commonly used echocardiographic parameters of CA
Figure 1 shows the ROC curves for three best echocardiographic parameters, with the corresponding AUC values and optimal cut-offs for detection of CA. Table 4 shows the results of the accuracy metrics for the optimal cut-offs of multiple parameters. Briefly, all parameters showed limited accuracy for CA detection, as evidenced by AUC < 0.8. RWT > 0.57, LVEDVi < 53 mL/m2, ASR > 1.67, and AMYLI > 7.8, showed the best diagnostic performance with AUC values between 0.7 and 0.8. Combining the former three easily measured parameters by requiring at least one of them to be abnormal resulted in an increase in sensitivity to 0.93 and in overall accuracy to 0.83, at the expense of a decrease in specificity to 0.39.
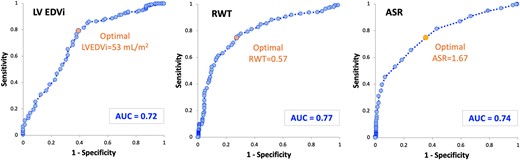
ROC curves for the three echocardiographic parameters with highest accuracy of detection of CA. CA, cardiac amyloidosis; LV EDVi, left ventricular end-diastolic volume indexed; RWT, relative wall thickness; ASR, apical sparing ratio.
Receiver operating curve (ROC) analysis and optimal cut-offs for multiple echocardiographic parameters commonly used in the evaluation of cardiac amyloidosis
| ROC AUC | Optimal cut-off | Sensitivity | Specificity | NPV | PPV | Accuracy | |
|---|---|---|---|---|---|---|---|
| LV EF | 0.56 | 54 | 0.60 | 0.48 | 0.30 | 0.76 | 0.55 |
| LV EDVi | 0.72 | 53 | 0.79 | 0.61 | 0.32 | 0.92 | 0.74 |
| RWT | 0.77 | 0.57 | 0.74 | 0.73 | 0.51 | 0.88 | 0.74 |
| E/A | 0.67 | 1.06 | 0.68 | 0.61 | 0.52 | 0.74 | 0.65 |
| E/e′ | 0.62 | 18.4 | 0.38 | 0.73 | 0.32 | 0.80 | 0.50 |
| LV GLS | 0.57 | −17.0 | 0.71 | 0.42 | 0.35 | 0.77 | 0.64 |
| ASR | 0.74 | 1.67 | 0.72 | 0.66 | 0.50 | 0.84 | 0.74 |
| TAPSE | 0.69 | 18.1 | 0.67 | 0.62 | 0.39 | 0.83 | 0.64 |
| RV FAC | 0.68 | 33 | 0.55 | 0.73 | 0.34 | 0.85 | 0.58 |
| LAS | 0.68 | 11 | 0.52 | 0.73 | 0.34 | 0.84 | 0.55 |
| EF/LS | 0.55 | 3.4 | 0.51 | 0.59 | 0.31 | 0.77 | 0.56 |
| LVMi/LS | 0.56 | 6.4 | 0.66 | 0.50 | 0.22 | 0.87 | 0.66 |
| AMYLI | 0.74 | 7.8 | 0.76 | 0.65 | 0.51 | 0.83 | 0.73 |
| MCF | 0.68 | 26 | 0.68 | 0.65 | 0.26 | 0.92 | 0.68 |
Parameters that showed highest accuracy (>0.70) are shown in bold.
LVEF, left ventricular ejection fraction; LVEDVi, left ventricular end-diastolic volume indexed; RWT, relative wall thickness; LV GLS, left ventricular global longitudinal strain; ASR, apical sparing ratio; LAS, left atrial strain; MCF, myocardial contraction fraction; ROC, receiver operating curve; AUC, area under the curve; PPV, positive predictive value; NPV, negative predictive value.
The remaining parameters had AUC values < 0.7, with the worst performance noted for LVEF (AUC 0.56) and LV GLS (AUC 0.57). Parameters of diastolic function and LA strain achieved AUC values between 0.6 and 0.7. Of note, the above ASR cut-off of 2.0 resulted in overall accuracy of only 0.63 (sensitivity 0.51, specificity 0.86), as compared with an accuracy of 0.74 using our optimal cut-off of 1.67 (sensitivity 0.72, specificity 0.66).
Of note, separate ROC analysis showed no meaningful differences between the two types of CA in terms of diagnostic accuracy of ASR (AUC 0.75 for AL and 0.74 for ATTR). Also, optimal cut-offs for CA detection were similar in these two subgroups: 1.6 in AL and 1.7 in ATTR.
Discussion
While CMR can raise suspicion for CA and Tc99-PYP in the proper context can accurately diagnose ATTR-CA non-invasively, echocardiography remains the initial test that raises suspicion of this diagnosis and prompts a decision to escalate the diagnostic workup. Our study represents one of the largest and most diverse cohorts of CA patients reported in the literature, including a large CTRL group with clinically similar findings but clearly excluded CA. Importantly, no previous study specifically focused on this aspect. We assessed the accuracy of echocardiographic parameters, including ASR, for the differentiation of CA from CTRL patients and healthy CTRL subjects and found that despite ASR being significantly different across groups, values above cut-off for CA diagnosis were present in one-third of CTRL patients without CA, resulting in only modest accuracy of ASR for CA diagnosis.
Unfortunately, CA is still an underrecognized or diagnosed late in the course of the disease. This can be partly explained by the often-non-specific clinical presentation of CA mimicking other cardiomyopathies, its phenotypic heterogeneity, and the frequent coexistence with other aetiologies of HF and/or LVH. However, insufficient physician awareness should not be underestimated, and there is still a strong need for practice improvement. Of note, Wali et al.28 has recently reported that the presence of apical sparing pattern, using previously suggested ASR cut-offs, could be found in only 30% of patients with confirmed or highly probable CA, mostly in older subjects with increased LV wall thickness. Our results showed that even when using a lower optimal cut-off of 1.67, ASR was only 72% sensitive and 66% specific for differentiating CA patients from clinically similar CTRLs. This is concordant with the recently described6 modest sensitivity and specificity of ASR for diagnosis of CA in a broad population of unselected patients.
Particularly demanding diagnostic scenarios are the non-typical CA cases where the most common echocardiographic features are not that evident, and diagnostic disease awareness is likely low. Some examples can be found in early stages of CA or in those where it is necessary to differentiate CA from other conditions with a similar clinical presentation but with only mildly or even borderline increased LV wall thickness, as our CTRL patient group.4,29 In a cohort of patients with confirmed CA and LV wall thickness < 1.4 cm, Lee et al.27 reported an AUC for ASR of 0.75 (sensitivity 72%, specificity 78%), with a significant overlap between CA and other causes of LVH. These findings are in close agreement with our results, which revealed a relatively poor diagnostic accuracy of ASR, and even when using our optimal cut-off derived in a large cohort of patients with ruled-in and ruled-out CA, we detected apical sparing patterns in up to 32% of the CTRL patients and even in 6% healthy subjects. It is worth noticing that the formula used in our study for ASR differ from the original formula proposed in Phelan et al.,2 based on the sum of the basal and mid LS, resulting in values that are exactly half of those obtained by us.27
Although the presence of ASR has shown to be a strong prognostic marker in patients with CA,5 the pathophysiological mechanisms for apical sparing remain mostly unclear. Theories that included the increase in total amyloid mass in basal and mid-ventricular segments, anatomic differences in the orientation of myocytes in the apex, and increased apoptosis and remodelling in the basal segments have been proposed, yet not fully proven. Interestingly, De Gaspari et al.30 have shown in a histopathological analysis of CA specimens that the presence of the apical sparing pattern is not always explained by a base-to-apex gradient of amyloid burden, suggesting an interplay of more complex interactions beyond amyloid infiltration. For example, this base-to-apex deformation gradient has been described in other populations, including patients with severe aortic stenosis and preserved LVEF.31 Furthermore, despite previously reported structural and functional differences between cardiac AL and ATTR,1 the frequent overlap of these echocardiographic features makes them unsuited to differentiate between CA types. The lack of differences in ASR cut-off values and overall diagnostic accuracy between ATTR and AL types observed in our study reaffirms the limitations of ASR for distinguishing between the two main variants of CA.
These inconsistencies in the diagnostic performance of commonly used echocardiographic features of CA led to the emergence of alternative and potentially better echocardiographic markers of CA. Among these, LVEF/GLS ratio demonstrated improved discrimination for CA compared with ASR.4,6 Pagourelias et al.4 described the accuracy of LVEF/GLS ratio and deformation indices in detecting CA, emphasizing that this parameter performs well even in challenging subgroups with mild LVH and normal LVEF (AUC 0.96). Interestingly, the mean values of this index in our CA population were slightly lower (3.8 ± 1.0) than the proposed >4.1, which might be related to the effect of a larger sample size with less LVH and worse LVEF than that described in prior cohorts. MCF is able to distinguish patients with CA from those with other causes of increased LV wall thickness.25,26 However, when evaluated in a cohort of patients with LV wall thickness < 16 mm, the diagnostic accuracy of this parameter was 0.62, similar to those observed in our cohort. Although it was suggested that an AMYLI score < 2.22 could accurately exclude the CA diagnosis and avoid further investigations, the mean values of this score in our CTRL patients (7.6 ± 3.8) and even healthy CTRL groups (3.5 ± 1.5) were above that threshold, questioning the real utility of this parameter for rule-out purposes. Our findings showing significant differences in LVEF/GLS ratio, MCF, and AMYLI score between CA patients, and both CTRL groups support the role of these novel indexes to enhance the diagnostic suspicion of CA on echocardiographic studies.
Given the inevitable need for further confirmatory testing in suspected CA cases based on a TTE study, physicians should focus on the most sensitive echocardiographic parameters for CA, albeit at the cost of lower specificity. Indeed, this was demonstrated by the combination of the best three parameters which resulted in improved accuracy of CA detection, driven by marked increase in sensitivity. Importantly, these parameters are routinely measured in daily echocardiography practice worldwide. The diagnostic benefits of using a similar multiparametric approach were recently demonstrated by Boldrini et al.32 in patients with confirmed AL or with increased RWT and CA suspicion.
Several limitations of our study must be acknowledged. As this was a retrospective study, which collected cases from 2001 across multiple sites worldwide, the acquisition protocols, image quality, and software applications utilized are heterogeneous. Furthermore, we acknowledge a lack of additional documentation that would provide useful clinical information regarding the increased volume status, need for diuretic use, or other HF therapies. Also, due to the retrospective multicentre design of the study, we were not able to consistently and reliably compare and interpret troponin data, which varied between sites in terms of availability and assays used. Moreover, the use of the fully automated software for echocardiographic measurements that was not used in prior CA publications might limit the comparisons with our results. However, excellent agreement between automated and manual measurements using this software has been well documented.18,19 Finally, as the role of artificial intelligence in automation of processes continues to expand, we hope that our experience serves as supportive evidence for the implementation of this methodology in future research projects.
Conclusion
The use of apical sparing to identify patients with CA from the spectrum of those with clinically suspected CA has significant limitations. Even when using an optimal ASR cut-off derived in this large cohort of patients with ruled-in and ruled-out CA, apical sparing alone was not found to be a highly sensitive neither specific imaging biomarker of CA, because it was present in about a third of non-CA patients with similar clinical presentation and even in 1/10 of the healthy subjects. However, the sensitivity of echocardiographic diagnosis of CA can be improved by using ASR alongside other equally accurate, widely used parameters. These findings emphasize the need for higher clinical awareness, including integration of clinical and laboratory findings, with appropriate echocardiographic parameters to ensure prompt referrals for confirmatory diagnostic testing. Although echocardiography is a diagnostic pillar of HF and CA, it cannot replace other non-invasive imaging techniques capable of tissue characterization.
Funding
None declared.
Data availability
Data used in this study will not be publicly available.
References
Author notes
Conflict of interest: None declared.
